http://www.diva-portal.org
Preprint
This is the submitted version of a paper published in Energy Journal.
Citation for the original published paper (version of record):
Campillo, J., Dahlquist, E., Wallin, F., Vassileva, I. (2016)
Is real-time electricity pricing suitable for residential users without demand-side management?.
Energy Journal, 109: 310-325
http://dx.doi.org/10.1016/j.energy.2016.04.105
Access to the published version may require subscription.
N.B. When citing this work, cite the original published paper.
Permanent link to this version:
Is real-time electricity pricing suitable for residential users without
demand-side management?
Javier Campilloa, Erik Dahlquista, Fredrik Wallina, Iana Vassilevaa
aSchool of Business, Society and Engineering, M¨alardalen University, Sweden.
Abstract
The smart metering infrastructure in Sweden allows electricity providers to offer electricity real time pricing (RTP) to homeowners, together with other dynamic pricing contracts across the country. These contracts are supposed to encourage users to shift power consumption during peak hours to help balance the load in the power system. Of all the available contracts in Swe-den, monthly-average price holds the largest share, in response to the low electricity prices during the last three years. It is not clear if RTP will become a popular dynamic pricing scheme since daily price fluctuations might keep customers away from this type of contract. Literature review suggests that RTP adoption is only beneficial when combined with the use of customer demand flexibility, but it does not provide enough information about users adopting RTP without chang-ing their electricity usage profile. This paper studies the economic impact if customers would shift to RTP contracts without adopting demand-side management. To achieve this, electric-ity costs from a large group of households were calculated and compared between both pricing schemes using the hourly consumption data of a 7-year period. Results suggest that the RTP elec-tricity contract offer a considerable economic savings potential even without enabling consumer demand-side management.
Keywords: Smart Metering, Dynamic Pricing, Electricity Market, Real-time pricing, Power Systems
1. Introduction
In power systems, the produced power has to equal the consumed one plus the losses in the transmission and distribution systems at all times. Energy storage can be used as a buffer, to help keep the system balanced under unexpected rapid changes between supply and demand, but current technologies provide with limited storage capacity and financial benefits are yet not fully understood [1].
Different power sources have to be dispatched according to demand fluctuations in order to maintain the balance between load and supply at all times. Each power source has a different cost structure and it runs under different operation conditions; the transmission system opera-tors (TSOs) and balance providers decide which power sources to include in the system at any
given time, based on several parameters, for instance: running costs, electricity demand forecast, weather conditions and reservoir capacities.
These power production costs are highly variable and thus, effective ways to charge end-users for a product that is highly variable in nature, has been debated since the beginning of the electric power industry itself. Utilities defined the optimal pricing regime for this service as Hopkinson’s differentiated rates based on time-of-day use [2] and since then, additional dynamic pricing schemes have been developed. Today, different methods include critical peak pricing (CPP), critical peak rebate (CPR), demand-based tariff and real time pricing (RTP) [3, 4, 5, 6, 7]. Lately, large penetration of intermittent renewable energy sources, such as wind and solar power, have introduced larger fluctuations on the supply side, in consequence, existing prime movers have to ramp up and down their production capacity, often operating in derated mode at low efficiency. This operation has led to increased operation costs and in general, added more complexity to the operation and control of the power system [8, 9, 10]. This has, in consequence, increased the price fluctuations in the electricity market.
In Scandinavia (Denmark, Finland, Norway and Sweden), the Nordic Power system is based on a mixture of power sources with a total installed capacity of 100 832 MW in 2013 [11]. Over half of the production capacity comes from renewable power sources, mainly hydropower. Combined Heat and Power (CHP) makes up for the second largest generation type, followed by nuclear power in Sweden and Finland. Wind power accounts for less than 10% of the total production capacity in Scandinavia, but has increased significantly over the last few years [12].
In Sweden, the installed capacity increased with 890 MW from 2011 to 2012 (2.4%); 1055 MW from new wind power stations plus the small contribution of new solar panels (24 MW) minus the loss of 170 MW in decommissioning of condensing power plants [11].
The electricity market has been deregulated since January 1 1996, meaning that both elec-tricity production and retail have been subject to competition after the reform. The wholesale price of electricity is determined by supply and demand on an hourly basis on NordPool’s spot market (Elspot) for the next 24-hour period. Due to physical transmission restrictions between countries, the Nordic electricity market is divided into bidding areas (Elspot areas) [13]. The network operation still remains as a regulated monopoly in Sweden. The distribution networks are operated by about 160 different distribution system operators and the transmission network is governed/operated by Svenska Kraftn¨at, the Swedish TSO.
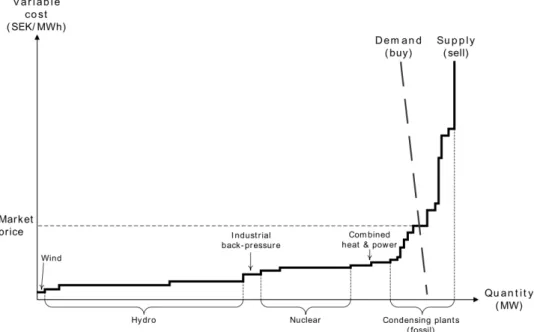
For each hour of the following day, the players in the spot market specify the amount of electricity they wish to sell or buy. All the bids are aggregated both in price and quantities and the demand curve is built from the sum of all purchase bids. The combination of price and quantities where supply and demand curves match, establish the market price as shown in Figure 1 [13].
NordPool Spot’s market share of all the electricity traded in the Nordic and Baltic area in 2014 was 501 TWh [14], the largest part of all the electricity produced and consumed in the area. In Sweden, the total electricity produced that year was 149.5 TWh, with a net export of 10 TWh, leaving a total of 139.5 TWh of electricity used in the country [15]. Almost all electricity generated and consumed in Sweden was traded through NordPool Spot.
Additionally, Sweden made a strong commitment to deploy an advanced metering infrastruc-ture and by year 2009, reaching full smart metering coverage. With this infrastrucinfrastruc-ture in place, from 1st October of 2012, new regulations for hourly metering came into force. These new regulations gave electricity customers the right to have their electricity consumption metered by the hour and established that electricity suppliers could offer variable-pricing contracts based on hourly meter readings [16].
Figure 1: Price formation in the Nordpool Spot Market
For household users in Sweden, the total electricity cost comprises the cost of electricity supply itself, electricity transmission, energy taxes and value-added tax (VAT). In 2014, in av-erage, the share of the electricity supply price made up to 33% of the users electricity bill, 24% corresponded to the network tariff and 43% to energy tax and VAT [17].
One of the main advantages for residential users of a deregulated market together with smart metering technology, is the contract flexibility and options provided by electricity retailers [18]. The number of customers that have switched electricity retail companies has been fairly constant over the past four years. In 2014, almost 1.2 million households changed electricity retailers or signed a new contract, corresponding to 24.7% of the total amount of residential users in the Swedish electricity market [17].
Residential customers in Sweden can choose from different pricing contracts from approx-imately 200 different suppliers. The most common types of contracts are the variable pricing contract, where the cost per kWh is based on NordPool Spot month’s average spot price, plus a retailer fee; fixed price contract where the user pays a predetermined electricity price agreed between the retailer and the customer and that remains fixed during the duration of the contract (1, 2 and 3 years); default contract, which is selected by the local network owner, if the cus-tomer does not make an active choice; hourly RTP, where the cost per kWh is determined by the spot market price and although it is not common, it is possible to sign for this type of con-tract with a limited number of providers (ten at the end of 2015); other concon-tracts options include demand-based pricing options and mixed rates (50% fixed, 50% variable). [17].
The overall average low-prices in the Nordpool spot market in the last years, has resulted in a great number of users shifting from fixed price contracts to variable-price ones. In December of 2014, 41.4% of Swedish domestic customers had signed variable-price contracts, about 6% more than the customer base for fixed-price contracts. The small percentage of customers still using
default contracts is rapidly declining because due to an increased awareness about the possible flexibility options and due to the high prices offered with this type of contract. Additionally, users choosing fixed-term contracts at a fixed price are moving from three-year contracts to one-and two-year contracts, showing a shift towards shorter-term commitments between users one-and their service providers [19].
Although variable-pricing electricity contracts are currently the dominating type in Sweden, most of them use monthly-average prices, based on the system’s monthly price fluctuations, instead of hourly RTP. Several authors have discussed the expectations raised by the introduction of open competition in retail markets and the new opportunities for customers to gain access to RTP contracts, at prices that match the production cost. The role of these new pricing schemes for the development of large-scale demand response programs have been studied by [20, 6, 21, 22]. Likewise, other authors claim that additional elements enabled by RTP adoption include energy storage [21], improve energy efficiency [23], facilitate the integration of renewable energy and stimulate residential load management [24].
On the contrary, Goulden et al, have strongly criticized the use of RTP for improving de-mand response, by claiming that in the RTP evaluation pilots, the analyzed customers have usu-ally joined the pilots voluntarily and therefore do not constitute a representative population. In consequence, results are often too optimistic and lead to an overestimated consumer demand flexibility [25].
Confirming the issues addressed by Goulden et al, a study carried out by Thorsnes et al, where 400 households were involved, showed that substantial variation in prices, had no effect across the participant groups, suggesting Time-of-use (TOU) tariffs to be ineffective as a demand management instrument [26]. Torriti, J., analyzed the impacts on peak demand of non-voluntarily use of TOU tariffs in 1446 households in Italy [27]. The results showed a rather low level of load-shedding and in cases where it occurred, a third peak was created in the middle of the afternoon as well as a significantly high new evening peak, indicating the failure of TOU tariffs to address peak load problems.
One of the best-known cases where RTP was applied is the Illinois Energy-Smart Pricing Plan. The plan used day-ahead pricing information sent by phone to their customers and was also available on the company’s website. Results showed a very low variation in consumers’ electricity usage profile. However, by improving the way of providing price information, con-sumers response increased by 50% [28]. Other pilots and programs have been reviewed and presented by [29], including recommendations where special emphasis is put on consumers ed-ucation and information that should be provided with pricing programs, in order to avoid the rebound effect caused by consumers increasing their consumption when shifting to times of the day when prices are lower.
Although RTP programs together with feedback information about energy usage and tips to save energy have shown promising results, a circular issue emerges: should programs for customer engagement and consumption flexibility be deployed in mass scale prior to customers shifting to RTP? Or on the contrary, should customers change their conventional contracts to RTP and then engage with customer flexibility programs to reduce electricity costs?
Additionally, there is the issue about what would happen if customers adopt RTP contracts but never engage with any customer flexibility program. Would their cost for electricity increase or decrease?
The authors did not find any long-term studies that analyze the economic impact for con-sumers adopting RTP without changing their consumption patterns (e.g. without demand-side management). This paper aims at evaluating this particular scenario, in order to establish whether
RTP contracts should be recommended for the residential sector in Sweden or not, as well as to provide valuable policy recommendations that could help improve the customer benefits from mass RTP adoption.
The paper is structured as follows: the selected consumer base together with the methods and tools used are presented in section 2. The limitations of the used method and the approximations used due to the lack of specific information are presented in 3. The economic impact on cus-tomers of using fixed price contracts vs RTP is analyzed and presented in detail in section 4 and finally, the implications of RTP adoption for both customers and utilities are discussed in section 5.
2. Methodology
In this paper, the theoretical impact on electricity bills after switching from a fixed price per kWh contract to an option where the cost of electricity per kWh is tied to the market spot price (RTP) is studied on 400 households, in a region situated 15 km north of Stockholm, in Sweden. Out of the 400 users, 200 users were connected to the district heating (DH) network and 200 used electricity to run ground-sourced heat pumps (HP) as the main source for heating.
Electricity consumption series for 7 years, between years 2001 and 2007 were obtained from the smart metering infrastructure available in the area. The annual electricity supply cost was calculated using the regular 1-year fixed price and was also calculated for RTP using Nordpool’s hourly spot price. The results were compared for each individual user for each year of study in order to establish the economic impact of adopting a RTP contract.
Electricity consumption data was provided directly from the local utility’s database. For each customer and measurement, each row in the dataset contained the meter identification (ID), time-stamp (YY:MM:DD HH:MM) and hourly electricity consumption value (in kWh). Additionally, for each user ID, information about the main energy source used for heating was also provided. There were two main users groups: the ones connected to the DH network and those that used HP as main heating source.
All the hourly data entries were formatted into MATLAB time-series for processing and any missing values were linearly interpolated. Each user’s time-series was adjusted for daylight saving time (DST) for each corresponding year and data entries were indexed using a common time-vector. This vector was formatted in a serial data format that represents, in a single number, the amount of time that has passed since 01/01/0000 to facilitate the data compilation for all customers into one single matrix.
User data was split into two main groups: users connected to the DH network and users that would use a HP as the main heating source. In order to eliminate potential multi-family buildings, the fuse size was determined by extracting the maximum historical power consump-tion. Only data for customers between 16-25A fuse-size was kept, in order to study houses with consumption characteristics within the same peak power consumption range.
The monthly electricity cost was calculated for each customer for both studied schemes; 1-year fixed electricity price contracts and RTP. Additionally to the electricity supply cost, the network charge, retailer fee, electricity tax and VAT were added and calculated monthly for every customer during the studied time-period.
Users’ energy consumption data was kept unchanged for the monthly bills calculation of both pricing schemes. In this way, it was possible to evaluate the economical impact on customers’ electricity bills if they would switch to RTP contracts but would not react to price variations in
Figure 2: Spot vs 1-Year Fixed Price between 2001-2014
the market (in other words, their electricity consumption profile would remain the same). This allowed establishing a baseline of the two contracts’ effect on electricity bills without consumers adopting any demand-side management schemes or engaging in any customer flexibility program and thus, representing a worst-case scenario condition.
2.1. Spot-Based Electricity Price
Spot-based electricity price data for RTP contracts costs’ calculation was obtained directly from NordPool’s database for Elspot’s prices of the physical market area. Hourly electricity val-ues for the 4 bidding areas in Sweden were available at 1-hour intervals for every day. Electricity price data was already DST-adjusted so no further modifications were required for the electricity costs calculation.
Electricity costs were calculated by multiplying the hourly consumption matrix and the spot-price matrix to obtain the hourly costs and store the information in a new matrix. From the hourly-costs matrix, monthly and annual electricity costs were calculated.
The hourly electricity price was the same for every customer, regardless if the customer used electric heating or if it was connected to the district heating network.
2.2. 1-year Fixed Electricity Price
Fixed electricity prices for one-year contracts for each customer group type (DH or with HP) were obtained from Statistics Sweden (SCB) [30].
The electricity prices comparison between 2001-2014 for the two types of contracts and different type of customers are shown in Figure 2.
2.3. Retailer Fee for RTP Contracts
The retailer fee for RTP contracts was obtained from the ten companies in Sweden that of-fered this service, as of march 11th, 2014. This fee was added to the calculation of the cost
Table 1: Retailer fee for RTP Contracts in March 2014
Fee Type Amount Unit
Annual Fee - DH Users 22,23 EUR/Yr
Annual Fee - HP Users 21,02 EUR/Yr
Surcharge Fee - DH Users 0,00376 EUR/kWh Surcharge Fee - HP Users 0,00324 EUR/kWh
Table 2: Fixed Part of the Network Tariff in EUR
Start Date Fuse size 16-25A
2001-01-01 110 EUR
2005-01-01 - 2008-01-01 161 EUR
per kWh for RTP contracts. Some of the retailers had different tariffs based on different annual consumption thresholds. Additionally, some retailers charged an annual connection fee. In order to apply the same conditions to all customers, a low-consumption threshold was defined for the customers connected to the DH network and a high-consumption threshold was defined for con-sumers with HPs. Both tariffs were calculated from the average price per kWh of all retailers on their respective low- and high-thresholds. Likewise, the annual fee was also added by calculating the average annual fee from all retailers. A summary of the resulting retailer fee is presented in Table 1
Since RTP contracts were not available for residential consumers during the period of the study (2000-2007), the RTP retailer fee was adjusted for each year according to the historic inflation rate for Sweden (CPI) [31].
2.4. Network cost based on Demand-charge
As mentioned in section 1, additionally to the electricity cost, customers also have to pay for the network cost and taxes. The network cost per kWh is charged to customers based on their fuse size and the overall peak demand. The fuse size for each customer was estimated from the historical peak power consumed during the 7-years period (Figure 3). To obtain its value, the maximum current, I was isolated from the equation 1 where P is expressed in Watts; V corresponds to Sweden’s three-phase residential rated voltage (400V) and an average power factor (PF) of 0.85 was used for residential electricity use.
P= √3∗ PF ∗ V ∗ I (1)
The resulting fuse size distribution for both customers group (DH and HP) is shown in 3. The demand-based network tariff was calculated for the 16A, 20A and 25A fuse size cus-tomers. The tariff is composed of two parts: a fixed and a variable (demand-based) one. The fixed part is charged annually and depends only on the fuse size as shown in Table 2.
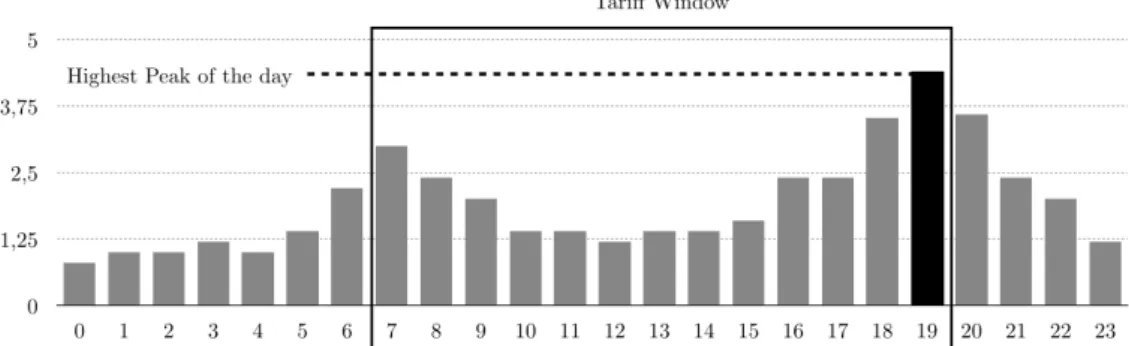
The variable part is calculated by multiplying the average of the three highest energy con-sumption peaks per day that occurred during weekdays between 07:00 and 19:00 by the demand-based tariff. This network cost was calculated for every customer for every month of the studied period using the corresponding demand-based tariff that will be explained later. An example of how the highest consumption peak of the day is extracted during the tariff window is shown in Figure 4.
Figure 3: Distribution of Fuse Sizes for both customers group
Table 3: Demand-Based tariff for network cost in EUR/kWh
Year 2001 2002 2003 2004 2005 2006 2007
Spring-Summer 2,27 2,29 2,63 2,63 2,59 2,59 2,85
Autumn-Winter 4,54 4,58 5,26 5,26 5,17 5,19 5,71
Figure 5: Electricity Tax 2000-2007
Two different demand-based tariffs for calculating the network cost are established per year, one applies to Spring and Summer seasons (from April until October) while the other applies to the Autumn and Winter seasons (from January until March, November and December). The tariffs used during the period of study are shown in Table 3.
The annual demand-based network cost needs to be calculated by adding all customers’ net-work cost and it has to be divided over the total amount of kWh consumed per year in order to obtain the network cost per kWh. This cost was the one used for calculating each individual customers monthly share of their electricity bill corresponding to the network cost.
In order to provide each customer with the required network fee per kWh, the global annual network cost is calculated and then divided by the total amount of kWh consumed by all cus-tomers during the year. This value provides the network cost per kWh, and its the same for all customers.
2.5. Electricity Tax and VAT
Electricity used in Sweden is taxable under the act (1994:1776) on the taxation of Energy. The tax rate depends on whether the customer is a private or a business customer and the loca-tion in the country. Since September 1996 the electricity tax depends on the energy consumploca-tion rather than a fixed fee. Electricity tax for the seven-year studied period (2001-2007) for residen-tial customers is shown on Figure 5 [32].
3. Research Limitations
This research work developed a methodology to analyze the economic impact on end-consumers from adopting a RTP contract for electricity. However, since these type of contract was not avail-able at the time of the study, several approximations had to be made; for instance, without any available RTP contract, it is unclear how much retailers would have included as surcharge fee for their service and therefore a cost projection had to be made based on the CPI for Sweden from the retailer service surcharge fee in 2014. Additionally, it is not clear how this surcharge fee is calculated for a RTP contract. Some retailers use a fixed price per kWh while others define different thresholds for high- and low-consumers. Likewise, some retailers charge an additional annual fee while others do not. Therefore, it was difficult to decide an objective method for defining the service retailer surcharge fee for RTP. The method developed for calculating this surcharge fee for RTP was described in detail in section 2.3, but it was difficult to define a best method for this, especially since each retailer is free from adding the surcharge fee that best suits their business model.
Another limitation of the present research work is that the methodology was developed for analyzing the worst case scenario for customers, in terms of their electricity consumption pro-file, since no changes in their electricity consumption were made. When a consumer willingly decides to change from a fixed-fee contract to an RTP one, an increase in energy consumption awareness can be expected, and some changes in their electricity consumption profile could arise, specially at the beginning of the contract, when the consumers can be more aware of the hourly price variations. Therefore, results obtained in this paper provide a pessimistic scenario from RTP adoption in the residential sector in order to determine if RTP could still be beneficial for consumers under the worst conditions.
4. Results and Discussion
For every year of the seven-year studied period, the total annual electricity consumption for each customer was plotted against the calculated electricity costs for the two types of contracts analysed: 1-year fixed price contract vs RTP contract. Then, for each month, the monthly cost for a RTP contract was subtracted from the monthly cost for a 1-year fixed price contract.
As a result, if a RTP contract would cost less than a 1-year fixed price one during a specific month, the obtained plot will show a positive value, while on the contrary, if it would cost more, it would show a negative value.
The resulting plots for the 7-year period (84 months) are shown in Figure 6 for users con-nected to the DH network and in Figure 7 for users with HP, together with the monthly average temperature.
While the figures follow the same trend, customers with HP experienced larger fluctuations, both on the positive side of the figure (more economical for RTP price) and on the negative one (more economical for 1-year fixed price). One particular period worth looking into more detail was the Winter of 2002-2003 (months 23-25 in Figures 6 and 7) where the lowest temperatures were registered and the highest cost for RTP contracts was obtained.
During this particular Winter, the electricity market experienced the most turbulent behaviour of the seven-year studied period. The system price reached 113 Euro/MWh on January 6th, 2003 [33]. Several authors have analysed this particular season and consequently, have expressed the risks of short-term volatility in electricity prices [34, 35, 36]. This resulted in better procedures
Figure 6: Monthly cost difference between pricing contracts 2001-2007 for customers with District Heating
from NordPool and increased capacity in the system [37]. In consequence, these high fluctuations were not experienced during the rest of the studied period.
The Winters of 2000-2001, 2001-2002 and 2005-2006 (months 1-3, 12 and 63 respectively, in Figures 6 and 7) also experienced high electricity prices but not as high as the Winter of 2002-2003. The end result was only a slightly higher cost for RTP contracts.
While prices are more likely to increase during Winter months, in the Summer of 2006 (months 67-69) high electricity prices were experienced due to the heat wave that shocked Eu-rope [38, 39] combined with a particularly dry year, that severely affected the water reservoirs of Sweden’s hydropower stations. This was the only Summer season of the studied period when electricity spot-based prices were higher than the ones for 1-year fixed price contracts.
4.1. Electricity Time of Use (TOU)
Since RTP contracts are based on hourly electricity prices supplied by Nordpool’s electricity market, it was important to determine the peak consumption time from the customers as well as to determine the times of the day when electricity was more expensive in order to evaluate the users’ electricity demand impact on RTP contracts.
For this, a histogram for the time of the day (TOD) where the daily highest electricity peak consumptions took place, was obtained for each year, in order to extract the times of the day that would have the strongest effect on electricity costs for RTP contracts.
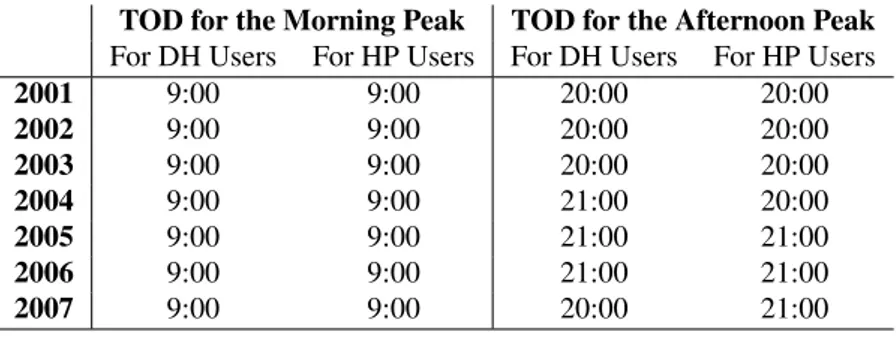
When analyzing electricity consumption profiles for both users group, it was found that the morning consumption patterns were similar, peaking at 9:00 am every year of the studied period. For the afternoon peak, the peak hour differed between user groups and between different years. For users connected to the district-heating network, the afternoon peak took place at 20:00 for four out of seven years (57%) of the study, while it occurred at 21:00 for the remaining three
Figure 7: Monthly cost difference between pricing contracts 2001-2007 for customers with Heat Pumps
years (43%), however, electricity consumption was very similar during those two hours. The result was the same for users with heat pumps, although the peak hour time differed between years, when compared to the other users group. Complete results are shown in Table 4.
For the electricity market’s spot price, five out of the seven years of study (72%), it experi-enced the highest price of the day at 9:00 am, one year (14%) at noon and one year (14%) at 18:00. However, when analysing the annual average hourly price per day, for four years (57%), the highest average price was reached at noon, for two years (28.5%) at 09:00 and one year (14.5%) at 11:00.
These results suggest that the strongest impact on electricity costs was caused by the morn-ing consumption peak, since it occurred at 9:00 am, where electricity price incidence was more frequently the highest of the day. The afternoon consumption peak had less impact on the
elec-Table 4: Electricity consumption peak times
TOD for the Morning Peak TOD for the Afternoon Peak For DH Users For HP Users For DH Users For HP Users
2001 9:00 9:00 20:00 20:00 2002 9:00 9:00 20:00 20:00 2003 9:00 9:00 20:00 20:00 2004 9:00 9:00 21:00 20:00 2005 9:00 9:00 21:00 21:00 2006 9:00 9:00 21:00 21:00 2007 9:00 9:00 20:00 21:00
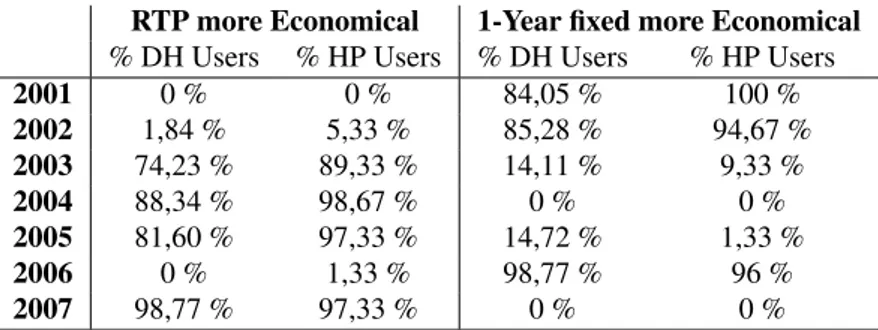
Table 5: Summary of the customer share that would benefit from RTP contract adoption
RTP more Economical 1-Year fixed more Economical
% DH Users % HP Users % DH Users % HP Users
2001 0 % 0 % 84,05 % 100 % 2002 1,84 % 5,33 % 85,28 % 94,67 % 2003 74,23 % 89,33 % 14,11 % 9,33 % 2004 88,34 % 98,67 % 0 % 0 % 2005 81,60 % 97,33 % 14,72 % 1,33 % 2006 0 % 1,33 % 98,77 % 96 % 2007 98,77 % 97,33 % 0 % 0 %
tricity cost since it occurred between 20:00 and 21:00, when the electricity price was low, thus, providing with reduced impact on the overall monthly costs.
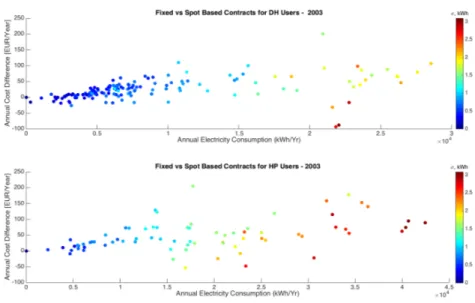
4.2. Annual Analysis
Utilities and third-party companies in Sweden have designed several websites dedicated to provide customers with an estimate of the annual costs for electricity, based on their location and annual electricity usage. This estimate is often carried out using electricity prices from 1-year to 3-year fixed contracts, where the electricity TOU is not relevant and therefore not very useful for customers interested in switching to RTP contracts.
In order to study the electricity TOU impact on an yearly basis, annual costs difference be-tween the two pricing schemes were plotted against the annual consumption for each customer. The resulting plot showed a significant variation for every customer each year.
In the following figures, the y-axis represents the annual cost difference between the two pricing schemes as follows:
y= Fixed − RT P (2)
The number of customers for which either type of contract was more economical, was cal-culated and presented in Table 5. In the left column, the percentage of users where RTP contract was more economical is presented, while the users where one-year fixed price was more econom-ical is presented in the right column. Users with zero-energy usage or where the price difference between contracts was zero, were subtracted from the group, and therefore, are not presented in the table.
In Figures 8 to 14, the x-axis represents the annual energy consumption in kWh while the colorbar on the right of the plot shows the annual energy standard deviation,σ on a scale from the lowest (dark blue) to the highest (dark red), expressed in kWh. σ is calculated using the hourly consumption values for each individual customer for each year. This allows determining how spread the hourly electricity consumption values are, for instance, consumers with low-consumption peaks exhibit a low value, while consumers with high low-consumption peaks exhibit a high one. Althoughσ alone does not specify at what time the peaks take place, it allows classifying customers, based on their consumption variability.
In 2001, RTP was generally higher than the one for 1-year fixed price contracts (months 1-12 in Figure 2) and therefore most customers (84,05% for DH customers and 100% for customers with HP) experienced higher costs when the RTP electricity contract was used to calculate their
Figure 8: Customers’ annual electricity costs for Spot Price vs 1-year fixed prices for year 2001
annual costs at the end of the year (Figure 8). Due to the high prices on the system, fixed price for 1-year contracts increased by about 50 % for year 2002. On the RTP side, the electricity market experienced its largest peak in the Winter of 2002-2003, due to the low Summer rainfall and unusually low temperatures [36]. However, as a result, despite the increase in price for 1-year fixed price contracts, most customers (85,28% DH customers and 94,67% of customers with HP) still experienced higher annual costs with RTP, although, the difference was lower than in year 2001.
The standard deviation calculation for 2001, showed that customers with low-variability were in the low-annual consumption side (left side of Figure 8), and experienced the lower price difference between contracts. Although there was a small dispersion in 2001, users with the same annual consumption and different variability experienced significant annual costs differences for HP users on the high-annual consumption range (between 3-3,5x10⁴kWh/yr).
Year 2002 showed a highly dispersed annual costs difference between customers within each group as shown in Figure 9, specially on the high annual usage side. In this figure, two important issues can be observed; first, the strong RTP price fluctuations caused high price differences dispersion among customers with the same annual energy usage; second, customers with low energy consumption variability (lowσ) experienced a lower cost difference between contract types.
The Winter of 2002-2003 had a long-term effect on 1-year fixed price contracts and its price increased by 50% and remained considerably high, compared with the RTP market (months 30 - 60 in Figure 2). The result for years 2003-2005 was that annual electricity costs were lower when the RTP contract was applied to the customers’ electricity consumption. Only 14,11% of the customers connected to the DH network, and 9,33% of users with HP, experienced lower annual costs using the 1-year fixed electricity price contract in year 2003. Annual results are shown in figure 10.
Figure 9: Customers’ annual electricity costs for Spot Price vs 1-year fixed prices for year 2002
Figure 11: Customers’ annual electricity costs for Spot Price vs 1-year fixed prices for year 2004
Furthermore, year 2003 presented higher annual changes between customers (Figure 9) pri-marily due to the price fluctuations during the months of January - March. The highest costs difference between customers that used the same annual amount of energy, was experienced by DH customers that used above 20000 kWh/year (up to 260 EUR/year) and 25000 kWh/year for users with heat pumps (up to 250 EUR/year).
For the next two years, spot-prices remained more stable, without high fluctuations and sig-nificantly lower cost for RTP contracts versus 1-year fixed price contracts. The end result was lower annual costs difference between customers and a more beneficial situation for customers with RTP. The largest difference in 2004 was 428 EUR/year in the DH customers group and 737 EUR/year in the HP one, in favour of RTP contracts. A linear relationship between annual energy consumption and annual costs difference was obtained between the two types of contracts and it is shown in Figure 11. This relationship responds to the low price fluctuations that were obtained during the year, even during Winter time. In consequence, the annual cost of RTP contracts was more dependant on the energy usage (total kWh) than time of use (TOU). This trend continued in 2005 and a similar profile was obtained, but with a smaller annual costs difference as shown in Figure 12.
During the heat wave of 2006 (months 66-69 in Figure 2), spot-prices were higher than usual and therefore impacted on the annual costs for most RTP customers, mainly those connected to the district heating network. 98,66 % of DH users experienced higher annual costs and 96% of the customers with HP, perceived higher annual electricity costs using the RTP contract. Results for this period are shown in Figure 13. Similarly to 2003 (Figure 10), a high dispersion was perceived around 1,5x10⁴kWh/year for DH-users and 2,5x10⁴kWh/year, with annual costs differences of
up to 150 EUR/year for HP users with similar annual energy usage.
Finally, during 2007, the largest price difference between the RTP contract and the 1-year fixed prices contract was obtained (months 72-84 in Figure 2), reaching the highest annual costs
Figure 12: Customers’ annual electricity costs for Spot Price vs 1-year fixed prices for year 2005
Figure 14: Customers’ annual electricity costs for Spot Price vs 1-year fixed prices for year 2007
difference between the two pricing schemes, being RTP the most economical option for both customer groups. The largest difference was 734 EUR/year on the DH users group and 798 EUR/year for the HP users group. The annual costs difference during 2007 is shown in Figure 14.
4.3. 7-year period analysis
Overall, during the seven-years period, the monthly analysis in Figure 15 shows a more predominant cost difference above zero, meaning that RTP contracts were more economical throughout the studied period for both customers groups. There were two noticeable excep-tions, the Winter of 2002-2003 (months 23-25) and the Summer of 2006 (Months 66-69). In all the other Winter periods the annual cost difference was considerably above zero and just in two cases it was below (Winter of 2001 and 2006).
A correlation analysis was performed, in order to determine the linear relationship between the cost difference with the customers’ consumption variability (σ) and the annual energy usage. Results are shown in figure 18. Here, years with high differences between the 1-year fixed price contract cost and RTP resulted in a high correlation coefficient between the cost difference and annual usage, for instance, years 2001, 2004, 2005 and 2007. Years with high price variability resulted in a lower correlation coefficient between the cost difference between contracts and the annual energy usage, for instance, years 2002, 2003 and 2006 experienced this behaviour. The correlation coefficient with consumers profile variability (σ) was found to be generally lower than the correlation with annual energy usage, but they both followed the same general trend. Likewise, a positive correlation coefficient resulted in positive average cost in favour of RTP, while a negative correlation coefficient resulted in 1-year fixed contract to be more favorable for the users in both groups, however, when the correlation coefficient was positive, the cost difference was considerably higher, in favour of RTP.
Figure 15: Average monthly price difference between pricing contracts 2001-2007
Overall, after the seven-year study period, for most consumers in both users groups it was more economic to adopt a RTP contract instead of a 1-year fixed one. Although the end result looks scattered in Figure 16, the average savings for DH users was 162,3 EUR and 569 EUR for HP users, both in favour of RTP. A maximum of 1551 EUR in savings was obtained in the HP users group and 1066 EUR in the DH one. There were only two users (2,6%) in the HP group and seventeen (10,4%) in the DH group, for which the RTP contract turned out to be more expensive. The largest price difference in favour of the 1-year fixed price contract was 84 EUR in the HP group and 458 EUR in the DH group.
5. Conclusions
The 1996 electric market deregulation in Sweden has brought new opportunities for retailer and customers to gain access to more flexible commercial agreements between them. A mature smart metering infrastructure provides with reliable hourly electricity readings that allow users to pay an electricity price that is close to the production costs at the time it is produced.
While several authors have studied the potential for customers to take advantage of this new pricing schemes and use more electricity when it is cheaper and reduce consumption when the price increases; in reality, there are only a few large-scale pilots and their results are mixed, some of them in favour of RTP, some of them against. It has also been stated that RTP adoption should go in hand with consumer engagement for flexible demand (e.g. demand response) programs and/or to provide pricing information and electricity consumption in real time. While this last approach has shown the most promising results for reducing electricity bills costs for residential customers, it would require mass deployments of energy-usage awareness programs that do not guarantee that customers will shift to RTP contracts after.
This leads to the main issue addressed in this paper: should customers increase their energy usage awareness prior to adopting RTP contracts or first shift to RTP and then engage with consumer flexibility programs? More importantly, would it make sense to shift to RTP contracts
Figure 16: Total cost difference between pricing contracts 2001-2007 for DH
Figure 18: Correlation between cost difference with σ and annual energy usage
without increasing energy consumption awareness to help users change consumption demand patterns?
This paper aimed at addressing the problem between RTP adoption and customers’ ability to change their electricity usage profile according to price fluctuations. The conventional approach has always proposed that customers must be aware about their consumption habits and the fluc-tuating nature of electricity pricing before adopting RTP in order to obtain economic benefits. However, the authors did not find concrete studies about what would happen if customers are un-able to change their consumption patterns after switching to RTP contracts, and if there would be any corresponding economic benefits. An uninformed guess would suggest that it would depend on each particular customer, and therefore, no general statement in favor or against RTP could be done unless each individual user’s consumption profile is analyzed.
In order to provide an objective way to address this issue, this paper studied the economical impact on customers from adopting a RTP electricity contract versus the more common 1-year fixed price ones without changing their electricity consumption profiles, in order to simulate a worst-case scenario for a large group of consumers. To achieve this, the historical electricity us-age for a seven-years period for 400 users in central Sweden was used to calculate their monthly bills utilizing these two types of pricing contracts.
It was found out that despite spikes in electricity prices due to restricted production capacity on the Swedish electrical system and high energy demand during Winter time, including the crit-ical price fluctuations of the Winter of 2002-2003, most users experienced economcrit-ical benefits during the full period when using a RTP contract. These results suggest that customers in Swe-den could shift to RTP contracts and still obtain economic benefits even without changing their electricity usage patterns.
A reason for these economical benefits is that while low capacity in the electrical system and extreme climatic conditions have a negative impact on spot electricity prices, this impact
would only last for as long as these extreme conditions exist, electricity prices would go back to normal once these conditions have passed. Fixed price contracts, on the other hand, react to these changes differently: since the price has to remain fixed for customers for as long as their contract is valid, the cost for electricity remains fixed, regardless of the fluctuations on the spot-price electricity market. The change in price comes afterwards, for the next contract period, when adjustments are made based on weather forecasts and energy reserves estimations.
During the studied period, the price increase for 1-year fixed price contracts was significantly higher than the annual average spot-price of the next period after a spot-market price spike was experienced during the previous year. This resulted in less expensive annual electricity in the long run for customers with a RTP contract, despite temporary fluctuations in the spot market.
This, however, might not be so straightforward for customers; in 2013, the share of elec-tricity customers that had chosen variable-price contracts in Sweden (not necessarily RTP, but monthly average spot-price) was larger than the share of 1-year fixed price contract customers. This responded to the low system prices experienced between 2011-2014 (see Figure 2) and in consequence, the price difference per kWh between a 1-year fixed price contract and a RTP one. What would happen to this new variable-price contract users if there is a dry Summer in 2015 and a cold Winter in 2015-2016 that could cause high price spot-price spikes in Sweden? Would consumers switch back to one-year fixed-price contracts? While this could be a possibility, the results presented in this paper suggest that customers need to understand that fixed-price contracts will adjust their price after fluctuations in the spot-market and will remain like that for at least one year, while the electricity price with RTP contracts will eventually go down after a price-spike event, having lower prices in the long run.
These findings could contribute to an increased share of electricity customers adopting RTP and help the ones already with variable-price contracts to maintain them, even after spot-price market fluctuations. Moreover, with a large share of customers with RTP contracts, it would be easier to deploy large-scale electricity usage awareness programs aiming at helping customers understand the impact of their activities on electricity cost, based on their time-of-the-day usage pattern in order to obtain larger economic benefits.
Giving the efforts that Sweden has put in adopting smart-metering technology and the fact that since the end of 2012 it has been possible for electricity customers to choose from different variable pricing contracts (including RTP), new regulations could be targeted at mass adoption of these new type of electricity contracts by making variable pricing contracts (including RTP), the default contract type, leaving fixed-price as optional for customers who want to remain with these contract types.
This strategy could offer customers with better economic benefits even if they choose not to change their consumption habits, however, it gives the possibility of additional economic savings by adopting demand flexibility programs that, in the long run, offer additional benefits for load balancing and better grid performance with high penetration of non-dispatchable renewable energy sources.
Furthermore, a high RTP customer share, can enable large adoption of technology-based solutions designed at taking advantage of electricity price fluctuations. For example, customers with heat pumps or any other type of electric-based heating system, can adopt smart temperature controllers that react to price signals, so that the operation of the heating system reacts to price fluctuations in the spot market and thus reduces operation costs while maintaining adequate indoor conditions. In this study, HP users, experienced the larger benefits from the use of RTP, therefore, adopting these technology-based solutions would help increase economic savings even further.
Nevertheless, mass adoption of RTP contracts could affect retailers negatively by reducing their profit margins from selling electricity. However, this opens up new opportunities for re-tailers competition on value-added services for customers that take advantage of RTP contracts. For instance, installing in-home-displays (IHD) that provide users with electricity consumption and market price information could help customers make informed decisions about their energy usage. Other services can include the development of innovative phone apps for smart-energy control, such as automated appliances operation, home automation and smart lighting, among others.
Finally, mass RTP adoption can also enable further smart grid technologies adoption at the residential level, for instance, energy storage technologies combined with solar PV adoption can increase, due to the associated benefits of storing energy during low-price hours and using it during peak hours. Similarly, it can also help boost the adoption of electric vehicles, since users could implement charging control schemes where the vehicle’s battery is only charged when the electricity price is low (e.g. overnight), and thus reduce its recharging cost.
Acknowledgments
The authors are grateful to the Swedish Energy Agency for the financial support under re-search grant 33707-1.
References
[1] R. Loisel, Power system flexibility with electricity storage technologies: A technical-economic assessment of a large-scale storage facility, International Journal of Electrical Power & Energy Systems 42 (1) (2012) 542–552. doi:10.1016/j.ijepes.2012.04.058.
[2] J. L. Hausman, W. J.,Neufeld, Time-of-Day Pricing in the U.S. Electric Power Industry at the Turn of the Century, International Library Of Critical Writings In Economics (2006) 235–245.
[3] F. Wallin, C. Bartusch, E. Thorin, T. Bdckstrom, E. Dahlquist, The Use of Automatic Meter Readings for a Demand-Based Tariff, in: 2005 IEEE/PES Transmission & Distribution Conference & Exposition: Asia and Pacific, IEEE, 2005, pp. 1–6. doi:10.1109/TDC.2005.1547125.
[4] S. Borenstein, M. Jaske, A. Rosenfeld, Dynamic pricing, advanced metering, and demand response in electricity markets, Center for the Study of Energy Markets.
[5] S. Gyamfi, S. Krumdieck, Price, environment and security: Exploring multi-modal motivation in voluntary resi-dential peak demand response, Energy Policy 39 (5) (2011) 2993–3004. doi:10.1016/j.enpol.2011.03.012. [6] P. Faria, Z. Vale, Demand response in electrical energy supply: An optimal real time pricing approach, Energy
36 (8) (2011) 5374–5384. doi:10.1016/j.energy.2011.06.049.
[7] NordREG, NordREG report on the price peaks in the Nordic wholesale market during winter 2009-2010, Tech. rep., Nordic Energy Regulators (2011).
[8] E. Heydarian-Forushani, M. Moghaddam, M. Sheikh-El-Eslami, M. Shafie-khah, J. Catal˜ao, A stochastic frame-work for the grid integration of wind power using flexible load approach, Energy Conversion and Management 88 (2014) 985–998. doi:10.1016/j.enconman.2014.09.048.
[9] G. M. Shafiullah, A. M.t. Oo, a. B. M. Shawkat Ali, P. Wolfs, Potential challenges of integrating large-scale wind energy into the power grid-A review, Renewable and Sustainable Energy Reviews 20 (2013) 306–321. doi:10.1016/j.rser.2012.11.057.
[10] K. Schaber, F. Steinke, P. M¨uhlich, T. Hamacher, Parametric study of variable renewable energy integra-tion in Europe: Advantages and costs of transmission grid extensions, Energy Policy 42 (2012) 498–508. doi:10.1016/j.enpol.2011.12.016.
[11] N. E. Regulators, NordREG’s Market Report 2013: Development in the Nordic Electricity Market, Tech. rep., Nordic Energy Regulators (2013).
[12] NordREG, Nordic Market report 2011. Development in the Nordic Electricity Market, Tech. rep., Nordic Energy Regulators (2011).
[13] Energimyndigheten, Price Formation and Competition in the Swedish Electricity Market, Tech. rep., Swedish Energy Agency (2006).
[14] NordPool Spot, Europe’s Leading Power Markets, Tech. rep., Nordpool Spot, Oslo, Norway (2015).
[15] Energy Markets Inspectorate, The Swedish electricity and natural gas markets 2013, Tech. rep., Energy Markets Inspectorate, Eskilstuna, Sweden (2013).
[16] N. E. Regulators, The Swedish electricity and natural gas markets 2012, Tech. rep., NordREG (2012).
[17] Energy Markets Inspectorate, The Swedish electricity and natural gas markets 2014, Tech. rep., Energy Markets Inspectorate, Eskilstuna, Sweden (2014).
[18] I. Vassileva, J. Campillo, Consumers Perspective on Full-Scale Adoption of Smart Meters: A Case Study in V¨asterås, Sweden, Resources 5 (1) (2016) 3. doi:10.3390/resources5010003.
URL http://www.mdpi.com/2079-9276/5/1/3
[19] T. Broberg, L. Persson, An electricity market in transition Is consumer flexibility for sale, or even for real?, Tech. rep., Umea University (2015).
[20] H. Chao, An Economic Framework of Demand Response in Restructured Electricity Markets, Harvard Electricity Policy Group (2009) 1–48.
[21] K. Kok, B. Roossien, P. MacDougall, O. van Pruissen, G. Venekamp, R. Kamphuis, J. Laarakkers, C. Warmer, Dynamic pricing by scalable energy management systems - Field experiences and simulation results using Power-Matcher, 2012 IEEE Power and Energy Society General Meetingdoi:10.1109/PESGM.2012.6345058.
[22] I. Valencia-Salazar, C. ´Alvarez, G. Escriv´a-Escriv´a, M. Alc´azar-Ortega, Simulation of demand side participa-tion in Spanish short term electricity markets, Energy Conversion and Management 52 (7) (2011) 2705–2711. doi:10.1016/j.enconman.2011.02.005.
[23] S. Kiliccote, M. A. Piette, D. S. Watson, G. Hughes, Dynamic Controls for Energy Efficiency and Demand Re-sponse : Framework Concepts and a New Construction Study Case in New York, in: 2006 ACEEE Summer Study on Energy Efficiency in Buildings, 2006, p. 13.
[24] G. Bellarmine, Load management techniques, Southeastcon 2000. Proceedings of the IEEE.
[25] M. Goulden, B. Bedwell, S. Rennick-Egglestone, T. Rodden, A. Spence, Smart grids, smart users? the role of the user in demand side management, Energy Research and Social Science 2 (2014) 21–29. doi:10.1016/j.erss.2014.04.008.
[26] P. Thorsnes, J. Williams, R. Lawson, Consumer responses to time varying prices for electricity, Energy Policy 49 (2012) 552–561. doi:10.1016/j.enpol.2012.06.062.
[27] J. Torriti, Price-based demand side management: Assessing the impacts of time-of-use tariffs on residential electric-ity demand and peak shifting in Northern Italy, Energy 44 (1) (2012) 576–583. doi:10.1016/j.energy.2012.05.043. [28] S. J. Darby, E. McKenna, Social implications of residential demand response in cool temperate climates, Energy
Policy 49 (2012) 759–769. doi:10.1016/j.enpol.2012.07.026.
[29] J. Stromback, C. Dromacque, M. H. Yassin, G. Energy, T. Tank, The potential of smart meter enabled programs to increase energy and systems efficiency: a mass pilot comparison Short name: Empower Demand, Tech. rep., VaasaETT, Global Energy Think Tank (2011).
[30] Statistics Sweden, Prices on electricity for different kind of consumers and agreements, time serie (2013). URL http://www.scb.se
[31] Triami Media BV - inflation.eu, Historic Inflation Sweden - CPI Inflation (2015).
URL www.inflation.eu/inflation-rates/sweden/historic-inflation/cpi-inflation-sweden.aspx [32] Svensk Energi, Electricity tax history 1954 - 2014, Tech. rep., Svensk Energi (2014).
[33] NordPool Spot, Annual review 2003, Tech. rep., NordPool Spot, Oslo, Norway (2003).
[34] J. Campillo, F. Wallin, I. Vassileva, E. Dahlquist, Electricity demand impact from increased use of ground sourced heat pumps, in: 2012 3rd IEEE PES Innovative Smart Grid Technologies Europe (ISGT Europe), IEEE, 2012, pp. 1–7. doi:10.1109/ISGTEurope.2012.6465876.
[35] R. Weron, I. Simonsen, P. Wilman, Modeling highly volatile and seasonal markets: evidence from the Nord Pool electricity market, The application of econophysics.
[36] J. Lucia, H. i. Enguix, Short-Term Electricity Future Prices: Evidence on the Time-Varying Risk Premium, IVIE Working Paper WP-EC 2008.
URL http://dialnet.unirioja.es/servlet/articulo?codigo=2602554&orden=158619&info=link [37] M. Pettersson, Z. A., Northern light - the Nordic power market, International Water Power & Dam Construction. [38] R. Twardosz, U. Kossowska-Cezak, Exceptionally hot summers in Central and Eastern Europe (19512010),
Theo-retical and Applied Climatology 112 (3-4) (2012) 617–628. doi:10.1007/s00704-012-0757-0.
[39] M. Rebetez, O. Dupont, M. Giroud, An analysis of the July 2006 heatwave extent in Europe compared to the record year of 2003, Theoretical and Applied Climatology 95 (1-2) (2008) 1–7. doi:10.1007/s00704-007-0370-9.