KTH Chemical Engineering and Technology
JENEBERANG RIVER BASIN
MANAGEMENT CAPACITY
Establishing of a Public Corporate in South Sulawesi Provincein INDONESIA: Assessment and Stakeholders’ Participation
P A N D U S W . A G E N G
PANDU SW. AGENG
Master of Science Thesis
STOCKHOLM 2005
JENEBERANG RIVER BASIN MANAGEMENT CAPACITY
E
STABLISHING OF AP
UBLICC
ORPORATE INS
OUTHS
ULAWESIP
ROVINCE ININDONESIA:
A
SSESSMENT ANDS
TAKEHOLDERS’
P
ARTICIPATIONPRESENTED AT
TRITA-KET-IM 2005:24 ISSN 1402-7615
Industrial Ecology,
Disasters have spread throughout the land and sea, because of what the people have committed.
He thus lets them taste the consequences of some of their works,
that they may return (to the right works). Al-Furqan, 30 : 41
For my loving parents,
Maria and Soenarto
"When planning for one year, there's nothing better than planting grain,
When planning for ten years, there's nothing better than planting trees,
When planning for a lifetime, there's nothing better than planting men".
Acknowledgement
Firstly, I would like to thank to my supervisor, adjunct, Larsgöran Strandberg for his valuable guidance and precious advice during work. I also wish to express my special gratitude to director of studies, Nils Brandt, for input on the research methodology.
My sincere gratitude goes to all people that provided me with important information, valuable explanation and helpful discussion during the fieldwork in Jakarta and Makassar, Indonesia: Bambang Hargono and Subandi from Proyek Induk (Jeneberang River Basin Development Project); Toshio Katayama, Agnes (JICA-CTI); Rina Agustin, the Ministry of Settlement and Regional Infrastructure (KIMPRASWIL); Makassar Major Mr. HB. Amiruddin Maula and Ridwan Syahputra Musagani, Benny Chatib, Sukmayeni and Abdul Gani from the Indonesian Water Supply Association (PERPAMSI); and helpful discussion during the fieldwork in Makassar, Indonesia: Alimuddin Wellang, A.R Kasinong, Renan J. Indra, for giving highly motivation and spirit to become a student in “golden ages”. Also thanks to Gunyamin M. and Kartia B. and staff of the RD Department-Litbang and Production Dept. - PDAM Kota Makassar for information of water quality and valuable explanations. Thanks to the first batch of class mates 2004-2005 for sharing memorable moments in Stockholm during our 9 months course. I am also grateful to Zainuddin Mansur’s family, Errawan Partakusumah and Masyarakat Muslim Indonesia-Stockholm for all their support.
Finally, I debt gratitude to my parents Maria and Soenarto, and my wife Arum with all my sons Panji, Citra and Sukma, their support, help and understanding during my absence,
My Creator, for His unlimited gifts and blessings… Pandu SW. Ageng
Stockholm, 18 November 2005
Abbreviations and Acronyms
ADB Asian Development Bank
BAPEKIN Investment and Construction Development Agency BAPPENAS National Development Planning Agency
BAPPEDA Regional Development Planning Agency BAPEDAL Environment Impact Management Agency BAPEDALDA Provincial Environment Agency CBO Community-Based Organization DEPDAGRI Ministry of Home Affairs
DGWR Directorate General Water Resources DPRD Regional House of Representative
FORKAMI Indonesia Drinking Water Communication Forum GoI Government of Indonesia
INFID International NGO Forum on Indonesian Development INMENDAGRI Instruction of the Ministry of Home Affair
IWRM Integrated Water Resources Management JBIC Japan Bank for International Cooperation JICA Japan International Cooperation Agency KEPMENDAGRI Decree of Minister of Home Affairs KEPMENKES Decree of the Minister of Health KEPPRES Presidential Decree
KIMPRASWIL Ministry of Settlement and Regional Infrastructure MENDAGRI Ministry of Home Affair
NGO Non Governmental Organization OBA Output Based Aid
PAD Local Government Income/Revenues PDAM Municipal Water Authority
PEMDA Provincial or Regional Government PERDA Provincial Regulation
PERMENDAGRI Regulation of the Minister of Home Affairs PERMENKES Regulation of the Ministry of Health PERPAMSI Indonesia Water Supply Association PJP Long Term Development Plan
PJT Perum Jasa Tirta, Public Water Service Corporation PP Government Regulation
UFW Unaccounted for Water
UU Law
WALHI Indonesian Forum for Environment/Friends of Earth Indonesia WATSAL Water Resources Structural Adjustment Loan
Abstract
A multi purpose dam called Bili bili have been built in Jeneberang river basin in eastern Indonesia in 1999 and providing water available to all customers. In 2004 a landslide occurred and impact to the quality of raw water, especially the amount of turbidity, dramatically increased. Landslide problems started with high sedimentation rates to water infrastructures. Technically the lifetime of Bili bili multi purpose dam and reservoirs will be shorter than planned. In contrast, we understand and agreed that sustainable development and ensuring the current use of a water resource as well as a dam should compromise its use by future generation. To reach progress in sustainability we need to establish governance structures and practices that can foster, guide and coordinated positive work by a host of actors on a complex of issues. Today, Indonesian Central Government is planning to establish a public corporate participation to comprehensive water resources management in eastern Indonesia. The important significant of stakeholders in order to develop comprehensive approaches, are water agencies: regional and local water institution that will manage catchments areas, water infrastructures and water utilities as provider of drinking water to municipalities. They will be acquainted to the water and water institutional capacity problems.
This research examines both the current impacts on and potential future for water management in eastern Indonesia. One of the objectives of this research will be to described the current of water resource organization, which is related to establishing of a public corporate, not only stakeholders involvement; management and organization; but also finances and investments; operation; distribution; regulation and policy. One objective of this research will be measured by conducting interactive interviews and dialogue with the representatives of the stakeholders. The last objective is evaluating the Human Resources Development performances of water resources management by a series of workshops. Additionally, some recommendations for a future water supply system will be provided as an input for the government and local authority in order to improve the capacity and water resources management in eastern Indonesia.
The results conclude that to meet the Millennium Development Goals, the establishment of a public corporate for supporting Indonesia’s process of decentralization is necessary where the local level include customers can be a much more dynamic interaction between providers of services and water users. A participatory method is useful to raise problems, so while the Central Government can mandate a minimum service standard and the achievements of these standards can be monitored directly at the local level.
Accountability of water resources development should be considered as a vehicle when a problem occurs with insufficiency of the existing water facilities and a big demand of water purposes.
Keywords: capacity, decentralization, human resources, Indonesia, Jeneberang, landslide, participatory, public corporate, river basin, turbidity and water resources management.
JENEBERANG RIVER BASIN MANAGEMENT CAPACITY
Establishing of a Public Corporate in South Sulawesi Province in INDONESIA:
Assessment and Stakeholders’ Participation
CHAPTER 1: INTRODUCTION……….1
1.1 Water Resources Management in Indonesia………..………2
1.2 History of Water Management in Eastern Indonesia………..………...3
1.3 Landslide Problems...………..………...…….……….4
CHAPTER 2: METHODS………6
2.1 Data Collection….……….6
2.2 Data Analysis……….………...8
2.3 Data Limitations…….………...8
CHAPTER 3: PRESENT CONDITIONS OF RIVER BASIN MANAGEMENT…………10
3.1 Water Resources Agencies.………..……...11
3.1.1 Central Government Agencies...………..…...11
3.1.2 Regional and Provincial Government Agencies...……….…….12
3.1.3 Foreign Funded Development Projects………...………...13
3.2 Present Condition of Water Supply Sector……….…………...………..13
3.2.1 Large Dependence on Non Treated Water Sources: Service Area Problems...14
3.2.2 Existing Water Supply System………...14
3.2.3 Taxes Paid by Water Authorities to the Central and Local Government………...15
3.2.4 General Tendency of Water Consumption………...15
3.2.5 Operation and Maintenance of Water Supply Production Facilities…………...15
3.2.6 Environment Law and Environmental Impact Assessment (EIA)………...17
CHAPTER 4: HUMAN RESOURCES DEVELOPMENT REVIEW IN WATER UTILITIES………20
4.1 Capacity Building………20
4.2 Capacity of Irrigated Farmers………..21
4.3 Millennium Development Goals (MDG)………21
4.4 Human Development Index and Indicators ………23
4.5 Nature of Water………23
4.6 Water Utility as Urban Infrastructure…….……….24
4.7 Human Resources Development in Water Utilities ………25
4.8 Rate of Salary as Enforcements………...25
4.9 Human Resources in River Basin Management: Solving the Problems………..26
4.10 Human Resources in Makassar and Gowa Water Authorities………...28
CHAPTER 5: FINDINGS AND RESULTS OF THE INTERVIEW……….30
5.1 Introduction………..30
5.4 Results of Project Cycle Management (PCM) ………31
5.5 Results of Sub-projects Groups PDM (Project Design Matrix) ………..35
5.6 Raw Water Tariff in Public Corporate……….35
5.7 Institutional and Legal Framework………..37
5.8 Water Problems………39
5.9 Operation & Maintenance (O&M) Problems………..42
5.10 Turbidity………44
5.11 Water Regulations………..45
5.12 Privatization or a Public Corporate? ……….47
5.13 Financial Issues………..48
5.14 Financial Aid for Poor people………50
CHAPTER 6: STAKEHOLDERS PRECEPTIONS AND ARISING PROBLEMS……….51
6.1 Central and Local Government Problems………51
6.2 Makassar Water Authority (PDAM) Becoming a Big Customer………52
6.3 Gowa Water Authority (PDAM) ………53
6.4 Non Governmental Organizations (NGOs) ………53
6.5 Indonesian Water Supply Association (PERPAMSI) ………54
CHAPTER 7: FINDINGS AND RESULTS OF THE CUSTOMER QUESTIONAIRES....54
7.1 General Overview of the Customers………54
7.2 Questionnaire Responding………...59
CHAPTER 8: DISCUSSIONS AND ANALYSIS……….61
8.1 Existing Public Corporate in West and East Java Island……….61
8.2 Policy, Legislations and Regulations………...61
8.3 Effective Local Water Governance………..62
8.4 Water Utilities in Regional Areas………62
8.5 Jatiluhur Public Corporate as a Facilitator: Solving problems………63
8.6 Set-up a Water Tariff………...63
8.7 Analysis of the Core Problem of Human Resources………...64
8.8 Perception and Expectation of Customers………..65
CHAPTER 9: CONCLUSIONS AND RECOMMENDATIONS………...67
9.1 CONCLUSIONS ………67
9.2 RECOMMENDATIONS ………68
REFERENCES ……….69
List of Table
Table 2.1: Actual Numbers of Consumers and Number of Respondents………8
Table 3.1: Existing Water Treatment Plan Makassar and Gowa Authorities………14
Table 3.2: Area Coverage, Number of households Served and Annual production In 2000……16
Table 4.1: Indonesian results of water coverage for the Millennium Development Goals……...22
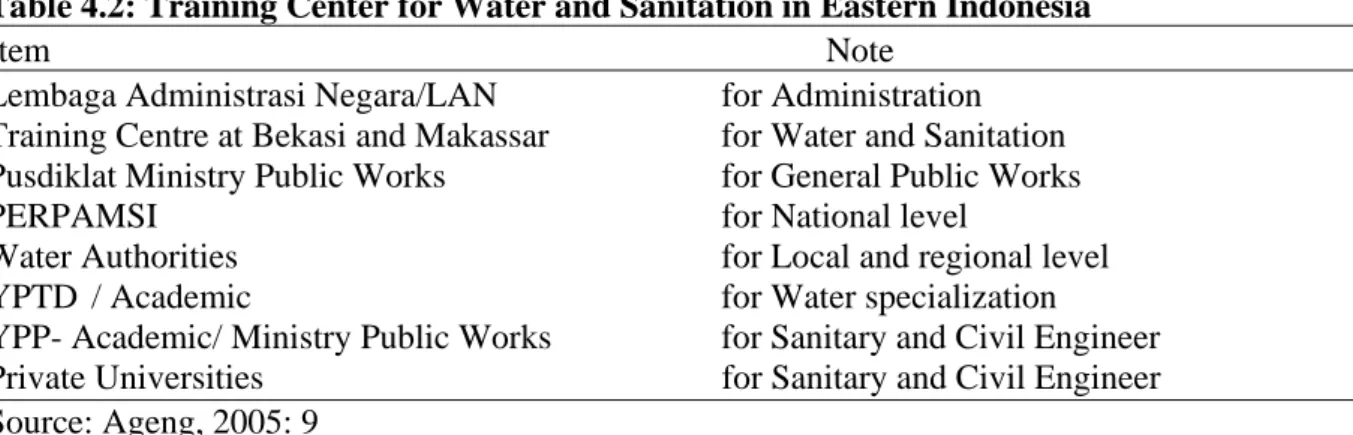
Table 4.2: Training Center for Water and Sanitation in Eastern Indonesia………...25
Table 4.3:Regional Government agencies responsible for manage water resources in South Sulawesi-Eastern Indonesia………..27
Table 4.4: Human Resources of Gowa Water Authority………...29
Table 5.1: Project Cycle Management (PCM) workshops for Analysis Stage………..31
Table 5.2: Results 1 of General Issues………...32
Table 5.3: Results 2 of General Issues………...32
Table 5.4: Results 3 of General Issues………...32
Table 5.5: Result of Operation and Maintenance Issues………33
Table 5.6: Result of Human Resources Issues………...33
Table 5.7: Result of Financial Management………..33
Table 5.8: Result of Institutional and Legal Issues………34
Table 5.9: Stakeholders Participants List………..36
Table 5.10: Six Results of PDM (Project Design Matrix)………….………37
Table 5.11: Principal Local Autonomy Changes………...40
Table 5.12: Actual Investment of Major Water Resources ………..49
Table 6.1: Distribution of Human Resources available for Water Resources Sector….………...52
Table 7.1: Descriptions of Customers Groups………...57
Table 7.2: Major Issues in Drinking Water Provision………...60
List of Figures Fig. 1.1: Map of Indonesian Archipelago..……….……….2
Fig. 2.1: Map of District Bontoala at Makassar City………..………7
Fig. 3.1: Bili bili multi purpose dam and Irrigation Schemes………11
Fig. 3.2: Water users at Jeneberang River……….16
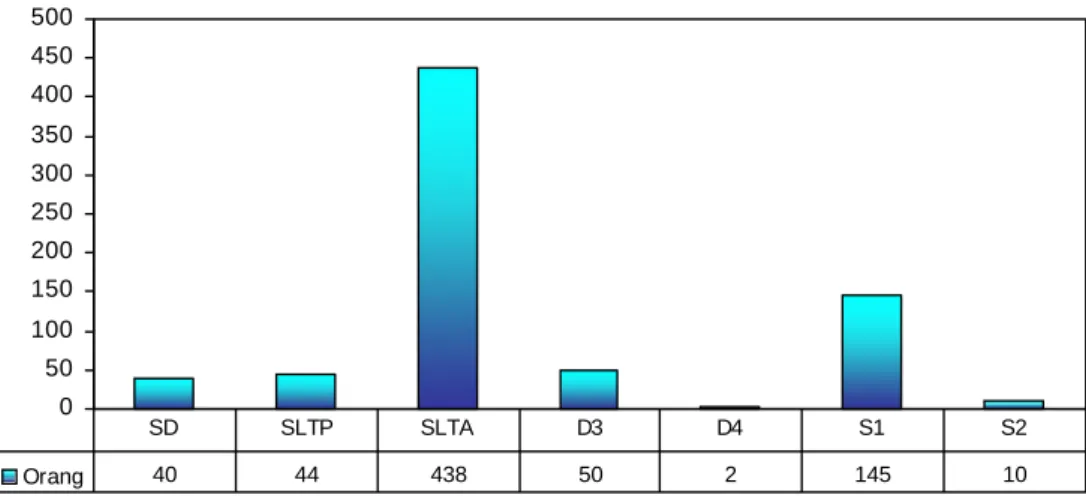
Fig. 4.1: Distribution of Education at Makassar Water Authority………28
Fig. 5.1: Integrated Water Management at Basin Level………40
Fig. 5.2: Correlation on Turbidity with concentration Alum and volume sludge during 2001 - 2002 at Somba Opu WTP………46
Fig. 5.3: Turbidity Result on January 2003 to December 2004………46
Fig. 6.1: Human Resources for River Basin………..53
Fig. 7.1: Distribution of Sex………..56
Fig. 7.2: Distribution of Water Tariff………56
Fig. 7.3: Distribution of Income………56
Fig. 7.4: Perception with the water services….………….……….………...57
Fig. 7.5: Distribution of Customers Income………..58
Fig. 7.6: Problems in Makassar Water Authority………..58
Fig. 7.7: Customer Problem with Turbidity………...58
Fig. 7.8: Customer Problem with Water Quality…….………...58
Fig. 7.9: Customer Problem with Color………...58
Fig. 7.11: Customers Perceptions with Public Corporate………..59
Fig. 7.12: Additional Sources of Drinking Water………..59
Fig. 7.13: Improvements in Water Services Provision during the Last Five Years………...60
List of Appendixes Appendix A: Drinking Water and Clean Water Standard………..77
Appendix B: Interviews and Meetings………...78
Ap5ndix C: Questionnaires and Results………79
Appendix C1: Questionnaires for Customers………79
Appendix C2: Questionnaires for Government……….80
Appendix C3: Results and Feedback from customers………...81
Appendix D: Institutional Framework of River Basin Management……….82
Appendix D1: Institutional Framework for River Basin Management……….82
Appendix D2: Short Review of River Basin Management in Indonesia………...83
Appendix D3: Indonesia Brantas River Basin Authority………..84
Appendix D4: Indonesian Jatiluhur River Basin Authority………..86
Appendix D5: Water Infrastructures Supports………..87
Appendix D6: Regulation Concerning River Basin Management in Indonesia………88
Appendix D7: The Development of a Collaborative Master Degree………90
Appendix D8: Pictures………...91
Appendix D9: Turbidity in Makassar Water Authority 2003 – 2004………93
Appendix E: Human Resources Analysis and Results……….94
Appendix E1: Overall Problem in Human Resources: Skilled Staff is Lacking………...94
Appendix E2: Causes-Effect Chart of Human Resource Development………95
Appendix E3: Project Design Matrix……….97
CHAPTER 1: INTRODUCTION
A multi purpose dam called Bili bili have been built in Jeneberang river basin in eastern Indonesia in 1999 providing water available to all customers. A landslide occurred in 2004 and impacts to the quality of raw water, especially the amount of turbidity, dramatically decreased. In 2004 one of data shows that the amount of raw water turbidity reached 11.600 nephelometric turbidity units (NTU). The Makassar water authority decided to stop both the supply of raw water and activities of their water treatment plant (Kompas, January 2005). During wet season the accumulative high rates of sedimentation due to excessive erosion occurred in the upstream of the Jeneberang watershed. Landslide problems started with high sedimentation rates to water infrastructures. The consequences of the water shortage will cause serious problems leading to local political instability and social unrest (Pasaribu, 2005). Technically the lifetime of Bili bili multi purpose dam and reservoirs will be shorter than planned. In contrast, we understand and agreed that sustainable development and ensuring the current use of a water resource, as well as a dam should compromise its use by future generation (WCED, 1987).
O’conor (in Michell, 2005) observed that source protection of water is the major barrier. He noted that typical approaches include watershed protection plans and he also recommended that the provincial government needed to develop a comprehensive approach to all aspect of drinking water, from source protection to the return of treated wastewater to the environment. Authority should educate the public to appreciate water scarcity; in particular accepting re-cycled treated water as a new source of water. To turn the principles of sustainable development into achievable policies and political will of interest groups, solutions must be based on fundamentally sound hydrology and technology (Sophocleous, 1998).
To reach progress in sustainability we need to establish governance structures and practices that can foster, guide and coordinated positive work by a host of actors on a complex of issues, through webs of interconnection and across multiple and diverse strengths, motives and capabilities, not only conventional government agencies and business interest, but also the full set of public, private, civil society players, collective and individual. The challenge is to achieve sufficient integration of understanding, direction and action to achieve the desired transition (Kemp, 2005). Today water resources management policies should be designed in order to correct the institutional failures present and manifest themselves in fragmented, conflicting and uncoordinated management of the various aspects of water resources (OECD, 1989).
Today, Indonesian Central Government is planning to establish a Public Corporate participation to comprehensive water resources management in eastern Indonesia. The important significant stakeholders in order to develop comprehensive approaches are water agencies: regional and local water institution that will manage catchments areas, water infrastructures and water utilities as provider for drinking water to municipalities. They will be acquainted to the water and water institutional capacity problems.
In this research I will examine both the current impacts and potential future for water management in eastern Indonesia. One of the objectives of this research will be to describe the current of water resource organization, which is related to establishing a Public Corporate, not only stakeholders involvement; management and organization; but also finances and investments; operation; distribution; regulation and policy.
Important perceptions and expectations of different stakeholders, as one objective of this research will be measured by conducting interactive interviews and dialogue with the representatives of the stakeholders. The method used is in accordance to some open-ended questions by conducting residential customer surveys using a standardized questionnaire. The last objective is evaluating the Human Resources Development performances of water resources management by a series of workshops. Additionally, some recommendations for a future water supply system will be provided as an input for the government and local authority in order to improve the capacity and water resources management in eastern Indonesia.
1.1 Water Resources Management in Indonesia
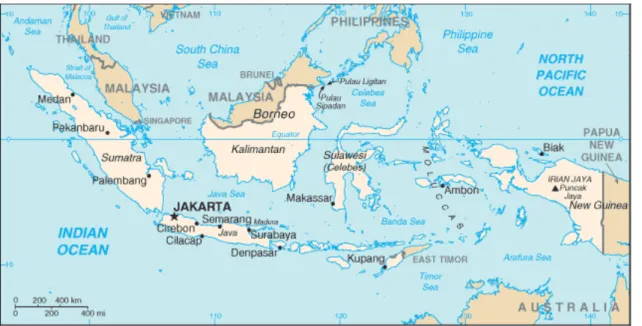
Indonesia is an archipelago nation consisting of five main islands and some 30 small archipelagos with 17.508 islands. The total area of Indonesia is estimated to be 5.193.250 km2 and the sea territory is 3.166.163 km2. Indonesia’s equatorial climate and weather is characterized by two seasons, the dry and rainy season. The monsoon type climate changes approximately every six months, where the dry season is from June to September and the rainy season from December to March (National Information Agency, 2002). Although in recent years weather patterns have been somewhat disrupted.
Fig. 1.1: Map of Indonesian Archipelago
Indonesia is given with rainfall and has approximately 6 percent of the world’s fresh water resources equivalent to 2.500 km3 of annual renewable water resources. However, 60 percent of the rainfalls become run-off water due to inappropriate drainage systems (Shofiani, 2003). It is estimated that 60 percent of Indonesia’s piped water supplies are derived from surface water sources, 25 percent from springs and only 15 percent from ground water (Lanti, 1996).
The internal renewable water resources are provided by surface water from 5.500 rivers. Ground water resources are limited and are mostly used for domestic, municipal and industrial purposes (Indonesia Water Supply Sector Policy Framework, 1997). The population of Indonesia in 2004 reached up to 215 million people with the rate of growth of 1.4 percent during 1999-2000 and the population of South Sulawesi Province 7.96 million people and 1.13 million are stay in Makassar (National Information Agency, 2002). At the end of 1994, only 36 percent of Indonesia’s urban population of 67 million had access to piped water. Aiming to serve 62 percent at the end of 2008 may appear ambitious. It would however just reduce the un-served population from the 1994 level of 43 million to 40 million (Shofiani, 2003).
Makassar has known two types of seasons, wet and dry season. Dry season started during September – April and rain season during May – October. The amount of rainfall ranges between 2.500 mm to 3.500 mm (Montgomery, 2000). Water resources available at Makassar Municipality / Makassar water utility are supplied from Salo Maros, Jeneberang River and Salo Bantimurung. The biggest river is Jeneberang which flows to inlet and outlet of Bili-bili multipurpose dam (Montgomery, 2000).
1.2 History of Water Management in Eastern Indonesia
Traditional practices of water resources development in Indonesia have been regarded by the ancient generation of Indonesians as highly important. This have been supported by the strong evidence for agricultural and water utilizations. In fact, a number of experiences in traditional irrigated farming in Indonesia among others, Subak in Bali, Keujreun Blang in Aceh Special Province, Tua Banda in West Sumatra, Raja Bondar in Northern Sumatra, Mitra Cai in West Java, Dharma Tirto in Central Java, Tudang Sipulung in South Sulawesi, Mantri Siring in South Sumatra, Ili-ili in Lampung have concluded that the traditional practices and the supply of water resources development in the past have been sustainable, and also with application of environmentally friendly technologies (Ambler, 1991).
The most important Indonesian historic intrinsic feature is the home garden and its ability to withstand the natural forces of soil erosion. Several interacting factors are important. The almost closed canopy provides some protection, at least from intense rainfall and because the majority of the plants are less than a meter high, the raindrops falling through the canopy hit the soil surface at a rate considerably below their terminal velocity. The most important factor in preventing erosion is the protective layer of litter. Most home gardens have a heavy litter layer. The important of the tree canopy and the undergrowth lay not so much in their direct effect on erosion but in their capacity to provide continual replenishment of the litter. Nevertheless, erosion is probably somewhat higher than in the natural forest ecosystem. The home garden will be a viable alternative to mono-cropped field agriculture. It also is a highly valuable source of genetic diversity (Soemarwoto and Conway, 1992).
Institutions for Water Resources Development and Management (WRDM) in Indonesia originate from the Dutch colonial period and were established in 1945 within the Ministry of Public Works and Electric Power. There have been several changes in the WRDM organizations; the expansion has been gradual with change of policy as well as goals of the successive Master Plans. During the first 25 years of development, spanning across five Master Plans (PJPT-I, the first long term development plan, 1969-1993), policies was directed with the primary emphasis on the agricultural sector. During the next phase which begun in 1994 (PJPT-II, implementation; 1999 – 2020 is the second long term development plan), more emphasis are given to the conservation and preservation of the resources with optimisation of the utilisation of water. This is a step towards sustainable development and management of water resources. The intention is to adapt an ecosystem-based approach within river basins for sustainable water resources management in the whole country (Gunatilaka, 2004).
The history of water management in eastern Indonesia began in the 1970s, mostly in an attempt to replicate the experiences of water management in West of Indonesia started on water management to the local farmer irrigation. Rice is very importance for Indonesian diet. Subject to water availability for irrigation, paddy is cultivated in both wet and dry land as support to rice food stock area as well as main food for most inhabitants in Indonesia (Pasaribu, 2005).
The Government of the Republic of Indonesia intends to extend the existing River Basin Management (RBM) program of the Brantas River to other river systems, as well as Jeneberang River basin. Under WRDM in the Brantas basin there is a well establish institutional framework for functioning of RBM as well as an organized water resources management infrastructure (Sunaryo, 2000). Since the early 1990s, a real-time water quantity monitoring network and a Flood Forecasting and Warning System (FFWS) are operating in the Brantas basin. In Central Java, this extension concerns the development of an effective RBM organisation, establishment of WRDM infrastructures, the implementation of a monitoring network as well as water quality and water quantity as basic requirements. At the first stage, a basic RBM program is planned for the implementation in Jratunseluna and Garang-Bodri River Basin complex in Central Java (Gunatilaka, 2004).
1.3 Landslide Problems
In 2004 a gigantic landslide occurred (called “longsor” in Indonesia language) in Mt. Bawakaraeng and changed the raw water quality input to Bili bili multipurpose dam drastically. The quality of raw water decreased to low quality and resulting to extreme of turbidity, reaches an amount of 219 000 nephelometric turbidity unit (NTU). Also a water treatment plant had difficulties during operation and maintenance. In 2001, Somba Opu water treatment plant produced the best quality, especially indicated in turbidity 5 NTU (CTI, 2001).
One of the national news, Kompas (2004) reported that there were several factors caused by the landslide: unrecorded earthquake, water level, erosion and change of physicality. Also the local news, Fajar reported that the landslide have been reached a volume erosion of sediment at volume 300 million m3. All upstream are covered with deposition of sludge and covering across 1 to 3 km in width, 30 km in length and 40 to 200 m in height. The impact of the landslide is not
finished but it started to begin. The un-stabilized soil materials of landslides were changing in physicallity by rain intensity level and this condition gradually influenced the water quality input of Bili bili multi purpose dam.
The Japanese Erosion Journal (2004) reported that a gigantic landslide occurred on the Caldera wall of Mt. Bawakaraeng (2 874 m), located in the uppermost reach of the Jeneberang River in South Sulawesi, Indonesia, on March 26, 2004. The huge mass of debris yielded from the gigantic landslide of Mt Bawakaraeng traveled about 7 km down the upper reach of the Jeneberang River with 500 m to 800 m in width. Ten persons were killed and 22 others were unaccounted for in the accident. Twelve houses and one school were crushed or buried in the debris, and the damage was expected to run a cost of 2.214 million Rupiah or $US 221.400. The volume of the slide mass caused by the gigantic landslide estimated at about 240 million cubic meters with a head width of 1.600 m, at height to 700 m to 800 m, and a thick of approximately 200 m. The debris deposit of volume 272 million cubic meters on the upper reach of Jeneberang River, and 160 million cubic meters deposited within the Caldera. The main cause of the landslide occurrence has still been unidentified. It was a 782 mm of cumulative rainfall during March 1 to 26 before the landslide, and any earthquakes were not recorded around the day of occurrence, March 26. During three months after the day of occurrence the rainfall gauge recorded a cumulative rainfall at 430 mm. However, there has been generated the V-shaped or U-shaped valley deepening with the size of 50m to 150m in width, 30m to 80m in depth because of these materials easily being eroded. The eroded sediment volume up to now is estimated to 14 million cubic meters by the site investigation. In next rainy season, there could be a great possibility of strong erosion and huge sediment transportation with debris flows. Researchers have recommended the implementation of urgent structural counter measures, such as excavation of riverbed, rising and construction of silt collection (Sabo) facilities, and non-structural counter measures, and for example the early warning system with also establishing of hazard map (Satoshi, 2005).
Fajar Local Newspaper (April 2004) informed that Gowa government of the Regency valued the loss material as a result of the landslides in the Bawakaraeng Mountain to 22 billion Rupiah or $US 2.200.000 The value of losses have covered 270 hectares of people's plantation, equivalent to 10.08 billion Rupiah or $US 1.008.000. The Regency leader assessed, the disaster losses such as 800 livestock, 12 house units, one primary school, 160 hectares rice cultivations and crop, 270 hectares of the plantations, 300.000 tree seeds, the village road along 3.000 meter, and a Mosque (Kompas, 2004).
The implications of the landslides have been influenced on the river basin by forming several small tributaries across new formation of land. Additionally the existing of water level is changed by landslides and it will be influence to the formation of land. The intensity of rain will be influenced to the quality of water in the river basin. Water crisis awareness is expanding, but most interest remains focused on water quantity issues (Lundvist, 1998).
CHAPTER: 2 METHODS
2.1 Data CollectionIn order to achieve the objectives, this research has relied on a combination of analyses and consultations / interviews. It is based on an inductive methodology to analyze the current situation by making observations and generalize the observations to develop the result. The implemented activities are as follows:
1. Collection of policies, regulations, reports, journals, literature, and other important documents. 2. Electronic interviews with representatives of different groups of Makassar and Gowa stakeholders, which were dependent by the Bili bili multi purpose dam during the period of May–June 2005, with a view towards ascertaining and comparing both their overall opinions on Public Corporate / private sector involvement and their specific opinions on issues risen during the course of the analysis. The qualitative research method was based on pre-structured, but necessarily un-standardized format of questionnaires with majority of open-ended questions. The questionnaires were adopted from Suleiman (2002), Shofiani (2003) and adjusted to the local and current situation.
3. Consumer surveys by addressing a standardized questionnaire of certain and definite questions adopted from Suleiman (Ibid) and adjusted to the local and current situation. Feedbacks of consumer questionnaire were collected during the period of May - June 2005. Respondents covered the part of Costumer Makassar and Gowa. Table 2.1 shows the total number of stakeholders representatives (respondents). Total of 10 people representing institutions were interviewed and classified into 3 groups. Interviews to the respondents are conducted to 80 samples of drinking water consumers in the Bontoala district.
Electronic interviews were conducted with various stakeholder groups, i.e. local government, water authorities, NGOs and associations. Interviews with the consumers were limited to addressing a standardized questionnaire. The interviews were seeking information related to new regulation and policy. Furthermore the interviews were also intended to examine the perceptions of each stakeholders group of Public Corporate / private sector involvement.
The study areas in the Bontoala district are serving 10.049 customers of 1.160.011 inhabitants of Makassar Municipality. Bontoala covers three service areas of zones: 12, 17 and 24 (Fig. 2.1) at the Central of Makassar City. Bontoala has an operation unit office serving those zones. The functions of this office as a customers care, services centre and payment points. The number of units varies, depending on the zone area and number of customers.
To conduct surveys according to Ferber (1980) include a method of gathering information from a number of individuals, as a sample, in order to learn something about the larger population from which the sample is drawn.
Referring to May (1997), probability or random samples are considered suitable for this survey due to its capacity to allow a statistical generalization from sample of population. However the
number of samples (customers) will be determined based on stratified random sample, where the existing number of households connected to the water supply system will be classified according to their characteristics, such as income, area, gender, type of housing, etc.
Fig. 2.1: Map of Location of District Bontoala at Makassar City
Source: Info PDAM Kota Makassar, June 2004: 19
Bell (1999) mentions that a consumer survey intends to obtain information which can be analyzed, patterns extracted and comparisons made. A sample should be taken from representative selection of the population and from that samples, the researcher will then be able to present the findings as being representative of the population as a whole. Great care was taken in this study to ensure that the sample of population is truly representative. Therefore, it is important to consider the characteristics of the total population to be represented (Shofiani, 2003).
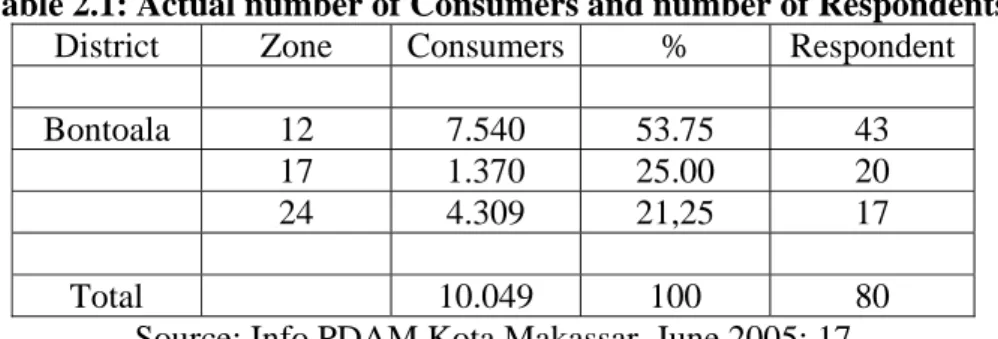
The significant characteristics used were the proportion of respondents. It was based on a number of consumers, tariff category of consumer’s group and the ratio of men and women observed. Table 2.1 shows the characteristics for selection of the representative respondents. The numbers of respondents observed were adjusted based on the ratio of consumers in the different unit office to the total number of consumers. Respondents were also stratified to the actual ratio of consumers according to tariff category. In the case consumers subscribed for piped water supply; they are categorized into different tariff groups. According to Statistics Makassar (2002), the sex ratio between male and female in Makassar is considered. Therefore the sex ratio of respondents is closely equal.
Table 2.1: Actual number of Consumers and number of Respondents District Zone Consumers % Respondent Bontoala 12 7.540 53.75 43
17 1.370 25.00 20
24 4.309 21,25 17
Total 10.049 100 80
Source: Info PDAM Kota Makassar, June 2005: 17 2.2 Data Analysis
Data analysis is the process of arranging a series of data, organizing it in a model, pattern and category so that the main themes of the interrelation of those themes and its implications can be discovered. Data that have been analyzed in this research are documentary evidences, interviews and questionnaires feedbacks.
The analysis of documentary evidences are used to supplement information obtained from interviews and questionnaires. Bell (1999) mentions that the analyses of the documents could be divided into external and internal criticism. External criticism aims to discover whether a document is both genuine and authentic. Internal criticism aims at analyzing the content of a document, including the analysis of the purpose of publishing the document, which produced the document, the circumstances when it was produced, and also particular political affiliation that might possibly influence the emphasis of the document.
Responses to verbal questions during interviews were written in separate sheets based on the types of issues. This will allow all items to be scanned in order to see whether there are any recurring themes (Bell, 1999). Raw data taken from interviews and questionnaires need to be recorded, analyzed and interpreted. A summary sheet in the form of a table is important to picture the trends of information gathered from the questionnaire feedback. Then, those sets of data can be analyzed quantitatively and qualitatively (Hasan, 2002). A quantitative analysis aims to present the result in figures and tables. Aqualitative analysis will give some interpretation and description to the figures. Finally, a descriptive analysis is done to see the generalization of data based on the objectives of the study in order to conclude findings.
2.3 Data Limitations
Usually, the most significant data limitation of a research like this will be such as defensive attitude and limited information. Reluctance to provide relevant data has limited the information that was supposed to be collected. However, this has been handled by collecting supporting data from related institutions such as Ministry Public Works (Former Kimpraswil), PERPAMSI (Indonesian Association of Water Authorities) and Makassar Water Authorities (PDAM), regarding the water quality performance. The result of selected management problem was conducted by Project Cycle Management (PCM) workshop, which was reported by the Japan International Cooperation Agency (JICA). There is also some possibility that the interviewees responded based on their personal perceptions. Collecting supporting materials published by related institutions covered those limitations.
My personal inexperience in statistical calculation and analysis is another limitation in this research. However, the intention of consumers’ survey is to investigate the actual level of service from the consumers’ point of view. Their responses on the questionnaire are solely based on their own perceptions and expectations on the service delivery. My personal approach of addressing the respondent during the interviews makes it possible to extract the very basic problems on the water service according to the consumers’ experiences.
Comparison of the surveyed information with the annual survey carried out by Makassar Water Authorities (PDAM) and PERPAMSI in previous years has been considered as a means to validate the data. Other means in validating the data is the triangulation method through reconfirmation of the consumers’ problem with the representative of local customers association / YLKI.
CHAPTER 3: PRESENT CONDITIONS
OF RIVER BASIN MANAGEMENT
The main river basin in South Sulawesi Province is Jeneberang River with a catchment area covering 760 km2, originates from Mount Lompobatang (el. 2.874 m) running and pouring into Makassar Strait. Administratively it is divided into three part boundaries of basins, such as Gowa Regency 96.3 %, Takalar Regency 2.1 % and Makassar City 1.6 %. Jeneberang river basin is under tropical climate with high and constant air temperature. The total amount of annual rainfall based on the gauging at Kampili rainfall station is estimated at 2.730 mm (87 %) in a rainy season and 360 mm (13 %) in a dry season. Water pollution of human activities can be assessed by biochemical index such as high concentration of BOD (Biological Oxygen Demand), COD (Chemical Oxygen Demand) and SS (Suspended Solid) (JICA, 2004).
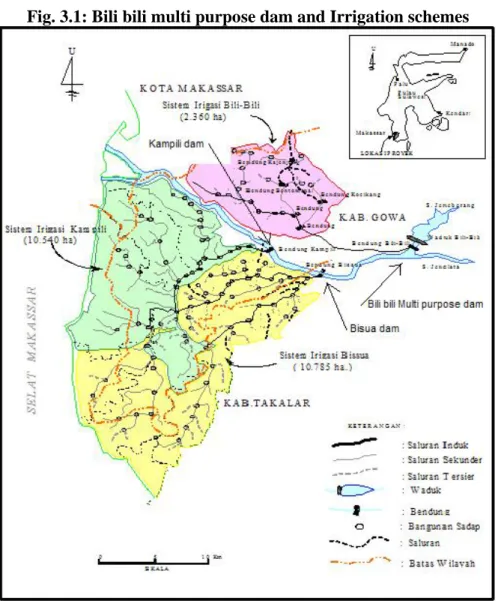
In order to reach the Millennium Development Goals (MDG), Government of Indonesia (GoI) set up a transformation of organizations from centralization to decentralization. Through decentralization policy both authorities and responsibilities for water resources management have been transferred from Central Government to Provincial-Regencies and Municipalities. In the new framework of irrigation management the irrigation assets and staffs have been transferred to Local Government. The irrigation reform under the new issuance of Water Resources Law No. 7/2004 is a replacement of Irrigation Law No 11/1974 that water resources are totally controlled by the minister in charge of the Central Government (Pasaribu, 2005). The history records of regulation listed is based on legal and institution frameworks (Appendix D1 and D6) and connected with four main areas of legislation of water resources management in Indonesia: a) relating to control of water resources b) dealing with regional administration c) dealing with funding and taxation and d) dealing with the public corporation (JICA, 2004). Jeneberang River Basin administratively is divided into several areas including Gowa area that occupies a substantial part of the river basin and the whole catchments of Bili bili multi purpose dam. White area in the up-right side of map below shows a location of Bili bili multi purpose dam. Each color is indicating each irrigation scheme: yellow, pink and green are indicating the boundary of Bissua scheme 10.785 ha, Kampili scheme 10.540 ha and 2.360 ha at Bili bili Irrigation scheme (Fig. 3.1). Currently, Jeneberang River Basin is operated and maintained by Jeneberang River Basin Development Project (JRBDP). JRBDP are working under Central Government of Indonesia.
In order to increase the national policy and economic development, a number of attempts have been made by the GoI (Government of Indonesia) since 1970s. The political commodities in Indonesia are rice productions. Interestingly, the GoI agreed for a foreign investment-JBIC (Japan Bank for
International Cooperation) of 935 billion Rupiah or equivalent to $US 93.5 million, including water
Fig. 3.1: Bili bili multi purpose dam and Irrigation schemes
Source: JICA, 2004: 7-35.
3.1 Water Resources Agencies
There are three types of organizations concerning water resources: Central, Regional and Provincial government agencies, and foreign funded projects. In order to get better understanding what they have done, I will describe the water resources agencies in relation to the Jeneberang river basin management.
3.1.1 Central Government Agencies
The Central Government has seven agencies supporting each river basin management in Indonesia. Institution with major support to river basin management is Directorate General of Water Resources (DGWR), acting and reporting to the Ministry of Public Works (former Ministry of Human Settlement and Regional Infrastructure or Kimpraswil). They are responsible for and supporting the Regional Governments through various Directorate General, such as
control of irrigation service fees under the Ministry of Home Affair (MHA). The Ministry of Agriculture (MOA) is responsible of watershed and soil management in un-forested areas and supporting services to farmers using irrigation. The regional office of watershed management is reporting to Directorate General Land Rehabilitation and Social Forestry Affairs in Ministry of Forestry and Plantations (MFP). Ministry of Stated-Owned Enterprises (MSOE-BUMN), originally part of the Ministry of Finance, is responsible for all matters concerning the establishment, operation, performance and funding. Ministry of Finance (MOF) is managing the classification and evaluation program for tax of land and property (PBB/Pajak Bumi dan Bangunan), which is redistributed to the Regional Government and can be used for operation and maintenance of irrigation funding.
Coordination Team / Tim Koordinasi, re-established under presidential decree No 123/2001, should be provided on the top-level coordination of policies and strategies in water sector. This interim arrangement has evolved into National Water Resources Council of Ministers who is responsible for various aspects of Water Resources Management (WRM). This is a central agency related to policy formulation, guidelines, development, dissemination, regulation, and control and setting standards. Some agencies are supervising and supporting the farmers. Other agencies have the responsibility and acting to collect taxes.
3.1.2 Regional and Provincial Government Agencies Here we can identify eight different agencies:
(I) The Technical Implementing Unit (TIU) called Balai PSDA, who is responsible to the Provincial Water Resources Management Service (Dinas PSDA).
(II) The Coordination Committee for Water Resources at Provincial level or Panitia Tata Pengaturan Air-PTPA.
(III) The Committee for River Basin Water Resources Management (Panitia Tata Pengaturan Air-PTPA) which acts at Jeneberang river basin level.
(IV) Kabupaten / Kota level, The Kabupaten or Kota (Water Resources Service)
(V) The Water User or farmer level, responsible for operation and management of
tertiary irrigation system, P3A (Water User Association) and higher level farmers. (VI) The Basin level management agencies either Provincial Technical Implementation
Units (TIUs) or (Unit Pelaksana Teknik Dinas-UPTD).
(VII) The BAPPEDA (Regional Development Planning Agency) is responsible of planning and development and
(VIII) The BAPEDALDA (Provincial Environmental Agency) is responsible for controlling and managing of general environments. Both of the last two agencies are responsible to the Governor of South Sulawesi Province.
Both the Central and Regional agencies have the same task but in less scale than the provincial level, such as policy formulation, administration, development, dissemination and management of technical implementation, regulation and control. Some agencies acting as supervising and procurement agencies, in order to establish the new institutional structures and financing system, and serving as more effective platform in sustainable water governance that requires efficient, effective and sustainable water management for the prosperity.
Several agencies are conducted of monthly water quality monitoring system in all rivers including Jeneberang River: BAPPEDALDA (Provincial Environmental Agency), Dinas PSDA (Provincial Water Resources Management Service), and JRBDP. The location at Bili-bili Power generator is conducted by State Power Authority-PLN and the locations monitoring of Makassar and Gowa water authorities are located at their own water treatment plant (JICA, 2004).
The commitments to the water management with good governance (government, ministers, agencies and authorities) are necessary also as well as stronger budget allocation. Support and commitments from civil society, business leaders and opinion makers are needed. Based on economic analysis reviewed both by SIWI and WHO in relation to water development and management, showed that water resources management and feasible investments in hydraulic infrastructure such as dams, irrigation schemes and flood control works can be established (SIWI, 2004).
3.1.3 Foreign Funded Development Projects
Foreign funded development projects in relation to River Basins are known as Proyek Induk (Proyek Induk Pengembangan Wilayah Sungai Jeneberang-PIPWS Jeneberang) or JRBDP / Jeneberang River Basin Development Project. They have published several studies: 2 Master Plans for river basin development completed in 2002, 5 Feasibility Studies for smaller dams completed in 2001 and detail design of 120 embung (small reservoirs). They planned and built water construction facilities: 48 small reservoir (called embung), a multi purpose dam completed in 1999, a rubber dam at Jeneberang river completed in 1997, a longstorage dam completed in 1993, a regional pond and a set of Pampang major drainage channel completed in 2001, major drainage channel of Kota Makassar completed in 1993, 4 sabo dams and 4 sand pockets (sabo/sand pocket are water construction for catch silt and sand) completed in 2001, raw water transmission main (RWTM) supplied from Bili bili multi purpose dam to Somba Opu water treatment plant, a Flood Control Infrastructure completed in 1993, and environment improvement around Bili bili multi purpose dam such as green belt and arboretum (JICA, 2004).
3.2 Present Condition of Water Supply Sector
2 of every 10 people on earth are lacking access to safe water supply, and 4 of 10 people are lacking access to basic sanitation services; 90 % of 5.000 people who are dying by diarrhoea disease everyday are children not older than 5 years of age. Many women and girls spend hours (often 4–6 hours) everyday fetching and ferrying water, which effectively preclude girls from obtaining an education (SIWI, 2004).
The deputy of Conservation of the Environment at Ministry of the Environment, Mr. Sudariyono, stated that the potential for water resources in Indonesia reached 15 000 cubic meter per capita each year. The number is higher than the potential in general world supplies that only reached 8.000 cubic meter per capita each year. FAO (Food and Agriculture Organisation) categorized Indonesia as the country with level of 33 of 147 countries surveyed. Actually, the figure of water allowance accessibility is only 40 percent, according to Sudariyono, which leads to a decline of the water potential in many areas. Decline in potential water was triggered not only by denudation and pollution but also many areas arrested water caused by changing function of
forestry. This condition is a worst crisis; precisely it happened in various areas, especially the Java and Bali Island that experienced serious environmental damages. It also happened in the West Nusa Tenggara Province (NTB), South Sulawesi Province (Tempointeraktif, 2005).
3.2.1 Large Dependence on Non Treated Water Sources: Service Area Problems
According to company profile (June 2005) the water supply service area of Makassar Water Authority covers 55.2 % of households in the service area of Makassar Municipality. In other words, a lot of people in the service area still rely on groundwater from shallow wells. Gowa water authority also has services coverage less than 50 % due to wide coverage areas. Another more than 50 % are supported by shallow wells. In 2003 Gowa Water Authority bought bulk drinking water from Makassar Water Authority of 184.350 m3. The average tariff was 1.881 Rupiah/m3 or 0,19 /m3. Data recorded is manually without computerization. The Makassar and Gowa water authorities are taking their raw water directly and indirectly from Jeneberang River for water municipality and industrial purposes. Another industrial purpose is the Sugar factory in Takalar Regency / PTPN IV (JICA, 2004).
3.2.2 Existing Water Supply System
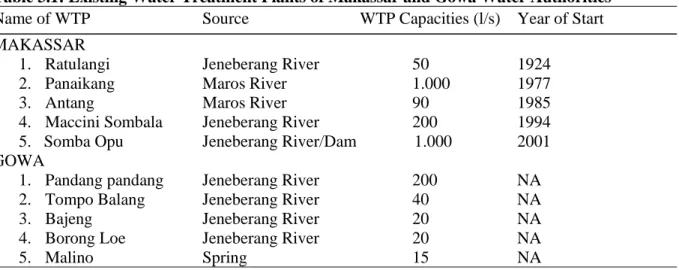
Water Treatment Plants in Makassar and Gowa Water Authorities are listed below:
Table 3.1: Existing Water Treatment Plants of Makassar and Gowa Water Authorities
Name of WTP Source WTP Capacities (l/s) Year of Start
MAKASSAR
1. Ratulangi Jeneberang River 50 1924
2. Panaikang Maros River 1.000 1977
3. Antang Maros River 90 1985
4. Maccini Sombala Jeneberang River 200 1994
5. Somba Opu Jeneberang River/Dam 1.000 2001
GOWA
1. Pandang pandang Jeneberang River 200 NA
2. Tompo Balang Jeneberang River 40 NA
3. Bajeng Jeneberang River 20 NA
4. Borong Loe Jeneberang River 20 NA
5. Malino Spring 15 NA
Source: JICA, 2004: 8-11
The largest water user in this river basin is Makassar Water Authorities which are serving water to most part of Makassar City. The currently total of water production at about 2.340 l/sec of the existing water treatment plants owned by Municipality, the water sources of 1.250 l/sec or about 53 % rely on the Jeneberang River throughout a year (JICA, 2004).
The Bili bili multi purpose dam has an existing storage capacity of 305.0 million cubic meters for water supply allocation, providing to 23.690 ha of agricultures or equivalent to 327 million cubic meters, with river maintenance flow of 1.000 m3/s, and for municipal water supply of 107.3 million cubic meters or 3.4 m3/s. The raw water of transmission main with capacity of 3.3
m3/s completed in 1999. The existing Somba Opu water treatment plant is located in Sungguminasa (Gowa Regency). However, the capacity of the plant is limited to 1.1 m3/s. The Makassar water demand in 2020 is projected to total amount of 195.9 million cubic meters or 36 % of the existing Bili bili multi purpose dam of 305.0 million cubic meters. Based on the projected and existing storage of capacity described, this amount of total allocation of the existing storage capacity of water is under control or safety (CTI, 2001). The continuity of raw water supplied by Makassar Water Authority is discharged from both sources of Bili bili multi purpose dam and Jeneberang River.
The two water resources of Makassar Municipality and Gowa Regency, Jeneberang River and Lekopancing Weir are resources with water quality problems. On the other hand, service area of Gowa Water Authority is fully dependent on the water resources of the Jeneberang River basin. The local Agency of Planning was informed that Jeneberang was being extracted since last year to the Paper factories in Gowa Regency and the Sugar factory in Takalar Regency. The water pumped to the Sugar factory at about 500 l/sec for use of processing in factory as well as irrigation for field in the plantation (JICA, 2004). The present water use of the Jeneberang River is shown in Fig. 3.2 below.
3.2.3 Taxes Paid by Water Authorities to the Central and Local Government
Based on the rule of autonomy, the total amount of water used for all activities should be paid to the Central and Local governments. Both Makassar and Gowa Water Authorities of taxes have been paid annually to the Provincial government of South Sulawesi the amount of 10 Rupiah / m3 for year 2003 or $US 0,001 /m3, based on the Provincial Regulation No 3 /2002 (regarding Underground and Surface Water Use Tax and Government Regulation No 65/2001). On the other hand Gowa Water Authority has received a financial assistance from Central and Local governments through supply of distribution pipes (JICA, 2004).
3.2.4 General Tendency of Water Consumption
The water service ratios in surrounding regencies such as Gowa and Takalar Regency are smaller than Makassar City. The number of household served by Water Authorities and annual water production in 2000 in each Water Authorities (PDAM) are summarized in Table 3.2. JICA projected in 1985 the water demand in the Makassar service area for 2005 to a total of 326.000 m3/day or 3.780 liter/s, which consist of 72 % of domestic water demand and 28 % of non domestic water demand. The total of municipal water demand in the service areas both Makassar and Gowa Water Authorities in 2020 are projected to be 164 million cubic meters for water (5,215 liter/s) and 25.6 million cubic meters for water (810 liter/s) (JICA, 2004).
3.2.5 Operation and Maintenance of Water Supply Production Facilities
Bili bili multi purpose dam is providing services such as flood control and water supply to agricultural and domestic users. Power generation will be available in 2005. Those facilities provide an opportunity to improve livelihoods, increase incomes and reduce vulnerability.
Fig. 3.2: Water use at Jeneberang River
Source: JICA, 2004: 8-28
Table 3.2: Area Coverage, Number of households Served and Annual production In 2000
City / Regencies
Total Area Unit Makassar Gowa Takalar
(1) Area Coverage
Service Area km2 175.0 79.5 55.5
Area coverage ratio % 100 4.2 9.8
(2)Service Coverage in Household Number (Hh)
Total number of Hh Nos 237.085 2.315 919
Number served Nos 30.7 2.2 1.9
Service Coverage ratio % 175.0 79.5 55.5
(3) Annual Water
Production 1000 m3/year 16.239 348 68
Percapita consumption l/day 120 86 42 Source: CTI, 2001: 8-14
Water canals, drainage and irrigation are also part of an infrastructure stock that water management and services rely on. It is obvious that water storage and hydropower infrastructure benefits on economic growth and poverty alleviation. The existing facilities on the Jeneberang River are built and operated mainly for the main flood reason. From its beginning of colonialism era, Makassar has been prone to flooding due to its unfavorably low location on the coast of the Makassar Sea and the habitat of Jeneberang River. It is situated within the river basin of several rivers, transporting large amounts of water during the rainy season. The problem is aggravated by the rapid urbanization along with severe water extraction, leading to steady sinking of the ground water level. As the past colonial and postcolonial anti-flooding measures were often strongly lacking behind the rapid growth of the city – parts of them being implemented when the city population and built area were extended already two to three times – comprehensive water and urbanization planning should be aimed for.
The existing of water intake facilities on the Jeneberang River are operated and maintained by the owners of water treatment plants (Makassar and Gowa Water Authorities and the Sugar factory in Takalar Regency) with an exception of raw water transmission main and chambers (RWTM) owned by the JRBDP. The intake facilities of RWTM across 17 km of a single concrete pipeline, with the range of diameter 1,650 – 1,500 mm and supplied water from Bili bili multi purpose dam to Somba Opu Water Treatment Plant (JICA, 2004).
3.2.6 Environment Law and Environmental Impact Assessment (EIA)
Poor people in particular are directly dependent on the ecosystem goods and services for their livelihood. SIWI (2005) reported that in Uganda the use of inland water resources is worth almost $US 300 million a year in terms of forest catchments protection services.
The root of regulation on Indonesian environmental policy is the Law No. 4 1982. It is concerning to the main rule of national environmental management. It is stated that the management of environment should be based on the principle of sustaining harmonized, and balanced environmental capability in such a way as to support the process of sustainable development for the purpose of increasing human welfare. This law acts as an “umbrella provision”, so that at the operational level it should be complemented by a set of environmental legislation, both at national and provincial levels.
One important peripheral aspect of this law is Government Regulation No. 51, 1993, concerning Environment Impact Assessment (EIA), which is basically the operational step of Law No. 4, 1982, which states that all planned activities which are considered to have a significant negative impact on the environment are obliged to be complemented with EIA documents.
As mentioned earlier EIA is compulsory for planned activity which might affect the environment significantly. This implies that not all planned agricultural activities should be accompanied by EIA documents. Instead of EIA documents, the plan of activities which are considered not to have a significant impact on the environment or which can avoid such an impact by the use of available technology, should have Environmental Management Effort (Upaya Pengelolaan LingkunganUKL) and Environmental Monitoring Effort (Upaya Pemantauan Lingkungan
-UPL) documents. EIA or UKL and UPL documents must be completed before building construction and land clearing etc.
Therefore, the study of EIA has to be conducted after the principal and location approval are issued by the government and must be finished before physical construction is initiated. The documents of EIA or UKL and UPL are required to obtain a permanent business license. To control the quality of the EIA documents and compliance with the reference made by the government, EIA commissions have been established in each Technical Department /Ministry (Selintung, 2000).
The main task of the commission is to evaluate and to give formal approval of the documents. For agricultural investment at the national level, a National EIA Committee, chaired by the Director-General of the Agency for Agribusiness, undertakes the evaluation of EIA documents. UKL and UPL documents are not evaluated by the EIA Commission, but are directly evaluated by the technically related institution responsible for the activities being planned, such as the Directorate-General for Food Crops, Estate Crops, etc. The EIA suggested that the project and resettlement areas needed protection and improvement, and so required some environmental work to be done. Bili bili multi purpose dam construction began in June 1992 and scheduled to be completed by the end of 1998, but was actually finished one year earlier, October 1997. The reservoir began filling and reached an elevation of +59.0 m by November 27, 1997. Appropriate technical information was used when to decide to build the dam and to design the structure. In order to cut costs, the geologic information for the foundation of the dam was collected only every 500 m instead of the planned every 100 m (Ibid).
The EIA was not used to decide on which site to choose and it was done after the Construction documents were completed. The EIA failed to mention a number of problems that developed after the dam was completely finished. For instance, after the river flow was reduced in the downstream sections, saltwater intruded further into the river and it rendered two drinking water intakes which were unusable. It has been necessary to build a sand pocket and rubber dam to control salt water intrusion. Sand mining continued below the dam, but the reduced sediment flow has caused the river bed elevation to decline and threaten the Sungguminasa Bridge. Jenelata River that joins the Jeneberang just below the dam is the only source of sediment to replenish the sand mining. The EIA also failed to adequately measure the sediment flow from the upper reaches of the river into the reservoir. New calculations done in 1994 put the sediment load at 1.794 m3/ km2 /year, essentially doubling the sediment flow calculated when the dam was being designed. This means that the reservoir has a life of only 25 years, not 50. However, in order to overcome the sediment problems, eleven sand pocket dams and four Sabo dams are being built upstream. The EIA also looked at the social and economic impact of the dam and projected the need for resettlement of several villages, and construction of a section of the major road to Malino. One of the resettlements was not at all successful and the village disbanded. The other at Liner C is built, but the market area appears unused, and the spacing of the houses makes it look less like a village than other settlements in the area (Ibid).
CTI Monthly Monitoring Report in 2001 reported that the negative impacts related to the Bili bili multipurpose dam construction work are the turbidity of water, dust and noise. The condition of Sabo Dam and Sand Pocket (water infrastructures to collect and catch sand and silt) indicated no
serious erosions occurring in upper Jeneberang river basin while Sabo and Sand Pocket were constructed. The sedimentation into the reservoir should be carefully controlled. The level of turbidity and color are below the standard requirements. Turbidity is detected with value of ranging from 4.33 to 11.67 mg/l (< 25 NTU). The Water color level measured ranging from 18.33 to 48.33 TCU (standard requirements is 50 TCU) (CTI, 2001). In contradiction, a survey and also a film documented after the landslides, showed that the sedimentation were a case of emergency. The problems are not only agriculture damages of highly polluted suspended solid but also problems with water treatment facilities and Bili bili multi purpose dam (Ageng, 2005). Monthly Monitoring report (2001) of water quality monitoring activities was carried out in upper and lower areas of the dam. Upstream areas conducted with 5 different of locations point of rivers: Terong River: 2 points, Jonggoa River: 1 point, Sand Pocket No 4: 1 point and Mangempang River: 1 point. Downstream samples were taken at 4 different locations (points) at outlet of the dam: 2 points and at Kampili Weir: 2 points. The water quality at Bili bili multi purpose dam in 2001 also recorded the amount of Nitrogen total T), Nitrogen ammonia (N-NH3), Nitrogen-nitrite (N-NO2), Phosphor: Nitrogen total: 0.123-0.134, Nitrogen ammonia: 0.027 – 0.032, Nitrogen-nitrite: 0,026- 0.030, Phosphor: 0,023-0.032 (mg/l). All values are in accordance with those national standard requirements (N-NH3 < 0.5, N-NO2 < 1, N-NO3 < 10 (mg/l) except no water quality standard for Phosphor (CTI, 2001).
CHAPTER 4: HUMAN RESOURCES REVIEW
IN WATER UTILITIES
One of the important implications for Human Resources (HR) is globalization. Globalization impacts on HR in various ways. Thus compared to the past, enterprises will need to update much more regularly the mix-skills of their employees, responding to the opportunities or threats created by globalization and rapid technological changes. The changes of attitudes, knowledge and skills of the workforce of the corporate culture of water enterprises and its support will determine the quality of the human resources, also processes behind its products as well as services. This is the main reason why human resources are connected to water utilities. In this chapter, I will describe the requirements of HR in order to establish a Public Corporate in the Jeneberang river basin.
As a starting point I will discuss human resources in relation to capacity building, capacity of irrigated farmers, the Millennium Development Goals, Human Development Index and indicators.
All traditional practices of historical water resources in Indonesia, such as Tudang Sipulung in South Sulawesi, was acted and supported by supervisors responsible to controlling and managing the water resources. They were responsible to open and close the water gate daily in the rice fields for changing water rotation to the farmers. Some of them were acting to facilitate to water users when a water problem occurred which lead deliberation (Musyawarah) among both farmers and customers.
Church (1999) reported that the Dutch introduced Western education in order to provide the skilled labor needed by the expanding colonial economy. The best schools were used by the Dutch as the medium of instruction, graduation from which led to better paid administrative jobs or the possibility of entering a University in the Netherlands, or the medical and law schools in the colony. Entries to these schools for Indonesians were very difficult and those few on scholarships were restricted to children of the indigenous elites or government officials. It was easier to get a modicum of education in schools where the medium of instruction was the vernacular language.
4.1 Capacity Building
Indonesian National Planning Agency (BAPPENAS) defined that capacity is ability of individual and organization or a system to perform functions and meet objectives effectively and efficiently. Water quality, in certain watersheds, has deteriorated drastically from in-stream and off-stream pollutants. Some water storage reservoirs in cities have reached eutrophication condition. Even in the countryside, where population clusters are often concentrated along canals and streams, water of appropriate quality for domestic use is becoming increasingly scarce. Improved and more focused government, private and public sector participation and commitment are needed to ensure environmentally responsible management of water quality (Bappenas, 2005).