of sound from
wind turbines
Eja Pedersen,
Halmstad University and Occupational and Environmental Medicine, University of Gothenburg
Jens Forssén
Applied Acoustics, Chalmers University of Technology Kerstin Persson Waye
Occupational and Environmental Medicine, University of Gothenburg
SWEDISH ENVIRONMENTAL PROTECTION AGENCY
Internet: www.naturvardsverket.se/bokhandeln The Swedish Environmental Protection Agency Phone: + 46 (0)8-698 10 00, Fax: + 46 (0)8-20 29 25
E-mail: registrator@naturvardsverket.se
Address: Naturvårdsverket, SE-106 48 Stockholm, Sweden Internet: www.naturvardsverket.se
ISBN 91-620-6370-2.pdf ISSN 0282-7298 © Naturvårdsverket 2010
Digital Publication Cover photos: Eja Pedersen
Preface
There is a great need for knowledge concerning the impact of wind power on humans and landscapes, the marine environment, birds, bats and other mam mals. Previous studies regarding the environmental impacts from wind farms have lacked an overall view of the effects. This has lead to deficiencies in the processes of establishing new wind farms.
Vindval is a program of knowledge and a cooperation between Energi myndigheten (Energy Authority) and Naturvårdsverket (Environmental Protection Agency). The purpose of the program is to collect and distribute scientific based facts regarding the impacts of wind power on human and nature. The commission of Vindval extends to 2012.
The program comprises about 30 individual projects and also three so called works of syntheses. These syntheses consists of experts which compile and assess the collected results of research and experience regarding the effects of wind power within three different areas – humans, birds/bats and marine life. The results from the research projects and work of syntheses will provide a basis for environmental impact assessments and in the processes of planning and permitting associated with wind power establishments.
Vindval requires high standard in the work of reviewing and decision making regarding research applications in order to guarantee high quality reports. These high standard works are also carried out during the reporting approval and publication of research results in the projects.
This report was written by Eja Pedersen – Halmstad University and Occupational and Environmental Medicine, University of Gothenburg, Jens Forssén – Applied Acoustics, Chalmers University of Technology and Kerstin Persson Waye – Occupational and Environmental Medicine, University of Gothenburg. The authors are responsible for the content.
Contents
PrEfAcE 3 SummAry 7 SAmmAnfATTning 9 1 BAckgrOund 11 2 PrOjEcT AimS 13 3 PrOjEcT grOuP 14 4 mEThOdS 15 4.1 Study areas 15 4.2 Epidemiological studies 16 4.3 Diary study 184.4 Measurements of sound and meteorology 19
4.5 Modelling of sound propagation 20
5 PErcEPTiOn Of wind TurBinE SOund 21
5.1 Relationship between sound level, possibility of hearing the sound,
and annoyance 21
5.2 Situational factors influencing the perception of wind turbine sound 22
5.3 Individual factors related to perception of wind turbine sound 23
5.4 Multivariate analyses of influencing factors 25
5.5 The impact of wind turbine sound on health and well-being 28
5.6 Relationship between annoyance due to sound from wind turbines and
health and well-being 28
6 hOw OfTEn ThE SOund frOm wind TurBinES iS hEArd 29
7 SOund PrOPAgATiOn 33
8 diScuSSiOn And cOncluSiOnS 35
9 rEfErEncES 38
Summary
The erection of wind turbines is preceded by an environmental assessment of the impact of wind turbines on people living nearby. One impact to be assessed is sound. It is thus important to have scientifically based knowledge of how wind turbine sound will be perceived in order to ensure that this sound does not adversely affect the health of residents in the area. This report presents an analysis of the results from two previous field studies investigating the relation between sound levels from wind turbines at dwellings and the perception of the sound. It also describes the factors influencing this relationship. In a diary study the participants reported how often they were home and, if so, whether they were outdoors, and whether they could hear the turbines. The objective of this study was to describe how often the sound from wind turbines was heard and in which meteorological conditions. A complementary field study investigated the accuracy of the sound propagation model used today by com paring longterm sound measurements with the values calculated using differ ent models. This study also investigated whether variations in meteorological factors influenced sound propagation to such a degree that they should be included in the calculation of sound levels.
The joint analyses of the two field studies confirm and strengthen previously reported data. The percentage of respondents who noticed wind turbine sound as well as the percentage annoyed by the noise, increased with increasing sound levels. The probability of being annoyed was greater in rural areas and if the turbines were visible from the dwelling. However, differences in terrain had no statistical effect. The only association between sound levels and healthrelated variables other than annoyance was disturbed sleep.
Participants in the diary study more often reported hearing sound from the wind turbines when the electrical power increased (i.e. when electricity produc tion increased). A statistically significant relationship between how often the sound was heard and the calculated sound level at the dwelling was found, even though the amount of time the participants spent outdoor varied substantially; the higher the calculated sound level, the more often the sound was heard. The diary study also gave some insight into the relationship between audibility and wind speed. The results indicate that wind turbine sound could still be heard at relatively high wind speeds, when it would have been expected to be masked.
Longterm measurements of wind turbine sound at about 550 meters from a modern turbine showed that the calculated and measured levels agreed well. Sound levels calculated using a parabolic equation model, which takes into account variations in meteorological factors, did not give a better prediction than the model commonly used at environmental permit proceed ings [Naturvårdsverket 2001]. Meteorological variations are probably only of importance for sound propagation at longer distances. Meteorological circumstances could, however, be important for estimation of the source sound levels, the largest element of uncertainty in the calculations.
8
The studies show that the sound levels vary at the same wind speed, and that wind turbine sound could still be heard at wind speeds when it should be masked by other windinduced sounds. This implies that the description in the environmental impact assessment of the sound that neighbours will pos sibly hear should be extended, even though the sound propagation model used today is adequate. Further studies regarding the possibility of hearing the sound at high wind speeds are needed, as the number of participants in the diary study was small. The data also suggest that the risk of sleep disturbance should be further explored.
Sammanfattning
I samband med uppförandet av vindkraftverk görs en miljökonsekven sbeskrivning som också innefattar en bedömning av hur människor som bor i området kommer att påverkas av vindkraftverken. En påverkansfaktor är ljud. För att korrekt beskriva hur ljudet kan komma att uppfattas och för att säkerställa att inte verken placeras så att ljudet påverkar de kringboende negativt, är det viktigt att ta fram vetenskapligt baserad kunskap. I den här rapporten presenteras resultaten från flera studier. Samanalyser av resultaten från två fältstudier hade som syfte att visa sambanden mellan ljudnivån från vindkraftverk vid bostaden och upplevelsen av ljudet, och att beskriva fak torer som påverkade detta samband. En dagboksstudie, där deltagarna bl.a. fick fylla i hur ofta de var hemma och i så fall om de var ute, syftade till att beskriva hur ofta vindkraftsljudet hördes och vid vilka meteorologiska situ ationer. För att undersöka hur väl den ljudutbredningsmodell som används idag stämmer med fältmätningar och om den meteorologiska variationen har så stor betydelse för ljudutbredningen att de bör tas med vid beräkningen av ljudnivåerna, gjordes långtidsmätningar av ljudet där resultatet jämfördes med olika modeller för beräkningar.
Den sammanvägda analysen av de två störningsstudierna bekräftar och förstärker tidigare rapporterade data. Såväl andelen som märkte vind kraftljud och andelen som stördes av ljudet ökade med ökande ljudnivåer. Sannolikheten att störas av ljud var större om verken var synliga från bosta den och om man bodde i jordbrukslandskap, medan terrängen inte hade någon inverkan. Bland andra studerade hälsorelaterade variabler fanns endast ett samband mellan att störas i sömnen och ljudnivå.
I dagboksstudien noterade deltagare oftare att de hörde ljud från vind kraftverk när den momentana effekten, d.v.s. elproduktionen, ökade. Även om det var stora individuella variationer i hur mycket tid människor tillbring ade utomhus vid sin bostad kunde ett statistiskt säkerställt samband mellan hörbarhet och beräknad ljudnivå påvisas; ju högre beräknad ljudnivå, ju oftare hördes verket vid utomhusvistelse. Dagboksstudien gav även viss kun skap om samband mellan hörbarhet och vindhastighet. Resultaten indikerar att vindkraftsljud hörs även vid relativt höga vindhastigheter då ljudet från vindkraftverket förväntas vara maskerat.
Långtidsmätningar av vindkraftverksljud 550 meter från ett modernt verk visade att de beräknade ljudnivåerna stämde väl med de uppmätta. Ljudnivåer beräknade med parabolisk ekvationsmodell, som tar hänsyn till variationer hos meterologiska variabler, gav inte bättre överensstämmelse jämfört med den modell som oftast används vid tillståndsprövning [Naturvårdsverket 2001]. Meterologiska variationer har sannolikt bara betydelse för ljudutbredelsen på längre avstånd. Meteorologiska förhållanden kan dock ha betydelse vid skatt ningen av källjudnivån, som är den största osäkerheten vid beräkningen.
10
Studierna visar att ljudnivån varierar vid en och samma vindhastighet, och indikerar att vindkraftljud hörs även när det blåser så mycket så att vindkraft sljudet borde maskeras av andra ljud åstadkomna av vinden. Det innebär att även om den ljudutbredningsmodell som ändvänds idag fungerar väl, så bör presentationen i miljökonsekvensbeskrivningen av det ljud som de närboende kan komma att höra utvidgas. Fler studier kring hörbarheten vid höga vind hastigheter behövs också eftersom dagboksstudien hade relativt få deltagare. Studierna pekar på att risken för sömnstörningar kan vara angeläget att undersökas vidare.
1 Background
When modern wind power was introduced in Sweden in the late 1990s, there was little information about how residents in wind turbine areas would be affected. There was uncertainty about how close to a dwelling a wind turbine could be placed without nuisance. Complaints about noise were reported now and then to environmental and health departments in municipalities with wind turbines [Pedersen and Persson Waye 2004]; however no systematic study of the relationship between sound levels and annoyance due to wind turbine noise was available. It is known that environmental noise in the home environment (e.g. from traffic and nearby industries) affects wellbeing. Indications of a rela tionship between sound and stressrelated diseases such as cardiovascular dis ease have also been found [Babisch et al. 2005]. It is therefore urgent to study the levels of wind turbine sound at which the risk of nuisance occurs in order to base recommendations regarding wind farm placements on these results.
The relationship between sound from other environmental sources, such as traffic and industry, and noise annoyance has been established and reported. Wind turbines, however, differ in several ways from previously studied sources of sound. The sound from wind turbines is generated mainly by the turbulence around the rotor blades when the wind meets the blade, and when the blade moves through the air. The sound has a swishing character and increases and decreases with the rotation of the blades. These changes are inevitable given the differences in wind speed at different heights over the ground and the fact that the tower itself decreases the wind speed. The character of the sound can consequently only be marginally changed. An amplitude modulated sound like this is easy to perceive and has been found to be more annoying than sounds with a more even character [Bradley 1994, Bengtsson et al. 2004].
Wind turbines are also prominent objects in the landscape and are often placed in rural environments, where they may be perceived as foreign objects. The strength of the perceived intrusion is partly related to the characteristics of the environment where the wind turbine is placed. In a builtup environment, a wind turbine will become just one of many other buildings and it can thus be assumed to be less disturbing in a more urbanized area. The topography may also influence the appraisal of wind turbines. In a hilly landscape a wind turbine will be one of several vertical lines, whereas in a flat landscape it will break up the horizon and less easily be considered part of the landscape. It can be hypoth esized that the visual impact, including the rotation of the rotor blades, may physiologically increase the impact of the sound; two senses stimulated at the same time are known to lead to higher alertness [Calvert 2001].
Two crosssectional studies with the objective of establishing a relation ship between the levels of wind turbine sound and the proportion of people annoyed by the noise were carried out by the Department of Occupational and Environmental Medicine at the University of Gothenburg, starting in the year 2000. The results have previously been reported [Pedersen and Persson Waye 2004; 2007], but multivariate analyses of the dataset give rise to increased
12
knowledge of how the sound is perceived in different environments due to the visual impression of the wind turbines. Also, it is not clear how often situations that could cause annoyance occur, that is, how often the level of wind turbine sound at a dwelling is high enough in comparison to the background wind sound to be heard when the resident is at home and spending time outdoors.
The sound emitted from wind turbines is generated high above the ground, typically at 50 to 150 m height. As the sound propagates, the sound level decreases the further away from the wind turbine the receiver is located. The type of ground and the meteorological situation influence how much the sound level decreases with distance. In calculating the immission sound levels at a dwelling, the situation used as standard is that the wind speed is 8 m/s at a height of 10 m downwind from the turbine to the dwelling. The Swedish Environmental Protection Agency has proposed recommendations for the calculation of sound levels [Naturvårdsverket 2001]. However, the simplified algorithm does not take into account meteorological variations such as rela tive humidity and temperature (which influence air absorption), and instead assumes an average situation. A wind speed profile other than the assumed profile could lead to an alternative spreading of the sound and higher sound levels than expected [van den Berg 2006]. The simplified model used today needs to be validated with measurements of immission sound levels and tested against other calculation models.
2 Project aims
Perception of wind turbine sound has been studied both experimentally and in the field in several projects within the Swedish research programs Vindforsk and Vindval. The overall aims have been:
– To describe the relationship between levels of wind turbine sound at the dwelling and the percentage of people annoyed by the noise. – To describe the factors the influence this relationship.
The latest studies to have been completed in collaboration with Applied Acoustics, Chalmers University of Technology, have focused on three comple mentary questions:
– How is annoyance due to noise influenced by the visual impression of wind turbines in different landscapes?
– How often is the sound from wind turbines heard by people living nearby, and how often is it annoying?
– How accurate is the sound propagation model used today, and do meteorological factors have sufficient influence to be considered in the calculation of sound immission?
14
3 Project group
The following people participated in the research group:
Kerstin Persson Waye, Professor, MedDr in Environmental Medicine.
Occupational and Environmental Medicine, Sahlgrenska Academy, University of Gothenburg. Project coordinator. Email: kerstin.perssonwaye@amm.gu.se
Eja Pedersen, MedDr in Environmental Medicine. Occupational and
Environmental Medicine, University of Gothenburg. School of Business and Technology, Halmstad University
Jens Forssén, Docent, PhD in Acoustics. Applied Acoustics, Chalmers
University of Technology
Irène Lauret Ducosson, MSc in Acoustics. Applied Acoustics, Chalmers
University of Technology
Martin Björkman, DrMedSc in Acoustics. Occupational and Environmental
Medicine, University of Gothenburg
Agneta Agge, Research Technician, Occupational and Environmental
Medicine, University of Gothenburg
Yvonne Löfquist, Research Assistant, Occupational and Environmental
Medicine, University of Gothenburg
Martin Schiff, MSc in Acoustics. Applied Acoustics, Chalmers University of
4 Methods
4.1 Study areas
A total of twelve wind turbine areas with a population large enough to obtain statistical confidence were selected for the two crosssectional studies that were carried out during 2000 and 2005 (Table 1). The twelve study areas varied in topography (flat or hilly) and degree of urbanization (rural or built up). Only areas with at least one wind turbine of nominal power 500 kW or more were included in the studies, but sound levels from smaller wind tur bines within the selected areas were taken into account in the calculations of sound immission levels.
Table 1. Study areas Area
muni-cipality wind turbinesno hub height Topography urbanization (m) Power (kw) Start year
A Laholm 2 50 600 1998 Flat Rural
B Laholm 3 50 600 1998 Flat Rural
c Laholm 8 50 600 1998 Flat Rural
d Laholm 1 1 47 40 600 150 1999 1995 Flat Built-up
E Laholm 1 65 500 1999 Flat Rural
f Öckerö 1 50 660 1999 Hilly Built-up
g Tjörn 1 60 850 2004 Hilly Rural
h Orust 1 65 600 2001 Hilly Rural
i Lysekil 2 2 55 40 750 550 2000 1995 Hilly Built-up j Varberg 3 1 7 2 41 30 30 30 600 250 225 225 1995 1993 1991 1994 Flat Rural k
Lands-krona 22 6541 1,500550 20021996 Flat Rural l
Simris-hamn 13 4232 500225 19961993 Flat Built-up
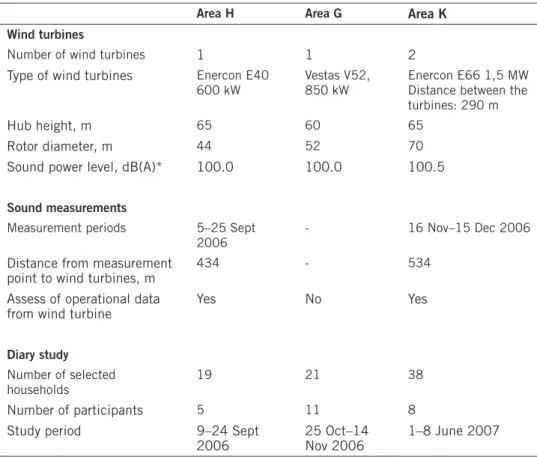
Three of the rural study areas in the crosssectional studies (Area K, Area H and Area G) were also investigated to study the influence of meteorological factors on sound propagation in various topographies, as well as how often and in which situations residents in the areas perceived the wind turbine sound. For Area K, only the part where the two larger wind turbines are placed was included. The topography in Area G and Area H is hilly with a wind turbine on a rise sur rounded by an irregular landscape (small fields, hills, trees). An overview of the wind turbines and measurements in the three areas is shown in Table 2.
16
Table 2. description of the three areas that were chosen for further study
Area h Area g Area k
wind turbines
Number of wind turbines 1 1 2
Type of wind turbines Enercon E40
600 kW Vestas V52, 850 kW Enercon E66 1,5 MW Distance between the turbines: 290 m
Hub height, m 65 60 65
Rotor diameter, m 44 52 70
Sound power level, dB(A)* 100.0 100.0 100.5
Sound measurements
Measurement periods 5–25 Sept
2006 - 16 Nov–15 Dec 2006
Distance from measurement
point to wind turbines, m 434 - 534
Assess of operational data
from wind turbine Yes No Yes
diary study
Number of selected
households 19 21 38
Number of participants 5 11 8
Study period 9–24 Sept
2006 25 Oct–14 Nov 2006 1–8 June 2007 *wind speed 8 m/s at 10 m height by the turbine, uncertainty ±1 dB, data from the manufacturer.
4.2 Epidemiological studies
Preliminary sound propagation calculations were used to define the study population, i.e. each household that were exposed to 30 dB(A) or more from the wind turbines. In areas with many households, the number of households was randomly reduced so that the crosssectional studies would not be too costly. One randomly selected person in each household was asked to answer a questionnaire (n = 1822). The questionnaire concerned the perception of factors in the living environment in general, but also included specific ques tions about wind turbines. Several questions measured response to sound from wind turbines. The question used in this report as a measure of perception of sound from wind turbines was: “Specify for each of the inconveniences below whether you notice it or are annoyed by it outside your dwelling”, followed by a list of potential stressors of which wind turbine sound was one. The answers used a 5point verbal rating scale with 1 = “do not notice”, 2 = “notice but not annoyed”, 3 = “slightly annoyed”, 4 = “rather annoyed” and 5 = “very annoyed”. In this report the expression “notice sound from wind turbines” is used for the four highest scale points (from “notice, but not annoyed” to “very annoyed”). The expression “annoyed by sound from wind turbines” is used for the two highest scale points (“rather annoyed” and “very annoyed”).
The participants also rated which of eight suggested sound characteristics were perceived as annoying. These sound characteristics were assessed in a previous experimental study to determine the importance of the frequency distribution in sound from wind turbines [Persson Waye and Öhrström 2002], and comple mented in this study with local assessments.
Attitudes to wind turbines were measured by several questions. The general attitude and the attitude to the impact of wind turbines on the landscape were measured on 5point scales from “very positive” to “very negative”. The par ticipants were also asked to make assessments using 14 descriptors of wind tur bines developed by Karin Hammarlund and used with her permission. Noise sensitivity was measured on a 4point scale from “not at all sensitive” to “very sensitive”. The questionnaire also included questions about age, gender and health status, asking about such things as longterm diseases, sleep problems, and stressrelated symptoms.
Levels of wind turbine sound outside the dwellings were calculated for all individuals in the study population using the sound power levels provided by the manufacturer, and the sound propagation model recommended by the Swedish Environmental Protection Agency [2001]. In areas with more than one wind turbine, sound pressure levels at the dwellings were summed logarithmi cally. The study sample was divided into 2.5 dB(A)interval groups according to the calculated sound levels so that the prevalence of annoyance at different sound levels could be compared and shown graphically.
All variables measured in the questionnaire as well as the calculated sound pressure levels at the dwellings of the respondents were entered into the same database. Of the selected study sample, 1095 people returned the question naire and answered the main questions that were used in the analyses (response rate: 60%).
Results are presented as absolute numbers and as percentages of respond ents (%). The 95% confidence intervals (CI) were calculated in accordance with Wilson [Altman et al. 2000]. The confidence intervals indicate the mar gins within which the percentage of respondents would be found with 95% probability if the study were repeated an infinite number of times using dif ferent samples from the study population. Spearman’s rank correlation test (rs) was used for assessing relationships between two variables. The result of this test is a value between 1 and 1. Values close to 1 or 1 indicate a statisti cally significant relationship (negative or positive) between the variables, also shown by a pvalue < 0.05; values close to 0 mean that there is no such rela tionship. Differences between two groups were tested with the MannWhitney Utest (Z); pvalues < 0.05 were interpreted as a statistically significant dif ference. Binary logistic regression was used for testing relationships between several variables simultaneously. The result is shown as odds ratios (OR) with 95% confidence intervals. The relationship is interpreted as statistically signifi cant if both ends of the confidence interval are > 1 (positive relationship) or both ends are < 1 (negative relationship).
18
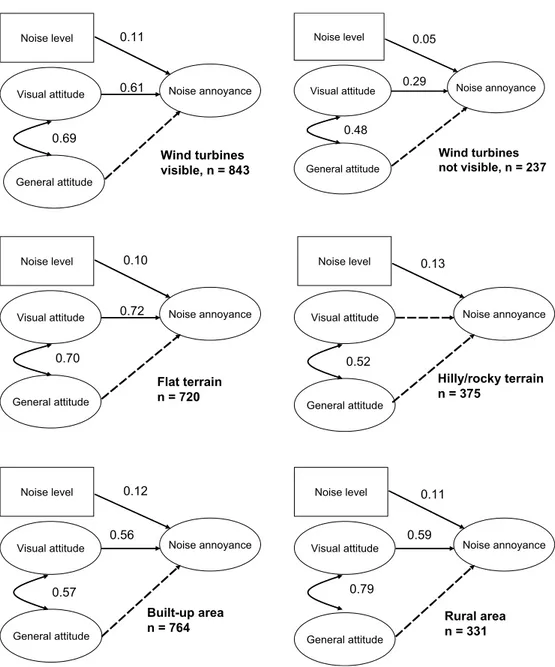
Structural equation modelling was used for testing more complex relation ships. A model was initially developed based on observations in the previous analyses. The model was then tested in different groups of respondents. The result is presented in Figure 4. Statistically significant relationships are shown with unbroken lines and standardized regression weights between 0 and 1; the closer to 1, the stronger the relationship. Dashed lines indicate that no rela tionship was found.
4.3 Diary study
A letter was sent to residents in three wind turbine areas requesting their par ticipation in a study to explore how often sound from wind turbines was heard in their living environment. The sampling was not random. Lists of households within 1000 m of a wind turbine were purchased from delivery companies, and one person in each household was sent the letter. These people were then con tacted by telephone. Those who did not want to participate were excluded from the study. In some cases, the person approached suggested another person in the household who agreed to take part in the study. The participants were paid.
Each participant filled in a diary protocol for each day in a threeweek long study period (Table 2). The protocol was returned the day after it was due to avoid the participant trying to recall the situation later if they had forgotten to fill it in. The participants were asked to note their location for each hour during the day and night (Indoors, Outdoors by the dwelling, Walking or simi lar in the area, Not home) and whether they heard wind turbine sound (Did not hear, Heard but was not annoyed, Heard and was annoyed). The partici pants were also encouraged to describe other significant sounds outdoors as well as make their own comments. At the end of the study period the partici pants answered questions about their attitude to wind turbines and how sensi tive to noise they perceived themselves to be. Data from the wind turbines was provided by production statistics and comprised hourly averages of wind speed at hub height, turbine speed (revolutions per minute) and electrical power.
Results from the diary study are presented in numbers and as percentages (%). The relationships between calculated sound level and the proportion of occasions when the participants heard sound from wind turbines during outdoor stays were analysed by linear regression (r). Differences between averages of electrical power, turbine speed and wind speed were tested with Student’s ttest (t).
4.4 Measurements of sound and meteorology
Sound from the wind turbines was recorded and measured (immission meas urements) with devices placed in a mobile measurement station (a caravan). A microphone was attached 10 cm from the centre of a vertical wooden board (1 x 1.2 m) on the outside of the station 1.5 m above the ground. A primary wind screen (diameter 10 cm) and a secondary wind shield (diameter 40 cm) were placed over the microphone. The sound was recorded for 10 minutes every full hour for 24 hours every night and day during the measurement period.Meteorological conditions were measured by the measurement station using a Davis Weather Monitor II with logger. Wind data (average speed and direction as well as maximum value) at a height of 10 meters were recorded for each oneminute period. Other meteorological data at a height of 1 meter (temperature, relative humidity and static air pressure) were similarly recorded. Wind speed at hub height of the wind turbine, electrical power and turbine speed were acquired from the production statistics that the energy company Vattenfall AB maintains for all wind turbines in Sweden. Data was delivered as averages over 10 minutes for the whole measurement period. The collection of data from the wind turbine failed at one of the study locations, Area G, despite strenuous efforts by the manufacturer and the owner. Operational data of the wind turbine in that area is therefore missing.
Measurements of sound power levels (emission measurements) of the wind turbine in Area K were carried out following the standard [IEC 2002] as closely as possible. The standard describes a method for deriving the Aweighted sound power level as a function of wind speed at 10 m height. For this method the sound pressure level must be measured close to the wind turbine in order to obtain a good signaltonoise ratio and reduce the effect of atmospheric sound propagation conditions; at the same time the microphone must not be too close compared to the size of the sound source. In accordance with this standard, Aweighted levels as well as third octave band levels were measured with an acoustical board at ground level 100 m downwind from the wind turbine. The hard board was rectangular (1.12 x 1.25 m), and made of 12 mm plywood. The wind speed and wind direction were measured at a point where the wind turbine had no or low effect on the air flow, also in accordance with the standard. Wind data and sound data were averaged over oneminute periods, both for data when the wind turbine was operating and for measure ments of background levels. There was one more wind turbine in the area, approximately 300 m south of the one of interest. Emission measurements were therefore avoided when the wind was directed towards the north so that the microphone did not have to be placed between the wind turbines to avoid polluting the measurements with sound from the second wind turbine. Both wind turbines were turned off to measure the background sound levels.
20
According to the standard, Aweighted sound pressure levels are obtained at integer values of the wind speed (meters per second). A second order polyno mial is fitted to the measured sound levels as a function of wind speed. The sound pressure levels are averaged (average of energy) over at least three meas urements at each wind speed. . Second order polynomials are obtained for both operating and background levels. The finite sound power level for the wind turbine is based on the two polynomials to correct for the background levels. This sound power level was used to calculate the sound pressure levels at the immission point.
Acoustical measurements were carried out with a Brüel & Kjær 2260 sound level meter with an extension cord to the microphone. The equipment was calibrated before and after each series of measurements. Both a primary and a secondary wind screen were used in order to decrease the influence of windinduced noise at the microphone. The insertion loss of this dualwind screen configuration was determined using random sound incidence measure ments in a reverberant chamber, and a corresponding correction was made to the measured data (approximately 1 dB(A) ).
4.5 Modelling of sound propagation
Sound levels at the measurement point were calculated both with the model proposed by the Swedish Environmental Protection Agency [2001] and a par abolic equation model (PE method). The model of the Swedish Environmental Protection Agency distinguishes between sound propagation over land and over water; we have used the simplified algorithm for propagation over land at distances shorter than 1 km. The model assumes downwind conditions and a wind speed of 8 m/s at 10 m height. The PE method is a numerical calcula tion method in which conditions along the propagation path are included, such as ground terrain and wind profiles, with the possibility of using wind speed profiles other than a logarithmic distribution. The following parameters were included in the model: wind speed at 19 m height for the assumed wind profile, the acoustical power at different sound frequencies, temperature gradient and temperature, relative humidity and static air pressure (temperature, humid ity and air pressure determine air absorption). Twelve measurements in Area K were used as examples for the calculations. In these, the wind speed varied from 3.3 m/s to 9.1 m/s (10 m height) while sound from wind turbines was heard on the recordings.
5 Perception of wind turbine sound
5.1 Relationship between sound level, possibility
of hearing the sound, and annoyance
The respondents were divided into groups in accordance with the calculated levels of wind turbine sound at their dwelling. The number of respondents in each 2.5 dBinterval is shown in Table 3.
Table 3. number of respondents within the five sound level intervals
dB(A) < 32.5 32.5–35.0 35.0–37.5 37.5–40.0 > 40.0 Total
n 445 332 168 106 44 1095
A statistically significant relationship was found between levels of wind tur bine sound at the dwelling and the proportion of respondents who noticed the sound or were annoyed by the noise (rs = 0.401, n = 1095, p < 0.001). More than 80% of the respondents in the sound intervals 37.5–40.0 dB(A) and > 40.0 dB(A) noticed sound at the dwelling (Figure 1).
The proportions of respondents who were annoyed also increased with increasing sound levels (Figure 2). Less than 10% were annoyed in the lower sound intervals. The proportion annoyed increased from 14% in the 37.5–40.0 dB(A) interval to 32% in the > 40.0 dB(A) interval. However, the uncertainty was large in the highest interval due to a low number of residents in that group.
Of those who were annoyed by wind turbine noise (n = 84), 85% reported that they were annoyed by the swishing character of the sound, 72% by the whistling, 57% by the resounding, and 55% by the pulsating/throbbing char acter. It was less common to be annoyed by the lapping, scratching, low fre quency or tonal character of the sound.
Figure 1. The proportion who noticed sound from wind turbines in relation to sound levels at the dwelling, with 95% confidence intervals (n = 1095)
0 10 20 30 40 50 60 70 80 90 100 <32.5 32.5-35.0 35.0-37.5 37.5-40.0 >40.0 dB(A) No tic ed w in d tu rb in e so un d, %
22
5.2 Situational factors influencing the
perception of wind turbine sound
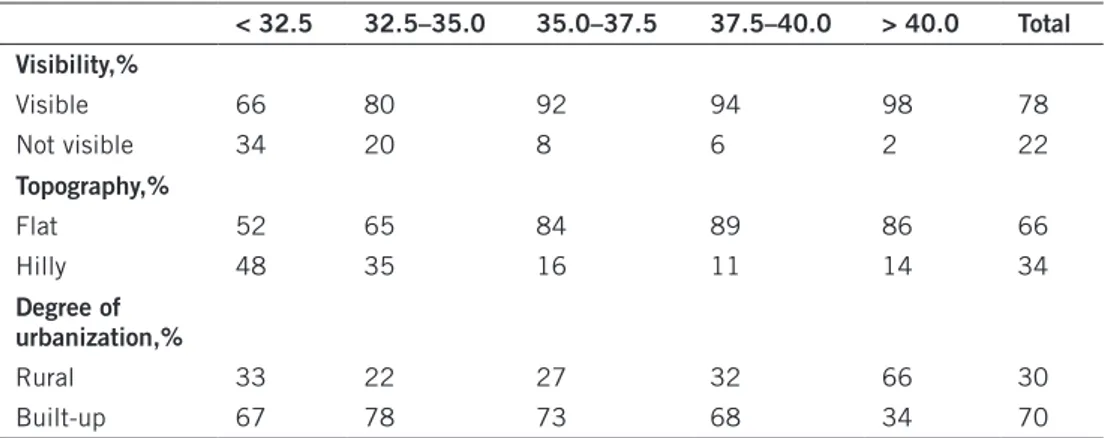
Of the respondents, 78% reported that they could see at least one wind tur bine from their dwelling (Table 4). The proportion increased with increasing sound level. Of those living in the areas with sound levels exceeding 35 dB(A), more than 90% could see at least one wind turbine from their dwelling. Of the respondents, 66% lived in areas with flat topography, rather than hilly ter rain. Furthermore, 30% lived in rural areas, as distinct from builtup areas.
The percentage of respondents who could see wind turbines and the per centage who lived in flat topography were not independent. Multiple logistic regression was therefore used to explore the influence of visibility, topography and degree of urbanization on the probability of noticing or being annoyed by wind turbine sound.
Table 4. Visibility, topography and degree of urbanization in relation to sound levels: proportion of respondents < 32.5 32.5–35.0 35.0–37.5 37.5–40.0 > 40.0 Total Visibility,% Visible 66 80 92 94 98 78 Not visible 34 20 8 6 2 22 Topography,% Flat 52 65 84 89 86 66 Hilly 48 35 16 11 14 34 degree of urbanization,% Rural 33 22 27 32 66 30 Built-up 67 78 73 68 34 70
Figure 2. The proportions of respondents who were rather or very annoyed by noise from wind tur-bines in relation to sound levels at the dwelling, with 95% confidence intervals (n = 1095)
0 10 20 30 40 50 60 70 80 90 100 <32.5 32.5-35.0 35.0-37.5 37.5-40.0 >40.0 dB(A) An no ye d by w in d tu rb in e so un d, %
The probability of noticing sound from wind turbines increased with increas ing sound levels (Table 5). The probability of hearing the sound was larger for respondents with wind turbines visible from their dwelling, and for those living in rural areas. Topography had no statistically significant influence on the probability of hearing wind turbine sound.
Table 5. relationship between the probability of hearing sound from wind turbines and visibility, topography and degree of urbanization, adjusted for sound level
notice sound from wind turbines Or 95% ci Sound level, 5 dB(A)-intervals 2.08 1.81–2.40 Visibility (do not see/see) 2.40 1.67–3.45 Topography (flat/hilly) 0.78 0.57–1.07 Urbanization (built-up/rural) 1.45 1.06–1.99
The probability of being rather or very annoyed by wind turbine noise also increased with increasing sound levels (Table 6). The probability was larger if the wind turbines were visible from the dwelling. Of the 82 respondents who reported that they were annoyed by noise from wind turbines, 81 could see at least one turbine from their dwelling. The extremely high correlation between annoyance and visibility gives misleading values; the value for visibility that is reported in Table 6 is largely exaggerated. The probability of annoyance was also larger in rural areas, while topography did not have any impact.
Table 6. relationship between annoyance with noise from wind turbines and visibility, topography and degree of urbanization, adjusted for sound level
Annoyed by sound from wind turbines Or 95% ci Sound level, 5 dB(A)-intervals 1.46 1.22–1.75 Visibility (do not see/see) 13.97* 1.90–102.83 Topography (flat/hilly) 0.99 0.53 –1.87 Urbanization (built-up/rural) 2.90 1.78 –4.74
*Exaggerated value due to the strong relationship between annoyance and visibility.
5.3 Individual factors related to perception of
wind turbine sound
The average age of the respondents was 50 years (standard deviation: 15 years), and 59% were women. No relationships between perception of sound and age or gender were found.
Of the respondents, 51% reported that they were sensitive or very sensitive to sound. A larger proportion of the women than the men were noise sensi tive: 54% of the women and 48% of the men (z = 3.04, n = 1072, p < 0.01). No relationship between noise sensitivity and noticing wind turbine sound was found. Respondents who reported that they were rather or very sensitive to sound did not notice wind turbine sound to a higher degree than those who
24
Table 7. relationship between noticing sound from wind turbines and noise sensitivity, adjusted for sound level
notice sound from wind turbines Or 95% ci Sound level, 5 dB(A)-intervals 2.29 2.00–2.62 Noise sensitivity*
(4-point scale from ””not at all sensitive” to ”very sensitive”) 1.15 0.99–1.34
*Also adjusted for gender.
Respondents who were noise sensitive were, however, more often annoyed by wind turbine noise than those who were not when the sound was at the same sound level (Table 8).
Table 8. relationship between annoyance with noise from wind turbines and noise sensitivity adjusted for sound level.
Annoyed by sound from wind turbines Or 95% ci Sound level, 5 dB(A)-intervals 1.70 1.42–2.04 Noise sensitivity*
(4-point scale from ”not at all sensitive” to ”very sensitive”) 1.73 1.32–2.27 *Also adjusted for gender.
Of the respondents 10% reported that they were negative or very negative to wind turbines and 24% that they were negative to the impact of wind turbines on the landscape. A relationship between the two attitude variables was found (rs = 0.603, n = 1070, p < 0.001): people who were negative to wind turbines in general were also negative to the impact of wind turbines on the landscape. There were, however, a group of respondents who were not negative to wind turbines in general, but were negative to their impact on the landscape (15%).
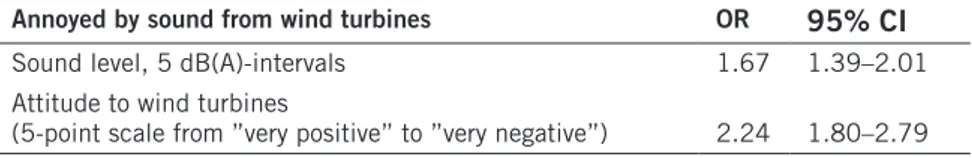
No relationships were found between sound levels measured at the dwell ing and attitude to wind turbines (rs = 0.005, n = 1083, p = 0.869), and atti tude to the impact on the landscape (rs = 0.023, n = 1079, p = 0.445). People who lived closer to the wind turbines were not more negative than people who lived further away. Attitude and annoyance were, however, positively related. Respondents who were annoyed by noise from wind turbines were more often negative towards the turbines than those who were not annoyed, regardless of sound levels (Table 9). It is not possible to conclude from this crosssectional study whether those who were annoyed by the noise became negative to wind turbines, or if those who were negative from the beginning were more likely to be annoyed. All that can be said is that there was a relationship between these variables.
Table 9. relationship between annoyance with sound from wind turbines and attitude, adjusted for sound level
Annoyed by sound from wind turbines Or 95% ci
Sound level, 5 dB(A)-intervals 1.67 1.39–2.01 Attitude to wind turbines
Respondents who were annoyed by the noise were also more often negative about the impact of wind turbines on the landscape than those who were not annoyed (Table 10). Again, it is not possible to draw any conclusions regarding cause and effect.
Table 10. relationship between annoyance with sound from wind turbines and visual attitude adjusted for sound level
Annoyed by sound from wind turbines Or 95% ci Sound level, 5 dB(A)-intervals 1.53 1.25–1.88 Attitude to the impact of wind turbines on the landscape
(5-point scale from ”very positive” to ”very negative”) 5.24 3.86–7.10
“Environmentally friendly” (80%), “necessary” (42%), “efficient” (33%) and “ugly” (31%) were the most common classifications chosen by the respond ents out of fourteen suggested classifications.
5.4 Multivariate analyses of influencing factors
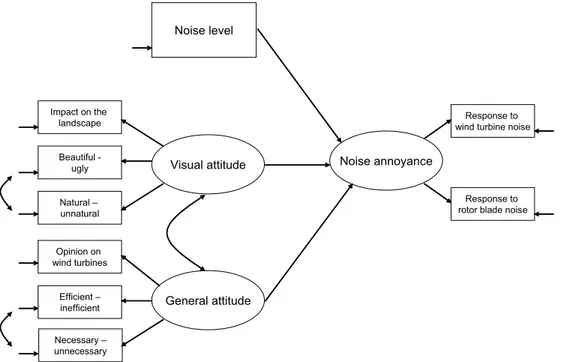
A theoretical moel comprising both latent (not directly measurable) and meas ured variables was developed to explore how the visual impact of wind turbines influenced noise annoyance (Figure 3).Figure 3. Theoretical model describing how the visual and general attitudes to wind turbines influence the risk of annoyance by sound from wind turbines
Visual attitude Noise annoyance
General attitude Noise level Impact on the landscape Beautiful -ugly Natural – unnatural Opinion on wind turbines Efficient – inefficient Necessary – unnecessary Response to rotor blade noise
Response to wind turbine noise
26
Noise annoyance was assumed to depend on sound level as well as on the respondent’s attitude to the visual impact of the wind turbines and the gen eral attitude. Perception of sound (i.e. whether the respondent noticed or was annoyed by sound from wind turbines, as well as by the perception of sound from the rotor blades) was used as a measure of noise annoyance. Visual atti tude was gauged with the question about the impact of wind turbines on the landscape and the classification of wind turbines as beautiful or ugly, and as natural or unnatural. General attitude was measured using the question about the respondent’s opinion of wind turbines, and the classification of wind tur bines as effective or non effective, and necessary or unnecessary.
The model was tested among respondents who could see wind turbines from their dwelling and, for comparison, among those who could not. Furthermore, respondents living in flat terrain were compared with those living in hilly ter rain, and respondents in builtup areas were compared with those in rural areas (Figure 4). The probability of annoyance increased with increasing sound levels in all groups. There was a difference between those who saw wind turbines and those who did not. A larger part of the variation in response (i.e. annoyance) was explained by sound levels among those who could see wind turbines than among those who could not. The general attitude to wind turbines did not influ ence annoyance due to wind turbine sound in any of the groups. There was, however, a relationship between the visual attitude and noise annoyance among several groups. The relationship was stronger among those who saw wind tur bines from their dwelling than among those who did not. The relationship was also stronger among respondents who lived in a flat topography in comparison to those who lived in a hilly terrain, in which the relationship was not statisti cally significant. The difference was small between those living in builtup areas and those in rural areas.
The model fitted data for all groups (normed X2 ≤ 2.8; CFI ≥ 0.99;
Figure 4. Comparisons between respondents who could see wind turbines and those who could not (first row), those living in flat and hilly topography (second row), and those in built-up and rural areas (last row). Unbroken lines indicate statistically significant relationships, with the standardized regres-sion weight shown; dashed lines indicate that no statistically significant relationship was found.
Visual attitude Noise annoyance
General attitude Noise level 0.11 0.61 0.69 Wind turbines visible, n = 843
Visual attitude Noise annoyance
General attitude Noise level 0.05 0.48 Wind turbines not visible, n = 237 0.29
Visual attitude Noise annoyance
General attitude Noise level 0.10 0.72 0.70 Flat terrain n = 720
Visual attitude Noise annoyance
General attitude
Noise level 0.13
0.52
Hilly/rocky terrain n = 375
Visual attitude Noise annoyance
General attitude Noise level 0.12 0.57 Built-up area n = 764 0.56
Visual attitude Noise annoyance
General attitude Noise level 0.11 0.79 Rural area n = 331 0.59
28
5.5 The impact of wind turbine sound on health
and well-being
The association between wind turbine sound and selfreported health and well being, other than the risk of annoyance, was further explored. Health is influ enced by age and sex, and all analyses were therefore adjusted for these two parameters. No relationships were found between levels of wind turbines sound and selfreported health symptoms or diseases that were measured in the ques tionnaire (longterm disease; diabetes; hypertension; tinnitus; cardiovascular dis ease; impaired hearing). Also no relationships were found between sound levels and decreased wellbeing or stress symptoms (headache; undue tiredness; pain in neck, shoulders or joints; tense and stressed; irritated).
Of the respondents 25% reported that their sleep lately had not been so good, bad or very bad. There was no relationship between sleep quality and the levels of wind turbine sound. There was, however, an association between being disturbed by noise from any source (no/yes) and sound levels (OR = 1.16; 95% CI: 1.00–1.34; adjusted for age and sex; sound levels in 5 dB(A)intervals). Respondents in the group > 40 dB(A) were more often annoyed by any noise source than other respondents (Table 11).
Table 11. Proportion of respondents who reported that their sleep was interrupted by any source of noise
< 32.5 n = 441
32.5–35.0
n = 328 35.0–37.5 n = 168 37.5–40.0n = 106 > 40.0n = 44 Interrupted sleep by any
noise source 12% 16% 14% 15% 25%
5.6 Relationship between annoyance due to sound
from wind turbines and health and well-being
Longterm disease was not related to annoyance due to sound from wind turbines when sound levels, age and sex were taken into account. The same applied to dia betes, high blood pressure, tinnitus, cardiovascular disease or impaired hearing.People who were tense or stressed more than once a week were more often annoyed by sound from wind turbines than others (OR = 1.17; 95% CI: 1.01– 1.34; adjusted for sound levels, age and sex). No relationship was found between annoyance and the symptoms headache, undue tiredness, or pain in neck, shoul ders and joints.
The association between sleep quality and annoyance due to wind turbine sound was statistically significantly (OR = 1.33; 95% CI: 1.03–1.71; adjusted for sound levels, age and sex). People who perceived their sleep as bad (on a 5point scale from “very good” to “very bad”) more often reported that they were annoyed by wind turbine sound. Also, people who were disturbed in their sleep by any source of noise were more often annoyed by the sound (OR = 2.06; 95% CI: 1.75–2.41; adjusted for sound levels, age and sex).
6 How often the sound from wind
turbines is heard
In total 24 people filled in diaries that showed how often they heard sound from wind turbines. All participants were living permanently at their dwellings (no summer houses). The average age was 52 (26–77 years age) and 21 were women. Most of the participants could see one or more wind turbines from their dwell ing or garden; only 3 participants did not see any. There were large differences in the habits of the participants. The participants spent between 52% and 95% of the study time at home (average 76%). There were also large differences in how much time they spent outdoors. The participants were outdoors an average of 59 measured occasions. One participant was only outdoors 10 times, while another spent time outdoors 140 times.
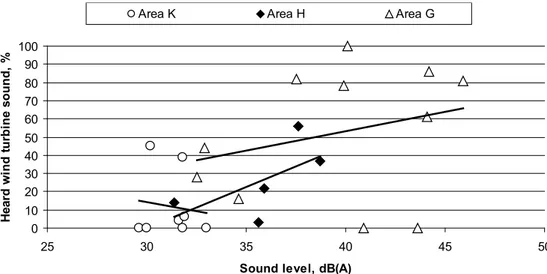
Four participants never heard the wind turbine during the three weeks of the study. The calculated levels of wind turbine sound for these participants were < 33.0 dB(A). One participant, at a dwelling with a calculated sound level of 40.1 dB(A) always heard the wind turbine when outdoors. For the rest of the participants, the percentage of occasions when the wind turbine was heard when outdoors varied between 14% and 56% in Area H, between 16% and 86% in Area G, and between 4% and 45% in Area K. The regression lines in Figure 5 show the relationship between how often the wind turbine was heard when outdoors and the calculated sound levels for each area.
Figure 5. Relationship between calculated sound levels and percentage of outdoor occasions when the wind turbine was heard, shown for each study area
0 10 20 30 40 50 60 70 80 90 100 25 30 35 40 45 50
Sound level, dB(A)
He ar d w in d tu rb in e so un d, %
30
The relationship between calculated sound levels and the percentage of occur rences when the wind turbine was heard outdoors was statistically significant when all participants were analysed in one simultaneous regression (r = 0.564, n = 24, p < 0.01). Figure 6 shows the relationship as a linear regression. The linear regression fitted the data better than a logistic function. The line can, however, not be generalized for other sound levels and other situations.
Figure 6. Relationship between calculated sound levels and percentage of outdoor occurrences when the wind turbines were heard
y = 3.6987x - 99.935 R2 = 0.3186 0 10 20 30 40 50 60 70 80 90 100 25 30 35 40 45 50
Sound level, dB(A)
He ar d w in d tu rb in e so un d, %
The times when the wind turbine sound was heard were compared with the instantaneous performance of the wind turbine (i.e. the electrical power, tur bine speed and the wind speed at hub height) in the two areas for which these data were available. For eight of the nine participants who heard sound from wind turbines at least once during the study period, the average values for elec trical power, turbine speed and wind speed were higher when the wind turbine was heard than when it was not (Table 12). The differences were, however, only statistically significant for four of the participants.
Table 12. mean differences of electrical power, turbine speed and wind speed in situations when the wind turbine was not heard and when it was heard; data from the closest wind turbine for participants in Area k
Participant not heard heard difference p-value Power (kw) H 1 68 137 69 < 0.01 H 2 71 1 -70 0.456 H 3 68 126 58 < 0.05 H 4 61 190 130 < 0.001 H 5 68 151 83 < 0.001 K 2 247 293 46 0.729 K 3 204 265 61 0.117 K 4 190 209 19 0.659 K 8 218 455 237 0.123 Turbine speed (rpm) H 1 19.8 23.9 4.1 < 0.05 H 2 20.0 13.9 -6.1 0.293 H 3 20.0 23.9 4.2 < 0.01 H 4 19.4 25.7 6.3 < 0.001 H 5 19.8 24.0 4.2 < 0.05 K 2 12.8 14.7 1.9 0.354 K 3 12.6 13.2 0.7 0.291 K 4 11.7 12.7 1.1 0.234 K 8 12.7 16.5 3.8 0.139 Wind speed (m/s) H 1 4.79 6.08 1.29 < 0.05 H 2 4.84 2.60 -2.24 0.251 H 3 4.79 6.06 1.27 < 0.05 H 4 4.67 6.92 2.25 < 0.001 H 5 4.80 6.06 1.26 < 0.05 K 2 5.69 6.83 1.13 0.333 K 3 5.48 5.99 0.51 0.142 K 4 4.82 5.04 0.21 0.595 K 8 5.55 7.85 2.30 0.141
32
Data was also coanalysed to explore whether there were any general statis tical differences in electrical power, turbine speed and wind speed between times when the wind turbines were heard and when they were not. Average differences of the three variables were calculated for the nine participants who heard wind turbine sound at least once during the study period. The difference in electrical power between occurrences when the sound was heard and when it was not was 70 kW. The difference was statistically significant (Table 13). No statistically significant differences were found for the other two variables.
Table 13. Average differences in power, turbine speed and wind speed for the nine participants in Area h and Area k who heard wind turbines at least once during the study period
Average
differences t degrees of freedom p-value
Power (kW) 70 2.54 8 < 0.05
Turbine speed (rpm) 2.2 1.87 8 0.098
Wind speed (m/s) 0.89 1.96 8 0.086
An interesting question is at what wind speeds the wind turbines were heard. It could be hypothesized that the wind turbines would not be heard at low wind speeds when the emission sound levels are low, and also not at high wind speeds when other windinduced sounds (e.g. from trees), would mask the wind tur bine sound. Thus the highest probability of hearing wind turbine sound would be at medium wind speeds. However, no such pattern was found. For four of the participants the probability of hearing the sound was statistically signifi cant larger when the wind speed was more than 5 m/s than when there was less wind. It was not possible to find a similar value for the other participants.
There was also no relationship between wind direction and audibility. No increased probability of hearing the sound was found for the situation when the wind was blowing from the wind turbine towards the dwelling (± 45°) than for other situations.
7 Sound propagation
Immission sound levels were measured at a distance of 500 m from the wind turbine, with the other wind turbine approximately 300 m further away. The ten oneminute long sound signals recorded during a 10minute period every hour were analysed to Aweighted sound pressure levels. The median sound pressure level for each 10minute period was plotted as a function of wind speed at 10 m height. The wind speed at 10 m height was calculated based on the measured wind speed at hub height (65 m) obtained from the operational data of the wind turbine for the same time period. The relationship between the calculated wind speed at 10 m height and the measured wind speed at hub height was based on data from the emission measurements and derived by linear regression. The wind speed at hub height was used instead of the meas urement of wind speed at 10 m height, as the immission sound level mainly is determined by the sound pressure level at the source (i.e. the interaction of the wind turbine and the wind speed at the turbine).
A summary of the results for the downwind situation (wind direction within ± 45° from the direction from source to receiver) is presented below. The meas urements have been adjusted for the estimated influence of the other wind tur bine (1.5 dB(A)) and the wind screen insertion loss (1 dB(A)). The 1minute periods that contained sound from disturbing sources were excluded after listen ing to the sound signals. Recordings from situations with wind speeds less than 5 m/s generally had weak signals from the wind turbine compared to disturbing sources and were therefore not included. The measured sound levels were not adjusted for background sound levels (measured during the emission measure ments – see section 4.4) as these levels were too high compared to the results from the immission measurements (i.e. immission data were not 3 db(A) above the background sound levels as measured during the emission measurements). This was possibly due to less windinduced noise for the immission measure ments when the microphone was attached to a vertical board than during the emission measurements carried out with a board on the ground.
The measured Aweighted sound pressure levels are shown in Figure 7, together with the calculated levels. The measured levels are also grouped into integer wind speeds showing the average value with an unfilled dot, and the standard deviation as bars.
The agreement between measured and calculated data was good for wind speeds between 5 and 12 m/s. The differences between measured and calculated sound levels were within the statistical margin of error. The rather large disper sion around the average sound level shows that the sound from wind turbines can vary strongly in intensity at the same wind speed. Also, it was found by listening to the sound signals that the wind turbine was heard at relatively high wind speeds, up to 12 m/s. The signals were reviewed with headphones indoors, and therefore differed from an outdoor situation in which disturbing wind noise around the head and ears would interfere with the perception of sound.
34
A comparison of calculated immission levels in accordance with the sound propagation model proposed by Swedish Environmental Protection Agency [2001] and those calculated with the PE method showed that the differences were small and not statistically significant. The high position of the sound source (the wind turbine) and the rather short distance (550 m) compared to the source height means that the influence of meteorological variations on sound propagation only marginally changes the Aweighted sound pressure. Therefore in cases with short distances and no complications, wind turbine sound levels can be calculated with simplified models with satisfactory accuracy.
The measurements at 550 m from the wind turbine showed a larger vari ation in sound level within one wind speed than predicted by the advanced sound propagation model (PE method), even when variations in refraction during the propagation were taken into account. The variations of sound level are possibly due to variation in sound pressure levels at the source (i.e. the emission levels from the wind turbine may be varying).
Figure 7. Measured and calculated immission levels for downwind conditions vs. wind speed at 10 m height at the wind turbine
8 Discussion and conclusions
The combined analyses of the two epidemiological studies carried out at the Department of Occupational and Environmental Medicine confirm and strengthen previously reported data. Audibility as well as annoyance increases with increasing levels of wind turbine sound. The analyses also show that the risk of annoyance is higher if the wind turbines are visible from the dwelling. The risk of annoyance was also higher in rural areas compared to builtup areas, whereas the topography did not have any influence. The results are in agreement with those reported from a case study in Gotland, Sweden [Widing et al. 2005]. The percentage of those annoyed in a rural landscape corresponds with the percentage of those annoyed in the Gotland study within each sound level interval.The only healthrelated variable other than annoyance that was directly related to levels of wind turbine sound was sleep. Sleep disturbance due to wind turbine sound may mainly be a problem for people who sleep with their windows open. This suggestion was verified by all but two of the respondents who were disturbed by noise in their sleep; they all slept with the window open or ajar. Sleeping with open windows is common. Our studies indicate that approximately threequarters of people in rural areas sleep with the window ajar in the summer and 18% in the winter [Pedersen and Persson Waye 2004]. However, more knowledge is needed to judge whether sleep disturbance is a problem that has to be taken into account in future planning for wind farms.
The use of diaries is relatively sparsely reported in the scientific literature, but was found to be useful in this case. The statistically significant relation ship between audibility and sound levels as well as the differences in audibil ity related to electrical power production at the wind turbine validates the method. The percentage of outdoor occasions when the wind turbines was heard varied from 4% to 86% and was, as previously described, statistically significantly related to sound levels. The diary study also showed that there are large differences between individuals when it comes to how much time they are at home and how often they spend time outdoors; a variation that may to some extent explain the variation in annoyance found in epidemiological studies among respondents in the same exposure groups.
It was possible to carry out adequate field measurements of wind turbine sound (immission measurements) because the mobile measurement station could be moved to different locations to record sound for several weeks at a time under different meteorological conditions. We were able to acquire operational data for the wind turbines at all except one site due to good col laboration with the manufacturers and owners of the wind turbines. It was not possible to correct the immission data for background sound levels since the background sound levels were too high. This means that the actual levels of wind turbine sound at 550 m distance could be somewhat lower than those measured. However, the measurements are in agreement with the calculated values, indicating that the handling of the background data is a minor error.
36
The hypothesis that the PE method should give a better prediction of meas ured values than the Swedish Environmental Protection Agency model [2001] was not verified. The hypothesis was based on the assumption that a focus effect appears in downwind propagation. This focusing could be described using a ray model. In a homogenous atmosphere with flat ground, the sound propagation follows two ray paths from the source to the receiver; one direct and one reflecting from the ground. The downwind sound will refract down towards the ground, and thus a ray could be reflected two or more times if the wind is sufficiently strong. The sound from these multiple reflected rays will be added to the direct sound and to the first ground reflection. Calculations with the PE method show, however, that the influence of the wind on the sound propagation is small and that simplified methods can be used to predict equivalent sound levels from wind turbines at short distances, here 550 m. Significant focussing at downwind conditions can only be expected for longer distances. Focussing due to a stable atmosphere when the air temperature increases with increasing height over the ground (instead of decreasing, which is the most common situation) can also lead to increased refraction. The focussing due to an inverse temperature gradient is assumed to be less than that from the wind for wind turbine sound, and is consequently only a factor at long distances.
The uncertainty at the source (i.e. the emission level) is the main factor influencing the uncertainty in the calculations of sound levels at the receiver (i.e. immission levels). Measurements in accordance with the standard could lead to errors in the measurement values since the turbine speed does not instantly adjust to the wind speed. The wind speed profile (i.e. how much the wind speed increases with height) may also diverge from the assumed profile, which influences the transformation of the measured values to the standard situation of 8 m/s at 10 m height. Furthermore, in order to use the emission levels provided by the manufacturer, the measured wind turbine must not deviate from the type for which emission levels were provided.
The large variation in measured sound levels at one and the same wind speed could imply that people are at times exposed to higher sound levels than those calculated for the standard 8 m/s wind speed. The results also indicate that it is possible to hear the sound even at higher wind speeds. By listening to the sound signals, it was found that the wind turbine sound could be heard at least up to 12 m/s. Even though the situation was not totally comparable to a real situation (the recordings with the microphone were attenuated with two wind screens, and the wind around the hearer’s ears in a real situation would generate sound than would influence the possibility of hearing the wind tur bine sound), it is plausible that sound from wind turbines could be heard in some situations at higher wind speeds. The results from the diary study point in the same direction. Previous assumptions that sound from wind turbines is most easily perceived at wind speeds from 5 to 8 m/s were thus not con firmed. On the contrary, the risk of hearing sound from wind turbines seems
to increase from about 5 m/s and no decrease was observed at wind speeds up to 10–12 m/s. The results should be interpreted with caution due to the low number of participants, but they indicate that situations other 8 m/s need to be considered in descriptions of sound exposure.
In summary, our studies show that the possibility of hearing and the risk of being annoyed by sound from wind turbines increases with increasing sound levels. No direct adverse health effects were associated with the sound, though the risk of sleep disturbance need to be further explored. The sound propagation model used in the environmental permit proceedings before erect ing a new wind farm predicts the sound levels well. However, the variation in source sound levels (emission levels) as well as the possibility of hearing the sound at high wind speeds shows that the standards for environmental impact assessment for sound exposure of nearby residents need to be increased.
38
9 References
Altman, D.G., Machin, D., Bryant, T.N., Gardner, M.J. (2000). Statistics with Confidence, 2nd ed. London: BMJ Books.
Babisch, W., Beule, B., Schust, M., Kersten, N., Ising, H. (2005). Traffic noise and risk of myocardial infarction. Epidemiology, 16, 33–40.
Bengtsson, J., Persson Waye, K., Kjellberg, A. (2004). Sound characteristics in low frequency noise and their relevance for the perception of pleasantness. Acta Acoustica, 90, 171–180.
Bradley, J.S. (1994). Annoyance caused by constantamplitude and
amplitudemodulated sound containing rumble. Noise Control Engineering Journal, 42, 203–208.
Calvert, G.A. (2001). Crossmodal processing in the human brain: Insights from functional neuroimaging studies. Cerebral Cortex, 11, 1100–1123. IEC (2002). International Electrotechnical Commission: IEC 61400-11: Wind turbine generator systems – Part 11: Acoustic noise measurement techniques, 2nd edition.
Naturvårdsverket (2001). Ljud från vindkraftverk. Rapport nr 6241. Stockholm, Sverige.
Pedersen, E., Persson Waye, K. (2004). Perception and annoyance due to wind turbine noise: a doseresponse relationship. Journal of the Acoustical Society of America, 116, 3460–470.
Pedersen, E., Persson Waye, K. (2007). Wind turbine noise, annoyance and selfreported health and wellbeing in different living environments.
Occupational and Environmental Medicine, 64, 480–486.
Pedersen, E., Larsman, P. (2008). The impact of visual factors on noise annoyance among people living in the vicinity of wind turbines. Journal of Environmental Psychology, 2008, 28, 379–389.
Persson Waye, K., Öhrström, E. (2002). Psychoacoustic characters of relevance for annoyance of wind turbine noise. Journal of Sound and Vibration, 250, 65–73.
Van den Berg, G.P. (2006). The sound of high winds: The effect of
atmospheric stability on wind turbine sound and microphone noise. Doctoral thesis. Groningen, The Netherlands; Rijksuniversiteit Groningen.
Widing, A., Britse, G., Wizelius, T. (2005). Vindkraftens miljöpåverkan, fallstudie av vindkraftverk i boendemiljö. Centrum för Vindkraftsinformation vid Högskolan på Gotland.