&? Optimisationof therailwal.
alignment using dynamic
vehicle models
Paper presented at VSDIA 98, 6th Mini Conference
on Vehicle System Dynamics, Identification
and Anomalies, 9 11 November 1998,
Technical University of Budapest, Hungary
oo m c» H m Ooo
x 0 >= :. uid h 33 0)Björn Kufver
Swedish National Road and
,Transport Research Institute
VTI särtryck 309 - 1998
Optimisation of the railway
alignment using dynamic
vehicle models
Paper presented at VSDIA 98, 6th Mini Conference
on Vehicle System Dynamics, Identification
and Anomalies, 9 11 November 1998,
Technical University of Budapest, Hungary
Björn Kufver
gwgäigå 5533; lä mm? Cover: VTI. A Eurofima standard coach
OPTIMISATION OF THE RAILWAY ALIGNMENT
USING DYNAMIC VEHICLE MODELS
Björn KUFVER
VTI Railway Systems SE-581 95 Linköping, Sweden
Received: November 11, 1998
ABSTRACT
The alignment of new railways should be designed to meet future demands, but an unnecessarily high standard may make projects too expensive and may cause an undesirable impact on the environment. Therefore, the alignment should be optimised with great care when building new lines and when renewing existing ones. In this paper, the choice of cant on a predefined alignment and the choice of alignment in a predefined terrain corridor are discussed.
Comparisons of track geometries are based on vehicle reactions. A power car, a tilting coach and a non-tilting coach have been studied. Vehicle reactions have been simulated with the dynamic vehicle/track computer code GENSYS.
Vertical wheel/rail forces, guiding forces, track shift forces and wheel/rail climbing ratios have been used in boundary conditions. Passenger comfort on curve transitions (PCT) has been used as object function. It was found that the following conditions favour longer transition curves:
large angles between adjacent straight lines,
obstacles in the middle of the curves (rather than near the ends), and low roll coefficients of the vehicles and body tilt systems
even though the radii must be reduced when transition lengths are increased.
Keywords: alignment, cant, transition curve, terrain corridor, vehicle reactions, passenger comfort.
1. INTRODUCTION
The alignment of a railway has a high degree of permanence. When the alignment is altered, technical subsystems, such as superstructure, substructure, catenary systems etc., must be altered as well. Hence, changes in alignment are normally associated with high costs. This indicates that the alignment of new railways should be designed to meet future demands. However, an unnecessarily high standard may make a project too expensive and cause an undesirable impact on the environment. These facts lead to the conclusion that the alignment should be optimised with great care not only when building new lines but also when renewing existing ones.
2. PRINCIPLES OF EVALUATION
The investigation concerning alignment has been based on the following principles [l].
Alignment alternatives that are equally costly to build and those which are not must be separated. If alternatives with different construction costs are to be compared, the best alignment alternative on each cost level should be used in such comparisons.
The comparisons should be based on vehicle reactions. Since full-scale tests with different alignment alternatives are too costly to perform, the vehicle reactions must be estimated through simulations.
The results from a simulation program should be dealt with as results from full scale tests as closely as is relevant and possible. In order to enable ranking of different alignments, contradictory objectives should be taken into consideration in a one dimensional object function where possible.
3. HIERARCHY IN COMPARISONS OF TRACK GEOMETRIES The comparisons of track geometries are organised in the following hierarchy:
1. On the lowest level, predefined alignment alternatives are evaluated with different cant.
2. On an intermediate level, alignment alternatives with the same construction cost should be compared. Each such alignment alternative should be evaluated with its best cant, according to Level 1.
3. On the highest level, alignments associated with different construction costs should be compared. Each cost level should be evaluated with its best alignment alternative, according to Level 2.
Hence, there is a need to define a concept of equally costly alignment alternatives. Here, all alignment alternatives that pass the same set of obstacles (with at least the predefined clearance) are assumed to be equally costly to build. If an obstacle has to be removed, the construction cost will be significantly higher.
The concept will here be applied to single horizontal curves, where the direction and position of the adjacent straight lines are fixed. The two transition curves are assumed to have the same lengths Lt. Hence, independent variables are the curve radius R and the lengths of the adjacent transition curves Lt. (It should be noted that the element combinations and the assumptions made here correspond to the most frequent case in a design process.)
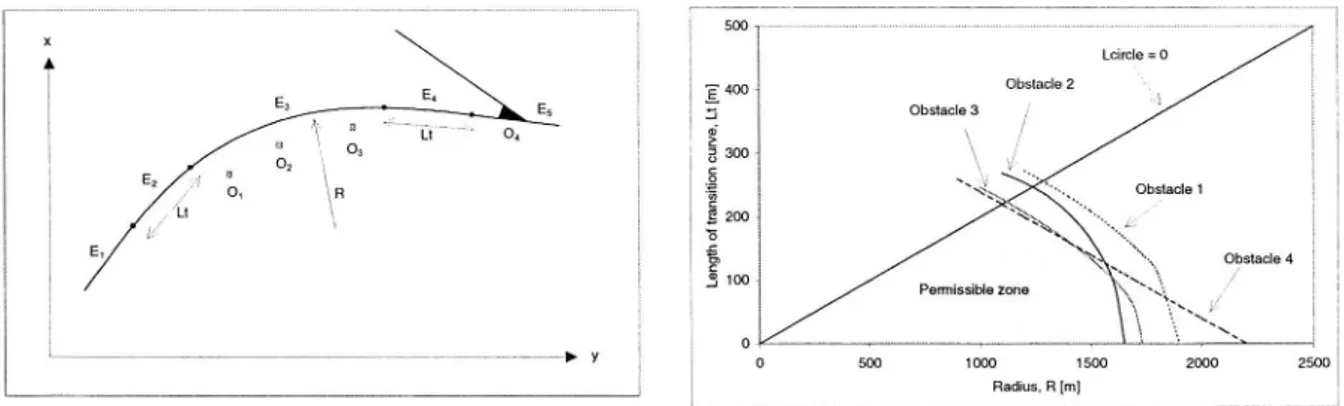
Figure l illustrates the concept of equally costly alignment alternatives.
Lcircle = 0 Obstacle 2 Obstacle 3 % it
5
x ,\l " _ *Qh Obstacle 1 ("=-.x . , NÄK "i.\ % Le ng th of tr an si ti on cu rv e, Lt [m ] NN & Obstacle 4 8 Permissible Zone "XX N;;/ O r V o 500 1000 1500 2000 2500 f Radius, R [m]The element chain El-E5 should pass the obstacles 01-03 with a predefined clearance. The obstacle 04 is a turnout which should remain on the straight line E5. Each obstacle generates an inequality in the R-Lt plane. The permissible zone is the equally costly zone where all obstacles may be left in place. The best alignment alternative may be expected to be found at the border defined by the obstacles, since an R-Lt combination within the zone may be improved by larger radius, longer transition curves, or a combination of these. Therefore, when considering obstacles along the route, con icts occur on single curves between the desire for large radii and long transition curves [1], [2], [3], [4].
Even though certain obstacles are removed, the conflict between radius and transition lengths remains. At any level of construction cost, longer transition curves on single curves result in smaller curve radii.
The hierarchy when analysing alignments may be used in other cases than the single curves. Other cases are the comparisons of different types of transition curves and different types of crossover geometry [5].
4. TRACK AND VEHICLE MODELS 4.1 The GENSYS model
It has been concluded that different alignment alternatives should be evaluated with simulated vehicle reactions taken into consideration [1]. In this study, the multibody computer code GENSYS was used to simulate vehicle reactions for three types of vehicles.
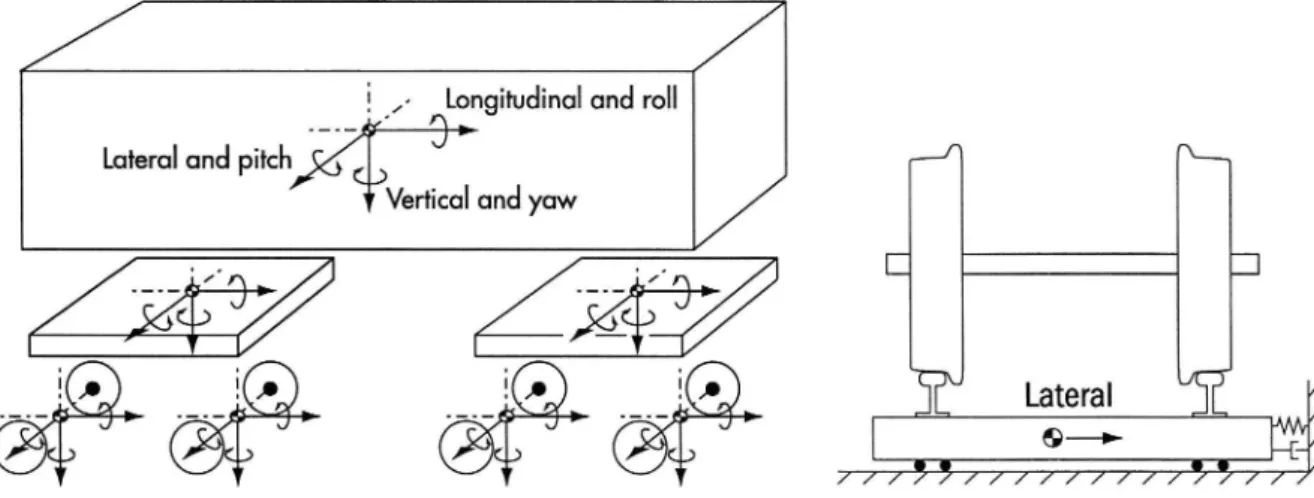
Vehicle bodies, bogies and wheelsets were modelled as rigid bodies, each of which has six degrees of freedom (see Figure 2). The track was modelled as a rigid body connected to each wheelset, each body having one degree of freedom: lateral displacement. Totally, the models contain 46 degrees of freedom for each vehicle.
i ,» Longitudinol and roll
Loteroloncl pitch % | -/] M
Vertical and yaw
___! ___! ___! ___! iu Lateral USE
up a»
/ / / / / / / //// // /
Fig. 2. Degrees of freedom of the vehicle models (left) and track models (right).
Since springs and dampers in the models are non-linear, the simulations were conducted in the time domain.
Between each track body and the ground, there is a spring parallel to a damper (see Figure 2). Further track exibility is modelled with parallel springs and dampers in the wheel/rail contact areas.
4.2 The vehicles
It was decided that the study should include a conventional (non-tilting) coach, a tilting coach, and a suitable high-speed locomotive. Hence, models of the Eurofima coach (a conventional passenger coach used by several railway companies in Europe), the SJ X2 tilting coach and the SJ X2 power car were used.
Vehicle data for the Eurofima coach and certain vehicle data for the X2 vehicle are published in [1]. In this study, the tilt system of the SJ X2 tilting coach was programmed to tilt proportionally to the lateral acceleration in the track plane at the leading bogie, with a factor of 0.08 rad per Ill/S2. Considering the de ections in the primary and secondary suspensions, the effective roll factor fr (defined as lateral acceleration in the vehicle divided by the lateral acceleration in the track plane) is 0.28. The net roll factor f,. for the Eurofima coach is 1.22, corresponding to a roll coefficient of 0.22.
5. VARIABLES AND CRITERIA
It was decided to quantify the same variables when evaluating alignments as when evaluating vehicles with respect to track/vehicle interaction [6]. It was also found reasonable to use the same filtering, the same statistical evaluation and the same limits whenever possible and relevant.
5.1 Wheel/rail forces and associated quantities
UIC 518 OR [7] and CEN TC 256 WG 10 [8] are currently working on evaluation of track/vehicle interaction and have issued draft standards suggesting evaluation of vertical wheel/rail forces, guiding (lateral wheel/rail) forces, track shift forces and wheel climbing ratios.
The following recommended limits from the draft UIC standard [7] were applied in this study:
Vertical wheel/rail forces (99.85-percentiles): 170 kN
Track shift forces (99.85-percentiles): 10 kN + static axle load/3 Wheel climbing ratio (99.85 percentiles): 0.8
Both UIC [7] and CEN [8] suggest that only median values of guiding forces be evaluated. However, it was found unclear what median values represent the sections where radii change (with or without transition curves). Hence, a provisional Swedish limit of 45 kN (from the acquisition of the X2 trainsets) was used for the 99.85-percentiles of the guiding forces, representing a much more restrictive limit than the international suggested limit of 60 kN for the median values.
All these variables were filtered in two different ways: using a low-pass filter with a 3 dB cut off frequency of 30 Hz according to UIC [7] and CEN [8], and a 3 dB cut-off frequency of 90 Hz according to Swedish procedures, respectively. When there are no track irregularities superimposed on the designed track geometry, there are no interesting differences between the results from the two different low-pass filters. However, when track irregularities are superimposed, the results from the two low-pass filters differ significantly. Further low-low-pass filtering was conducted for track shift forces and wheel/rail climbing ratios, using a rectangular 2-metre averaging window.
Wheel and rail wear rates were quantified using the energy dissipation in the contact patches. Since the track was in focus in this study, the energy dissipations were added
at the left and right wheels, respectively. The two resulting signals were low-pass filtered, using a rectangular 2 metre averaging window, and monitored. No generally accepted limit has been found in the literature.
However, for high speed railways, it was considered that in most cases it is not of crucial importance to reduce these variables to absolute minima. Instead, passenger comfort was used as the object function, in order to minimise the comfort disturbances when passing the curve at a relatively high speed.
5.2 Passenger comfort
The literature contains many suggestions on how to quantify passenger comfort as a function of vehicle motions [9]. When implementing these in practice, the desire for low magnitudes of several variables will be contradictory. Hence, it was decided to quantify passenger comfort at the most aggregated level possible. In high speed curving, the most relevant aggregated comfort functions are Passenger Comfort on Curve Transitions (PCT), since they take into consideration low frequency lateral acceleration, lateral jerk and roll velocity of the vehicle body.
There is one PCT function for standing passengers:
PCT = max(2.80' y + 2.03 - ') 11.1,0) + 0.185 - (1502-283
(1)
where j? : maximum absolute value of low-pass filtered lateral
acceleration of the vehicle body, expressed in per cent of g
'y : maximum absolute value of low-pass filtered lateral jerk of
the vehicle body, expressed in per cent of g per second 19 : maximum absolute value of low-pass filtered roll velocity
of the vehicle body, expressed in degrees per second g = gravitational acceleration
and another for seated passengers:
PCT = max(0.88- y + 0.95 - y 5.9.0) + 0120 - (1501-626
(2)
The functions show the percentage of passengers who regard the instantaneous lateral ride as very uncomfortable or uncomfortable on a five-level scale [10]. The functions were derived by British Rail Research from extensive tests with passengers in tilting and non tilting coaches on the clothoid type of transition curves. Even though railway passengers in different countries may have different requirements on comfort, it is believed that the PCT functions may be used in relative comparisons between track geometries.
According to [11], the lateral acceleration and roll velocity should be low pass filtered with a 3 dB cut off frequency of 2 Hz and a filter gradient of 3 dB/octave. The signals should also be averaged with a rectangular 1-second window. The lateral jerk is low pass filtered further, since it is defined as change in lateral acceleration during 1 second. This far-reaching low pass filtering of the lateral jerk may cause underestimation of passenger discomfort in very short transitions.
An aspect of passenger discomfort which is currently difficult to quantify is motion sickness. It is believed to be an accumulated effect from many curves. Investigations indicate that nausea is correlated with roll motions. However, contributions from lateral acceleration and lateral jerk are possible [12], [13], [14], [15].
6. ANALYSIS OF SINGLE CURVES
6.1 Level 1 - the choice of cant
In the comparisons of different alignment alternatives, each alignment should be provided with its best cant B*. Hence, the choice of cant was investigated. For practical reasons, the analysis will be focused on the correlated cant deficiency I.
Since simulations with multibody computer code are time consuming, the investigation started with simplified calculations, based on the assumption that lateral acceleration in the vehicle body is proportional to the lateral acceleration or cant deficiency I in the track plane, both on circular curves and on transition curves. For standard gauge 1435 mm, Equations (1) and (2) may then be re-written as Equations (3) and (4) for standing and seated passengers, respectively.
PCT = max(0.1867 I - f, +0.0376-l - f, .% 11.1,0)+
t+5.75 -10 6 -(|DEQ f, -1| - {42-283
(3)
[V
PCT = max(0.0587 -1 . f, + 0.0176 - 1 - f, f 5.9,0) +
[+ 73.96 - 10"6 .(|DEQ f, -1| . LE)626
(4)
where I : cant deficiency [mm]
f,, : effective roll factor, see Section 4.2 H V = vehicle speed [km/h]
Lt = length of transition curve [m] DEQ = equilibrium cant [mm]
If the equilibrium cant is low, it will be possible to find a suitable value for cant deficiency I, for which PCT equals zero, indicating no passenger discomfort at all. For higher values of equilibrium cant, the optimal cant deficiency (with respect to PCT) reduces the first term in Equations (3) and (4) to zero. The optimal cant deficiency [* may then be expressed as Equations (5) and (6) for standing and seated passengers, respectively.
1* =
59.5
(5)
f, (1+o.2014 )
[* =
100.6
(6)
f, - (1+ 0.2999 - _)
Obviously, optimal cant deficiency (like optimal cant) is not the same for standing and seated passengers. However, PCT for seated passengers deviates significantly less from its minimum value if cant is chosen for standing passengers, compared to the increment of PCT for standing passengers if cant is chosen for seated ones. Hence, PCT for standing passengers was used as object function in [1]. However, the aspect of motion sickness may justify using PCT for seated passengers, in order to reduce roll
motions.
It should also be noted that if cant is not optimised for tilting trains, Equations (3) -(6) may be used for an approximate estimation of an optimal magnitude of the effective roll factor fr, which will vary between different curves.
6.2 Level 2 - the choice of lengths of transition curves
When the transition curves are lengthened, the magnitude of the necessary reduction of radius will depend on the positions of the binding obstacles and the angle between the adjacent straight lines. A binding obstacle in the middle of the curve requires the smallest reduction and a binding obstacle at the end of the curve the largest reduction. A small angle between the straight lines requires a larger reduction of curve radius than a large angle.
Four different alignment corridors, each with a single curve, have been analysed. For each corridor, the analysis assumed the adjacent straight lines to be fixed in the same position and direction for all curve combinations. The analysis also assumed that the lengths of the transition curves are the same at both ends.
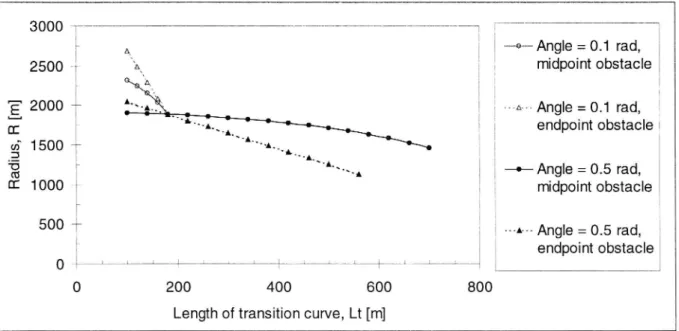
In order to clarify the relations, only one obstacle was used in each terrain corridor. In two cases, it is placed in the middle of the curve and in the other two cases at the end. Two terrain corridors consist of a curve with an angle (between the adjacent straight lines) of 0.1 rad and two corridors of a curve with an angle of 0.5 rad. In all four cases, the obstacle was assumed to be placed so that the combination R=1888 m and Lt=180 m (according to Swedish track standards, the smallest radius and shortest corresponding transition curve for conventional trains running at 200 km/h) was at the border of the permissible zone, see Figure 3.
3000 El
2500 w a. l midpoint obstacle
"E" 2000 __ ma Angle =0.1 rad,
E 1 endpoint obstacle a; 1500 E "g . i _. Angle = 0.5 rad, CE 1000 e 1 1 midpoint obstacle 500 l ... Angle = 0.5 rad, 1 endpoint obstacle o 1 . ' r . f l . 1 l . * - i 0 200 400 600 800
Length of transition curve, Lt [m]
Fig. 3. Possible R/Lt combinations in the four terrain corridors.
All curve combinations were evaluated with their optimal cant (resulting in the lowest possible PCT value for standing passengers), but the Swedish upper limit of 150 mm has been applied. Except for the very shortest transition curves, the cant was 150 mm.
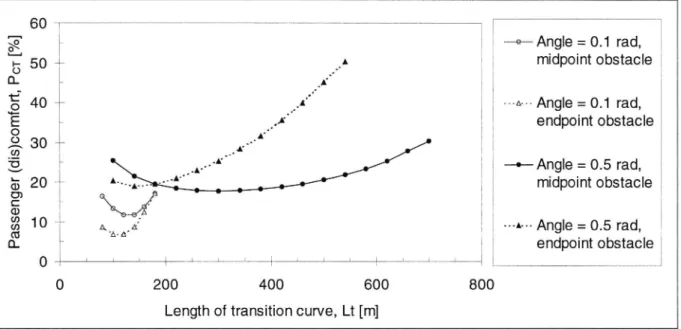
Figure 4 shows the resulting PCT values for the conventional Eurofima coach passing the curves in the four terrain corridors at a speed of 200 km/h.
60 l L , ...G... Angle = 0.1 rad, l 50 ._._ f ! midpoint obstacle l R .. ~ 1 40 __ ' A Angle = 0.1 rad, _ * endpoint obstacle - Angle = 0.5 rad, Pa ss en ge r (d is )c om fo rt , PC T [% ] 00 O 20 _._ midpoint obstacle
10 "*" ML-é"; ---A- Angle = 0.5 rad, ,
_ endpoint obstacle
o . i i % * . i l f % % l i
0 200 400 600 800
Length of transition curve, Lt [m]
Fig. 4. PCT for standing passengers, conventional coach passing the curves at 200 km/h. On the short transition curves, high PCT values are caused mainly by high magnitudes of lateral jerk and roll velocity, while on the very long transition curves, high PCT values are caused by a high magnitude of lateral acceleration since the radius decreases with increased transition length.
When the transition curves are shorter than 180 m, the Swedish limit for rate of cant (46 mm/s) is exceeded, while for longer transition curves the Swedish limit for cant deficiency (100 mm) is exceeded. From an isolated comfort point of View, such overruns may sometimes be justified.
Body tilt systems reduce the lateral acceleration perceived by the passengers. Hence, tilting trains may pass curves at a higher speed than conventional trains and in this study, passenger comfort in the tilting coach was evaluated for a speed of 250 km/h, see Figure 5 .
60 i
o? m.,... Angle = 0.1 rad,
T; 50 __ midpoint obstacle ;
a?
g 40 r MAH Angle =0.1 rad,
"é endpoint obstacle
& 30
(I)l
l 53
5 l o Angle = 0.5 rad, % 20 + ' midpoint obstacle c l l 7 3 10£ ----A- Angle =0.5 rad,
n. l l endpoint obstacle;
0 f 1 l , i l
0 200 400 600 800
Length of transition curve, Lt [m]
For both non-tilting and tilting coaches, the optimal transition curves are longer when the angle between the straight lines is large and when the binding obstacle is placed in the middle of the curve.
The wheel/rail forces and climbing ratios were evaluated at slightly higher speeds than comfort. For the Eurofima coach, these quantities were evaluated at 210 km/h and for the tilting coach at 260 km/h. The corresponding limits were not exceeded unless the transition curves were far longer than optimum and the cant deficiencies were larger than 415 mm. However, no track irregularities were used in the simulations. Hence, further investigations, including different levels of track irregularities, are necessary.
7. CONCLUDING REMARKS
This paper is intended to give a general overview of Swedish research on alignment and to present certain general principles for comparisons of different track geometries.
It is recommended that investigations of designed track geometry be organised in a hierarchy: fixed alignment - fixed terrain corridor - variable terrain corridor.
When optimising alignment and cant, PCT may be used as object function in order to minimise passenger discomfort. However, there are uncertainties about the cause of motion sickness, which may affect sensitive passengers in tilting trains.
It has been found that
large angles between adjacent straight lines,
- obstacles in the middle of the curves (rather than near the ends), and - low roll coefficients of the vehicles
favour longer transition curves, even though the radii must be reduced. In particular, tilting trains favour longer transitions since comfort in these trains is less affected by reductions of radii.
There is a need for further studies, focused on the impact of track irregularities on the resulting wheel/rail forces, climbing ratios and PCT. There is also a need for further knowledge in the area of motion sickness. Monetary assessment of passenger comfort is an important area for enabling comparisons of alignment alternatives with different construction costs.
Acknowledgements
The initial research project on alignments is financed by Adtranz Sweden, the Swedish National Rail Administration (Banverket), the Swedish Transport and Communications Research Board (KFB), the Swedish State Railways (SJ), and the Swedish National Road and Transport Research Institute (VTI). Certain remarks in this paper are based on a current research project on track standards for tilting trains in Norway, financed by the Norwegian National Rail Administration (Jernbaneverket).
References
[1] Kufver, B.: Optimisation of single horizontal curves in railway alignments. TRITA FKT Report 45-1997. KTH, Stockholm /VTI rapport 424A. VTI, Linköping, 1997.
[2] Shortt, W.H.: A practical method for improvement of existing railway-curves. Proceedings Institution of Civil Engineers, Vol. 176, 1909. (p. 97 118).
[3] Baluch, H.: Increasing the length of transition curves by a reduction of the main curve radius. Rail International, Vol. 14 No. 1, 1983. (p. 10 15).
[4] Hashimoto, S.: Analysis of relationship between transition curve profile and railway vehicle vibration. Quarterly Report of RTRI, Vol. 30 No. 4, 1989. (p. 207-214).
[5] Kufver, B.: Mathematical description of railway alignments and some preliminary comparisons. TRITA-FKT Report 30-1997. KTH, Stockholm /VTI rapport 420A. VTI, Linköping, 1997.
[6] Kufver, B.: Variables and criteria for evaluation of vehicle reactions caused by railway alignment. TRITA-FKT Report 29-1997. KTH, Stockholm /VTI Notat 43-1997. VTI, Linköping, 1997.
[7] UIC: Test and approval of railway vehicles from the points of view of dynamic behaviour, safety, track fatigue and ride quality. UIC 518 OR (Draft of January
1997). Paris, 1997.
[8] CEN: Railway applications - Testing for acceptance of running characteristics of railway vehicles - Part 1: Testing of running behaviour. CEN TC 256 WG 10
(Final working draft). Brussels, 1996.
[9] Kufver, B.: Methods for evaluation of ride comfort as a function of vehicle reactions caused by railway alignment. TRITA-FKT Report 31-1997. KTH, Stockholm /VTI Rapport 421A. VTI, Linköping, 1997.
[10] Harborough, P. R.: Passenger comfort during high speed curving - analysis and conclusions. BRR TR DOS 018. BRR, Derby, 1986.
[11] CEN: Railway applications - Ride comfort for passengers - Measurement and evaluation. CEN TC 256 WG 7 (Final committee draft for official CEN-enquiry). Brussels, 1995.
[12] Koyanagi, S.: Ride quality evaluation of a pendulum car. QR of RTRI, Vol. 26 No. 3, 1985. (p. 89 92).
[13] Ueno, M., et al.: Studies on motion sickness caused by high curve speed railway vehicles evaluation of the swing and its effects on passengers and conductors. Jpn J Ind Health, Vol. 28, 1986. (p. 266-274).
[14] Ohno, H.: What aspect is needed for a better understanding of tilt sickness? QR of RTRI, Vol. 37 No. 1, 1996. (p. 9 13).
[15] Förstberg, J., Andersson, E., & Ledin, T.: The influence of roll acceleration motion dose on travel sickness: Study on a tilting train. Paper presented at the UK meeting on human response to vibration, Buxton (England), 1998.