VTI meddelande 922A • 2002
Vehicle control and
drowsiness
Albert Kircher
Marcus Uddman
VTI meddelande 922A · 2002
Vehicle control and drowsiness
Albert Kircher, VTI
Publisher: Publication:
VTI Meddelande 922A
Published:
2002
Project code:
40409
SE-581 95 Linköping Sweden Project:
Vehicle Control and Drowsiness
Author: Sponsor:
Albert Kircher, VTI
Marcus Uddman, Virtual Technology Jesper Sandin, Virtual Technology
Autoliv Research
Title:
Vehicle Control and Drowsiness
Abstract
The report consists of two parts. The first part is a literature study aimed at identifying the most relevant indicators for predicting and detecting fatigue induced impaired driving. The aim was to identify possible performance based technologies, such as the lateral control of the car. Thus, less attention was devoted to e.g. psycho-physiological measures like EEG. A large number of research reports describing various approaches have been reviewed. The survey clearly indicates that no single indicator can be used to detect drowsy driving. A combination of different measures is recommended e.g. analysis of lateral control performance and eye blink pattern. Furthermore, it should be noted that so far there is no commercial system available that provides a sufficiently reliable method to detect a drowsy driver. In the second part, experimental data from previous driving simulator experiments were analysed by means of signal processing and statistical analyses. Specific attention was paid to investigate the potential of lateral vehicle position data as a mean to estimate driver drowsiness. The analysis of experimental data did not reveal any clear answer to what indicators are the most prominent with respect to detect drowsy driving behaviour. Further investigations and analyses of driving behaviour data are needed. However, the data analysis conforms in large to the findings in the literature survey.
Utgivare: Publikation:
VTI Meddelande 922A
Utgivningsår:
2002
Projektnummer:
40409
581 95 Linköping Projektnamn:
Fordonskontroll och trötthet
Författare: Uppdragsgivare:
Albert Kircher, VTI
Marcus Uddman, Virtual Technology Jesper Sandin, Virtual Technology
Autoliv Research
Titel:
Fordonskontroll och trötthet
Referat
Den här rapporten består av två delar. Den första delen är en litteraturstudie med syfte att identifiera de mest relevanta mått som kan användas för att predicera och detektera farligt körbeteende som beror på trötthet. Målsättningen begränsades till att försöka identifiera mått på körprestation t.ex. lateral kontroll (styrbeteende). Således har mindre uppmärksamhet ägnats åt t.ex. psykofysiologiska mått som EEG. Ett stort antal forskningsrapporter som beskriver olika angreppssätt har granskats och refereras i rapporten. Studien visar tydligt att det inte finns någon unik indikator som kan användas isolerat för att detektera trötta förare. Istället rekommenderas att man kombinerar olika mått som t.ex. styrprestation (hur bra föraren följer vägen) och förarens "blinkbeteende". Vidare kan man konstatera att det idag inte finns något kommersiellt system som använder en tillräckligt tillförlitlig metod att detektera trötta förare. I den andra delen av rapporten presenteras olika analyser av data från tidigare "trötthetsstudier" i körsimulator med hjälp av signalbehandling och statistiska metoder. Speciellt har analysen koncentrerats på att undersöka potentialen i att använda positionsdata för fordonet för att detektera trötthetsrelaterat körbeteende. Analysen gav emellertid inte några klara svar på vilka indikatorer som lämpar sig bäst i detta sammanhang. Ytterligare undersökningar och analyser av körbeteende under trötthetsbetingelser är nödvändiga. Emellertid överensstämmer resultatet från dataanalysen i stora drag med det som kom fram i litteraturstudien.
ISSN: Språk: Antal sidor:
Foreword
This study was commissioned by Autoliv Research AB[1] and carried out by the Swedish National Road and Transport Research Institute, VTI[2] (literature survey part) and by Virtual Technology[3] (data analysis part). It was carried out in the period June–September 2001. Project leader at VTI was Björn Peters.
The report consists of two parts. The first part is a literature study aimed at identifying the most relevant parameters for the prediction and detection of fatigue and drowsiness in drivers. Special focus was put on vehicle based performance technologies, such as lateral position variability of the car. In the
second part experimental data from previous driving simulator experiments were
analysed by means of signal processing and statistical analyses. Specific attention was paid to investigate the potential of lateral vehicle position data as a mean to estimate driver drowsiness. The report concentrates on measures and methods that can be used to detect and possibly predict drowsiness, fatigue or the resulting state of impaired driving performance in real time and in an automated manner, thus e.g. subjective and physiological methods are only briefly considered here.
Linköping, May 2002
Acknowledgement
This report was produced under a contract with Autoliv Research. We would like to express our gratitude to Jan-Erik Källhammer at Autoliv Research who has supported the work not just financially but also provided very valuable feedback and guiding ideas for the production of this report.
Content Page
Summary 7
Sammanfattning 9
Part one: Literature Study 11
1 Introduction 11
1.1 Exposure to accidents due to drowsiness (statistics) 12 1.2 Individual driving behaviour and incompleteness of one
single measure of fatigue 12
1.3 Validation 13
1.4 Day and night driving 13 1.5 Requirements for drowsiness warning systems 14
1.6 Means of research 14
2 Terms and definitions 15
3 Variables looked at to detect drowsiness 16 4 Methods to identify drowsiness in drivers 17 4.1 Physiological measures 17
4.2 Ocular dynamics 18
4.3 Steering wheel movements and steering wheel variability 20
4.4 Lateral position 22
4.5 Time-to-line crossing (TLC) 29 4.6 Combination of different methods 32 5 Commercially available fatigue monitors 35
5.1 SAM 35
5.2 DAS 2000 Road Alert System 36
5.3 SafeTRAC 36
5.4 TravAlert 36
5.5 Companies that are planning to introduce drowsiness or fatigue detection and warning systems in vehicles 37
6 Patents 38
7 Problems related to automatic drowsiness detection 39 7.1 Detecting vs. predicting drowsiness 39 7.2 Gender and age of the driver 39 7.3 Overtaking and road curvature 40 8 Further literature of interest 41
9 Summary 42
Part two: Data Analysis 46
10 The “Hök” project 46
11 Analysis of drowsiness rating 51 12 Analysis of the standard deviation of the lateral
position (SDLP) 52
12.1 Regression analysis 54 13 Analysis of the mean value of the lateral position 58 14 Times driver change direction 59 15 Time to line crossing – TLC 60
16 Frequency Analysis 65
16.1 Fast Fourier Transform 65 16.2 Power Spectrum estimate via Burg's method 71 16.3 Power Spectrum estimate via MUSIC eigenvector method 71 16.4 Short time frequency transform 71
17 The “SAVE” project 72
17.1 Analysis of progression in time before driving off the road 72
18 Summary 74
18.1 Drowsiness rating 74
18.2 SDLP – Standard Deviation of the Lateral Position 74
18.3 Lateral position 74
18.4 Time to Line Crossing – TLC 75 18.5 Spectral analysis of Lateral Position 75
18.6 Possible measures 75
19 References 77
Appendices:
Appendix 1: TLC formulae Appendix 2: TLC calculation Appendix 3: Search methods
Vehicle Control and Drowsiness
by Albert Kircher, Marcus Uddman and Jesper Sandin
Summary
Currently there are no simple and reliable driving
behaviour measures that can be used to detect
drowsy drivers
It is known that drivers' drowsiness and fatigue is accompanied by deteriorated vehicle control. We investigated which factors are possible to use for the prediction and detection of fatigue induced impaired driving. In this study focus was on variables directly related to lateral control and steering behaviour aiming at a method capable of detection and prediction of impaired driving performance in real time and in an automated manner. Psycho-physiological variables, subjective rating scales, etc. are only briefly discussed.
The first part of the report is a literature study. It served to examine the available knowledge in the field and to identify the most promising indicators of impaired driving. A large number of publications describing various approaches have been reviewed. The survey clearly indicates that no single indicator can be used to reliably detect drowsy driving. A combination of different measures is recommended, e.g. analysis of lateral control performance and eye blink patterns. Furthermore, it should be noted that even though there are a small number of commercial drowsiness detection systems available, no system provides a sufficiently reliable and scientifically proven method to detect a drowsy driver.
In the second part of the report experimental data from previous driving simulator experiments were analysed. Signal processing techniques, such as frequency analysis by means of Fourier transforms, and statistical analyses were used to disclose if data could be used to determine drivers' drowsiness as rated on subjective rating scales (Karolinska Sleepiness Scale). Specific attention was paid to investigate the potential of lane control data (steering performance) as a mean to estimate driver drowsiness. Measures related to lateral vehicle position, such as time to line crossing and deviation of lateral position, were also analysed, but were not found useful. The analysis of experimental data did not reveal any clear answer to what driver behaviour indicators are the most prominent to detect drowsy driving behaviour.
However, the data analysis conforms in large to the findings in the literature survey: a single variable is hardly usable as drowsiness predictor. More advanced
Fordonskontroll och trötthet
av Albert Kircher, Marcus Uddman och Jesper Sandin
Sammanfattning
Det saknas enkla och tillförlitliga körbeteendemått
för att identifiera trötta förare
Det är känt att sömnighet och trötthet sammanfaller med att förare har för-sämrad kontroll över fordonet. Vi undersökte vilka faktorer som skulle kunna vara möjliga att använda för att förutsäga och upptäcka försämrad fordonskontroll och som beror på att föraren är trött. I denna undersökning fokuserades på variabler som direkt relaterades till lateral kontroll och styr-beteende. Siktet var inställt på en metod som skulle kunna predicera och detektera nedsatt körprestation i realtid och på ett automatiserat sätt. Psyko-fysiologiska mått, subjektiva skattningsskalor etc. tas bara kortfattat upp i denna studie.
Rapportens första del är en litteraturstudie. Syftet med denna är att ge en överblick över den tillgängliga domänkunskapen och ett försök att identifiera de mest lovande indikatorerna på nedsatt körbeteende. Ett stort antal publikationer som beskriver olika angreppssätt har granskats. Kartläggningen visar tydligt att det inte finns unika indikatorer som kan användas isolerat för att tillförlitligt detektera nedsatt körbeteende som beror på att föraren är trött. En kombination av olika mått rekommenderas, t.ex. analys av lateral kontroll och blinkbeteende. På mark-naden finns ett fåtal kommersiella system för att detektera trötthet, men inget av dessa system erbjuder en tillräckligt tillförlitlig och vetenskapligt beprövad metod för att detektera en trött förare.
I den andra delen av rapporten redovisas en analys av kördata från tidigare försök i körsimulator. Signalbehandlingsmetoder som frekvensanalys med hjälp av Fouriertransformationer och statistiska analyser genomfördes med syfte att undersöka om data gick att använda för att detektera trötthetstillstånd som skattats med hjälp av en subjektiv skattningsskala (Karolinska Sleepiness Scale). Speciellt undersöktes potentialen i att använda data som beskriver lateral kontroll (styr-ningen) som ett sätt att mäta förarens trötthet. Mått som relaterade till lateral position, t.ex. tid till linjeöverskridning (time to line crossing) och standardav-vikelse för lateral position, prövades men inget av dessa mått befanns vara användbart. Analysen av experimentella data gav inga klara svar på vilka kör-beteendevariabler/mått som är mest lovande för att detektera trötthet hos föraren.
Analysresultaten sammanfaller således med det man fann i litteraturstudien: Det finns inget unikt mått som kan användas isolerat i syfte att detektera trött-hetstillstånd tillräckligt tillförlitligt. En mer avancerad signalbehandlingsteknik skulle kunna ge ett bättre resultat. Ytterligare undersökningar och analyser av data är nödvändiga. Kombinationer av olika mått som ögonblinkssmått tillsammans med mått på lateral kontroll (styrning) har bättre förutsättningar att ge ett till-räckligt bra resultat.
Part one: Literature Study
1 Introduction
Loss of driver alertness is almost always preceded by psycho-physiological and/or performance changes [1, 2]; these changes are the reason that it is possible to detect onset of drowsiness associated with loss of alertness in drivers.
The basic idea behind vehicle-based detection is to monitor the driver unobtrusively by means of an on-board system that can detect when the driver is impaired by drowsiness. The concept involves sensing various driver-related variables (such as physiological measures) and driving-related variables (driving performance measures), computing measures from these variables on-line, and then using the measures separately or in a combined manner to detect when drowsiness is occurring, and more important to predict the onset of drowsiness. Measures are combined because no single unobtrusive operational measure appears adequate in reliably detecting drowsiness [3].
It is important to point out the distinction between prediction and detection of drowsiness. Clearly the prediction is the main aim, since at the detection point, drowsy driving may already have led to a potentially hazardous situation or even an accident. Another aspect is the great inter-individual variability in driver and driving behaviour, which an eventual automated system must be able to handle.
The second main part of this report consists of analyses of driving data. The purpose of data and statistical analysis was to analyse the lateral position and compare it to estimated drowsiness. The only data available was the lateral position. No other data such as steering wheel angle or velocity variation was available. The main variables focused on were: frequency of lateral position, amplitude variations in lateral position and time-to-line crossing.
Main goal of the report
Identify the most relevant parameters for the identification of drowsiness in drivers. Focus is on relationships between drowsiness and vehicle based
performance technologies such as lateral position variability of the car. The
possible techniques to identify drowsiness are of interest as well.
This report will not treat:
• how to make use of the results of drowsiness detection techniques (for example how to warn or alert a driver);
• legal and ethical issues related to drowsiness detection;
• drowsiness detection in other areas than passenger vehicles (here the primary focus is on cars, although trucks are examined as well);
• readiness-to-perform and fitness-for-duty prior to driving technologies;
1.1
Exposure to accidents due to drowsiness (statistics)
Driver fatigue is estimated to cause 3.2 % of the traffic accidents (source: Traffic Safety Facts 1999 Annual Report, available at http://www.nhtsa.dot.gov/people/ncsa/809-100.pdf). Other authors found that up to 10 % of all traffic accidents and up to 25 % of single-vehicle accidents are related to fatigue [4, 5].
In the USA cost of fatigue related crashes: NHTSA estimates that vehicle crashes due to driver fatigue cost Americans $12.5 billion per year in reduced productivity and property loss, and 1500 lives [6].
According to Knipling and Wierwille [3] 96 % of drowsy driver crashes in-volve cars and 3 % inin-volve trucks. For trucks, however, the expected number of involvements per vehicle life cycle is about four times greater than for cars; this is due to the longer operational lives and higher mileage per year. Truck accidents are more damaging. Most accidents occur on highways, caused by men (77 %) less than 30 years of age (62 %). (Data: US National Highway Traffic Safety Administration 1992).
In the USA, recent estimates of the proportion of accidents in which fatigue or drowsiness were involved, range from 1.2–1.6 % for all police-reported accidents [7] to 3.2 % of the fatal crashes [8]. UK estimates are essentially similar, 1.7 % and 2.5 %, respectively [9]. Estimates of fatigue and drowsiness involvement in accidents are consistently higher when based on ‘in-depth’ accident investigations or on clinical studies. From 1–4 % involvement rate estimated from general police databases, the figures rise to 10–25 % or even higher [10].
The increasing interest in methods to detect drowsiness in drivers originates partly in the high cost in terms of money and lives that accidents attributed to drowsiness cause. Furthermore there is an increased interest from car manufac-tures to offer in-car techniques that make driving safer.
1.2
Individual driving behaviour and incompleteness of
one single measure of fatigue
It is well known that each driver has individual driving behaviour. This fact causes problems in the automatic recognition of drowsiness through measurement of parameters such as lateral position. Furthermore it is not seen as sufficient to use one single parameter to detect drowsiness in drivers. Renner and Mehring [19, page 1] state that: ”With ongoing research it became evident that lane departure
warning and lane position parameters reflect only one facet of the performance decrements within fatigued drivers. A fatigued driver can actually keep his vehicle perfectly in the lane, provided the vehicle heading is coincidentally appropriate for the road curvature ahead. In our studies we found evidence for intentional short „naps“ on straight road sections, on which the vehicle path was perfect, but the driver was incapable to react upon any unexpected event (e.g. front end collision). In order to prevent these dangerous situations of „good“ lateral control without reaction readiness, a more complex drowsiness detection technique had to be developed.”
1.3 Validation
A relevant problem in drowsiness detection is the validation of a potential technology or methodology; in other words: what to validate the (new) technology against, or what is the criterion available. Another difficulty is the adequacy of the validation data (what is acceptable validation, what is the safe level of the fatigue index?) [11].
A representation formalism widely utilized to define the performance of a test in general is represented in table 1.
Table 1 Contingency table for sensitivity and specificity calculation.
Driver drowsy Driver alert
System alarms True Positive (TP) False Positive (FP) Total tested drowsy
System alarms not False Negative
(FN) True Negative (TN) Total tested alert
Total drowsy Total alert
The contingency table (also referred as generalized payoff matrix or true signal
detection) is representative for the quality of the adopted analyses or of the used
detection system.
In our case, sensitivity is the percentage of all drowsy drivers that are detected as drowsy by the system.
Sensitivity (%)= TP/(TP+FN) * 100 % = P(T|D), where T=test (system) and D=drowsy
Specificity is the percentage of all alert drivers that are detected as alert by the system.
Specificity (%)=TN/(TN+FP) * 100 % = P(¬T|¬D).
Ideally, all drivers that are driving drowsy have to be detected by the system, and no driver which is not driving drowsy has to be identified as drowsy, thus a system that aims at predicting drowsiness should have a high sensitivity as well as a high specificity, however to obtain both is very difficult. It could be argued that for the “performance” of the systems it is more important to really detect all drowsy drivers (high sensitivity); on the other hand the acceptance of a system would be poor if alert drivers are alarmed since judged drowsy by the system. A trade-off will have to be found, also considering the technical, legal and ethical implications of this thematic.
1.5
Requirements for drowsiness warning systems
The most important requirements for drowsiness prediction and/or detection systems are:
1. real time measurement,
2. be unobtrusive and have no physical contact with the driver, 3. not cause harmful emissions,
4. not include moving parts,
5. detect drowsiness prior to occurrence of critical performance failure.
Renner and Mehring [19], who were doing research on automated drowsiness detection systems for Daimler Benz, state that: “A clear directive for a ready to
market product is „never bother the driver“. For a successful warning system it is not feasible to expect the driver to wire him-/herself with electrodes or sensors every time she/he goes on the road, thus a non-obtrusive monitoring system was the goal.”
1.6 Means
of
research
The methods, search engines and search terms used for the present literature review are summarized in appendix 3.
2
Terms and definitions
“Fatigue: specific form of human inadequacy in which the individual experiences an aversion to exertion and feels unable to carry on [13].”
Fatigue is not the same as drowsiness, but the desire to sleep may accompany fatigue. Fatigue represents a normal and important response to physical exertion, emotional stress, or lack of sleep. Fatigue can also be a non-specific symptom of a psychological or physiological disorder. Drowsiness is the excessive daytime sleepiness (without a known cause), which can suggest the presence of a significant sleep disorder and is different from fatigue. [14, 15]. It has to be said that there is a lack of an agreed and distinct definition of fatigue and drowsiness [16], and that different authors have different opinions on the theme; a distinction between physiological and psychological factors contributing to fatigue is also rare [17].
Note:
Trötthet → fatigue
Sömnighet → drowsiness (sometimes used synonymously with fatigue)
sidolägesvariation → lateral position variation or variability
Sidoläge → lateral placement or lateral position
In this literature review the term drowsiness is used to refer to the state of reduced alertness, usually accompanied by performance and psycho physiological changes, which may result in loss of alertness or being “asleep at the wheel”.
Definitions of terms used in the report
For a definition of the terms amplitude, frequency, time-to-line crossing, relative
lateral position, absolute lateral position, steering wheel variability, root mean square error of the lateral position, standard deviation of lateral position (SDLP)
3
Variables looked at to detect drowsiness
Since the literature study focused on methods to automatically detect drowsiness, the following variables were of main interest: time-to-line crossing, lateral position of the car and related measures, steering wheel measures (see also defi-nitions in appendix 4). Other measurement variables of possible interest are: longitudinal position deviation, eye blink frequency, physiological variables, and driving performance measures (other than lateral position).
4
Methods to identify drowsiness in drivers
4.1 Physiological
measures
Physiological measures have been frequently used to detect drowsiness. The most promising measures are electroencephalogram measures (EEG) aimed at detecting brain waves typical for fatigue. There is good evidence that rising alpha (8–11Hz) and theta (4–7 Hz) EEG activities indicate increasing sleepiness and thus the potential for lapses in attention and behaviour [18].
Renner and Mehring [19] used EEG and eye parameters to capture driver impairment (mainly caused by fatigue): slow eye movements were used to identify moments of "insufficient perceptual capabilities", and increase of slow wave EEG to identify "deficient information processing". The authors write that this combination appears to be the most promising way to obtain a complete picture of the drivers state related to alertness.
The following figure (figure 1) shows the correlation coefficients r for subjectively evaluated drowsiness and a) an algorithm based on signals from lateral vehicle position, steering wheel angle and longitudinal speed (vehicle state and driver inputs); b) only driver inputs (such as steering angle); c) only vehicle state variables (such as lateral vehicle position).
0 0,1 0,2 0,3 0,4 0,5 0,6 0,7 0,8 algorithm w ith both driv er inputs and
v ehic le s tate inputs
v ehic le s tate inputs c ombination driv er inputs c ombination s ingle driv er input (bes t res ult) s ingle v ehic le s tate input (bes t res ult)
co r r e latio n co e fficie n t r
Figure 1 Correlation coefficients for different methods of drowsiness prediction,
based on a study in the Daimler Benz simulator with 20 professional truck drivers [19]. The algorithm itself is based on retrospective six minute moving averages using one-minute intervals. Driver inputs are for example steering wheel angle; vehicle state inputs are measures like lateral position and TLC.
4.2 Ocular
dynamics
Various studies have shown the possibility to detect and partly predict fatigue by means of ocular dynamics.
The study from the Federal Motor Carrier Safety Administration (FMCSA, formerly the Federal Highway Administration Office of Motor Carriers) of the US Department of Transportation indicated six parameters as potential candidates for detecting drowsiness [22]. “Blink duration showed evident correlation to time-of-day (TOD) and time-on-task (TOT, which means how long has the driver been driving without break) and was longer in the minute preceding the simulated off-road accidents than immediately after, and considerably longer than at the start of early morning driving. Blink frequency showed similar TOD and TOT effects, however, the results were less consistent than with blink duration. Partial eye
closures during fixations showed clear TOD and TOT effects. The results show
that this parameter can detect degraded alertness at least two to three minutes, and likely ten to twelve minutes, before an accident. Eye closures occurred with a relatively high frequency in the minute preceding off-road accidents and showed a dramatic increase 20 to 30 seconds before the accidents. Saccade frequency was markedly higher in the 30 seconds following [off-road accidents] as compared to the 60 seconds preceding off-road accidents. Large head and body movements, although not specifically measured in the study, were observed to be obvious indicators of fatigue.” For the complete report see [22], a short summary is available under [23].
Wierwille and Ellsworth [24] state that the measurement of duration of eye closure is the best and practical instrument to detect driver fatigue. The techniques to detect eye closure can be fibre optical lenses and image analysis instruments. It is also mentioned that combining eye closure measurements with other methods, such as steering wheel movements, can enhance the prediction and detection of fatigue.
In the report by Obara et al. [25] an “intelligent” car is presented that in-corporates a drowsiness detection system based on image processing technologies. The system uses a small CCD camera that is installed in the instrument panel of the car to monitor the face of the driver and record the eye closure, from which information about how drowsy a driver is are computed. If drowsiness is detected the systems provides warnings in form of a sound and a fragrance. The drowsiness detection system described by Obara is based on the observation that eye blinking generally changes from blinking quickly (at wide-awake), to increasingly slow blinking (and even closed eyelid) with declination of alertness. According to the authors the system was successful in detecting drowsiness.
Smith et al. [26] reported the successful head/eye monitoring and tracking of drivers to detect drowsiness by use of one camera pointed at the driver’s face. The image processing algorithms are also described to some extent in the paper.
The number of publications that confirm the successful detection of driver drowsiness by use of measures from eyelid movements, such as blinks, is abundant. Nevertheless, few authors go into details about hardware or algorithms of the detection systems. Some details are revealed in the paper by Shimotani et al. [86] and Grace et al. [30], where basic hardware and algorithms are depicted.
It has to be noted that systems operating cameras to monitor the eyes of the driver mostly do not function properly when the driver is wearing sunglasses, furthermore the functioning can be problematical in poor light conditions, in very
bright light conditions, when people wear eyeglasses, for people with very dark skin, and atypical facial shape [27, 45].
PERCLOS
PERCLOS (PERcent eyelid CLOSure) is a measure of driver alertness, which was identified as the most reliable and valid in a study by the US Federal Highway Administration; various authors refer PERCLOS as a standard for drowsiness detection. The measure is the percentage of eyelid closure over the pupil over time and reflects slow eyelid closures rather than blinks. The PERCLOS drowsiness metric was established in a 1994 driving simulator study as the proportion of time (%) in a minute when the eyelids are at least 80 percent closed. Based on research by Wierwille et al. [28], the US Federal Highway Administration (FHWA) and the US National Highway Traffic Safety Administration (NHTSA) consider PERCLOS to be among the most promising known real-time measures of alertness for in-vehicle drowsiness-detection systems [29].
In the literature three metrics related to PERCLOS are mentioned:
• P70: the proportion of time when the eyes were closed at least 70 percent. • P80: the proportion of time when the eyes were closed at least 80 percent
(the P80 metrics is usually referred as ”PERCLOS”)
• EYEMEAS (EM): the mean square percentage of the eyelid closure rating. It has to be noted that in the study by Wierwille et al. [28] and the related technical brief from the Federal Highway Administration [29] that in order to detect the eyelid closures the face of test persons was monitored and recorded, and then trained human scorers viewed the recordings and rated the degree to which the drivers’ eyes were closed from moment to moment. The challenge related to the PERCLOS metrics is the automatic measurement of the eyelid position, however, successful attempts to measure eyelid position (and derive PERCLOS from it) are reported by Grace et al. [30], where a CCD camera monitors the face of the driver.
The PERCLOS metrics is measured directly and estimated with non-parametric methods for detecting drowsiness in drivers in the paper by Grace et al. [30].
For more details about the PERCLOS measure see chapter 4.6 “Combination of different methods” on page 32.
DDDS
The “drowsy driver detection system” (DDDS) is related to the PERCLOS measure (see above). It uses of a low-power Doppler radar system operating at 24–GHz to monitor the face of the driver. Main measures extracted are eye lid closure and closure frequency. The system is claimed to detect drowsiness and fatigue prior to the driver’s falling asleep [31]. More information about the product is not available.
4.3 Steering wheel movements and steering wheel
variability
As reported by Wylie et al. [32], steering wheel variability is related to the amount of drowsiness in drivers (variability greater as drivers become more drowsy) after being adjusted for road dependent effects. Steering wheel variability is also strongly and reliably affected by location on the route. Therefore this measure must be corrected for route dependent effects if it is to achieve its full potential as an indicator of driver fatigue. The adjustment for route dependent effects can be performed for example by subtracting the all-driver average steering wheel variability associated with each mile of road, thus reducing the variation associated with road curvature. The authors of the article also suggest considering the power spectral density of the steering wheel angle in relation to fatigue. Clearly this approach is arduous for real-time measurements.
Mitsubishi has reported the use of steering wheel sensors and measures of vehicle behaviour (such as lateral position of the car) to detect driver drowsiness in their “advanced safety vehicle” [33]. Toyota uses steering wheel sensors (steering wheel variability) and pulse sensor [34] (to record the heart rate and the heart rate variability of the driver) to achieve the same goal, though no details about the exact nature of the measures used are available. The following image represents a drowsiness detection example from the Toyota study.
Figure 2 Drowsiness judgment example from [34]. “General judgment
(actua-tion)” is the system output (detection of drowsiness), “self declaration” is the
driver’s subjective drowsiness experience, the “fluctuation” (pulse of the driver) and the “steering adjustments interval“ are the recorded input variables for the drowsiness detection. Note: the authors do not explain how the three thresholds are set.
Micro-correction in steering
Micro-corrections are necessary for environmental factors such as small road bumps and crosswinds. Drivers tend to reduce the number of micro corrections in the steering wheel movements with increasing drowsiness. When these micro-corrections diminish, the operator is defined as being in an impaired state [35]. The commercial device “Steering Attention Monitor” (see 5.1 “SAM” on page 35) monitors such corrective movements, sounding an alarm when the micro-corrections are absent.
VHAL index
The VHAL index is a steering wheel-related parameter that is used by certain authors to identify steering wheel movements. It is calculated by extracting high frequency and low frequency components from the steering wheel signal [79].
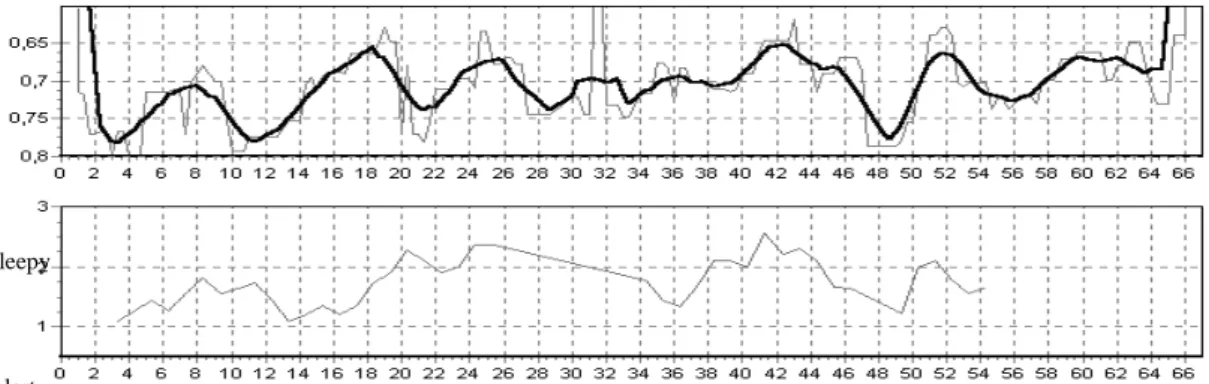
Bittner et al. [79] showed a relationship between the VHAL index and fatigue level (determined offline by human expert based on video recordings of the driver’s face). The basic idea was that a tired driver selects an easy driving strategy, i.e., he compensates only large deviations, which can be detected from steering wheel movements. An example of VHAL index and fatigue is shown in figure 3.
Figure 3 Time series of VHAL (top) and fatigue index (bottom) indexes.
Horizontal axis in minutes.
Note: the authors do not specify the explicit meaning of the VHAL acronym.
The bottom curve of the same figure illustrates the fatigue index of the driver. It can be seen that in approximately the fifteenth minute the courses of the two parameters become very similar, both in shape and in phasing (it seems that the first 15–20 minutes are the time necessary for the driver to adapt to the given freeway and the appropriate driving style). The VHAL index value decreases with increasing fatigue (as can be seen in the mentioned medium-time periods and long-time trend).
The authors conclude that the results related to steering wheel movements are very promising, but that more experiments will be needed to validate the results.
sleepy
An important advantage of measures recorded from the steering wheel over measures based on lateral car position (described below) or eye blinks, is that the former are much easier to measure, since no camera or image processing equip-ment is needed.
It has to be pointed out that a common pattern in drowsy drivers is that the overall number of small and slow steering corrections (so called micro corrections, which are normal in driving) diminishes, while the number of large and fast corrections increases.
Steering wheel monitors were developed, evaluated and in some instances they were even commercially available from certain car manufacturers (such as Nissan [36] and Renault [37], and for trucks as described by Haworth [38]). The main problem with steering wheel input monitors are that they do not really work very effectively, or at least only work in very limited situations [39]. Such monitors are too dependent on the geometric characteristics of the road (and to a lesser extent the kinetic characteristics of the vehicle), thus, they can only function reliably on motorways [37]. Thus, the approach now being developed by Renault is to integrate steering wheel input data with a video of the driver’s face (to monitor eye lid droop) [11].
4.4 Lateral
position
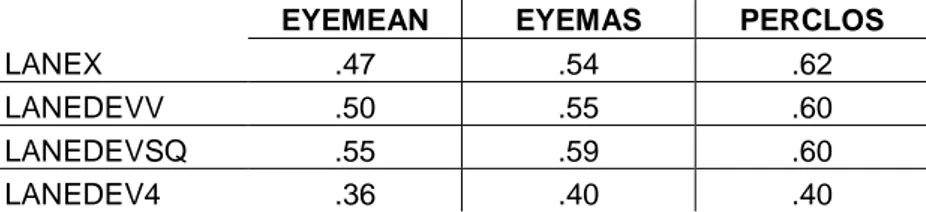
Dingus et al. [40] tested the correlation between different indicators of driver impairment, such as lane measures and eye closure measures. A result was that the number of lane exceedances due to these impairments had the highest correlation with the PERCLOS measure, which is considered a standard for drowsiness detection (see also chapter “PERCLOS” in page 19). Table 2 displays results of the study.
Table 2 Eye measures vs. lane measure correlations in relation to driver
impairment due to intoxication or drowsiness. (EYEMEAN: mean eyelid closure (zero = wide open), EYEMEAS: mean-square percentage of the eyelid closure signal, PERCLOS: proportion of time that the eyes are 80 % to 100 % closed,
LANEX: count of the number of samples taken while the simulated vehicle was
out of the lane, LANEDEVV: lane position variance, LANEDEVSQ: weighted lane deviation (heavier weighting away from the centre lane by a squared function), LANEDEV4: heavily weighted lane deviation (heavier weighting away from the centre of the lane by a fourth power function)).
EYEMEAN EYEMAS PERCLOS
LANEX .47 .54 .62
LANEDEVV .50 .55 .60
LANEDEVSQ .55 .59 .60
LANEDEV4 .36 .40 .40
In the report by Wylie et al. [32] lane-tracking variability was observed to be related to the amount of drowsiness in drivers. The authors of the article observed and identified drowsiness in the test drivers by off-line video recording of the driving. It was concluded that lane-tracking variability is a valid indicator of driving performance, and that drowsiness causes increased lane-tracking variability (here lane tracking variability is defined as standard deviation of lane
in response to conditions in the roadway environment, it is important to account for those differences when using measures such as lateral position and steering wheel angle for detecting drowsiness in drivers. For example, the lateral position of a vehicle can change according to the traffic conditions in the adjoining lanes, as well as in response to the condition of the roadway itself (ruts in the wheel path, the cross-slope of the road, and other factors). Additionally, sensors that monitor the vehicle's position with respect to a fixed mark, such as a lane stripe, operate under the assumption that the mark is both properly placed and is readable by the sensor.
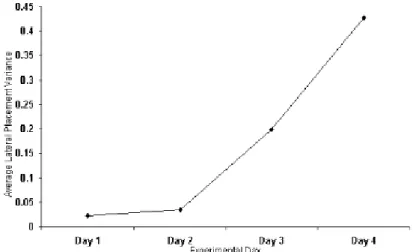
The simulator study by Peters and Kloeppel [41] also shows that the variance in the lateral position of the car on the lane increases with drowsiness of the driver. The results are shown in figure 5.
Figure 4 Average lateral placement variance in meters. Driver sleep deprivation
increases from day one to day 4.
The standard deviation of lateral position (SDLP, see definitions in appendix 4), first mentioned by Klein et al. [42] as indicator of fatigue based impairment is, according to Allen and O’Hanlon, in close relation to the probability of coming off the road (lane exceedance probability) [43]. Stein et al. [82] also measured a significant increase in the SDLP during prolonged driving sessions (see figure 6).
Figure 5 Standard deviation of lane position during tracking task (from Stein,
[82]). X-axis: run number (hours).
It is also noteworthy that the most common consequence of falling asleep during driving is crossing the right lane end, rather than crossing the middle road marking (see also figure 7) [44]. From the article it is, however, not clear if driving on the left hand side (as in England for example) creates the same behaviour pattern.
Figure 6 Consequences of falling asleep during driving according to Sagberg,
[44].
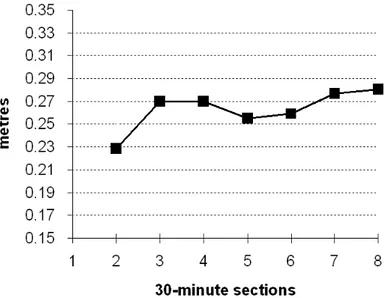
In one field study within the SAVE project analysing eight subjects susceptible to falling asleep [45] mean lateral position, standard deviation of lateral position (SDLP), and standard deviation of steering wheel movements were used as
driving performance measures. Some results are shown in the following figures. The figures summarize four hours of motorway driving.
Figure 7 Mean lateral position on the road (distance hand wheel to
right-hand line) for conditions normal to drowsy (SAVE study).
Note: In figure 8 until figure 11 the x-axis (time) resembles the increasing drowsiness in drivers. This approach has the advantage that drowsiness as such does not need to be defined or calculated, since it is assumed that drivers get more drowsy with increasing driving time (also called time on task, or TOT).
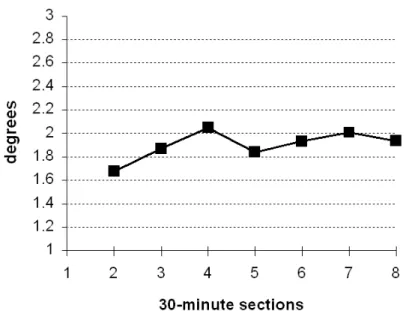
Figure 8 Average standard deviation of the lateral position (SDLP) (SAVE
Figure 9 Standard deviation of steering wheel movements (SAVE study).
In figure 8 the mean position on the road is displayed as the distance between the right-hand line and the right-hand wheel. The position on the road is fairly stable, although there is a tendency to drive closer to the right-hand side of the lane when impaired by alcohol and after three hours of driving. Drivers apparently notice their impairment and choose to drive on the safer side of the lane.
In figure 8 the SDLP is shown. SDLP increases rapidly after the first 30 minutes. After two hours of driving there is a slight improvement in per-formance, although in the following hour SDLP increases again.
Figure 9 shows the average standard deviation of the steering wheel move-ments. It reflects more or less the same increase as SDLP, but standard deviation of the steering wheel is of course more affected by road curvature.
A driving simulator study performed in the SAVE project did not completely match the results of the field tests mentioned above. However, the SDLP was observed to be related to drowsiness, especially in the last five minutes before a driver went off the road because of dozing off (see following figure).
Figure 10 Standard deviation of lateral position in a driving simulator study.
A simulator study commissioned by the Swedish National Road Association (SNRA) [46] showed that there is a difference in the lateral vehicle position of drowsy and alert drivers. Drowsy drivers tend to drive closer to the right road end than the other group. However, the study could not confirm a statistically signi-ficant difference in the lateral position variation between the two groups.
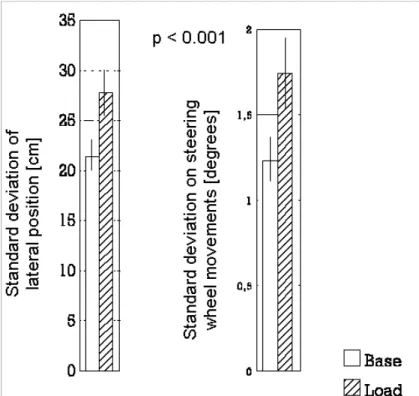
De Waard illustrates in his thesis that the standard deviation of lateral position and of steering wheel movements increase with prolonged driving [47]. Though prolonged driving is not the same as drowsiness, it can be assumed that a driver who is driving for a long time will be drowsier compared to a baseline (short time driving for example). Selected results from the thesis by De Waard are shown in figure 11. The 95 % confidence intervals are also indicated in the figure. The figure shows also the standard deviation in steering wheel position for fatigued drivers. It can be seen from the figure that fatigued drivers have both significantly higher variability in lateral position and in steering wheel movements than alert drivers. The results are based on the “DREAM” study by Brookhuis and De Waard (1993) [48].
Figure 11 Standard deviation of lateral vehicle position (right hand lane) and of
steering wheel position. "Base" represents the baseline of the study (driver not fatigued); "Load" represents fatigued driver.
Summary
Measures of lateral lane control are important to detect the onset of drowsiness, as different studies have shown. Still the problem lies in the reliable real-time detection of the vehicle’s lateral position. Another problem is so called micro-sleeps: when a drowsy driver falls asleep for some seconds on a very straight road section without changing the lateral position of the vehicle. Such happenings would not be detectable by a system based only on lateral vehicle position.
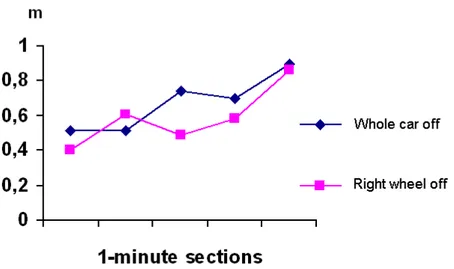
Different measures have been used in the studies; the following table (table 3) summarizes different lateral lane position results from two extensive studies by Skipper et al. [49], and by Dingus et al. [40] (see also [28]).
Table 3 Lateral position measures and relationship to drowsiness (adapted from
[28]).
Finding Ref. Lane deviations which were heavily weighted for lane exceedances were found
to be highly correlated with eye closure and were influenced by sleep deprivation and time on task.
49
Standard deviation of the lane position was found to be highly correlated with eye closure and was influenced by sleep deprivation and time on task.
49 Global maximum lane deviation was found to be highly correlated with eye
closure and was influenced by sleep deprivation and time on task.
49 Mean square of the lane deviation was found to contain a significant amount of independent information. The measure is considered to be an accurate and reliable measure for the detection of drowsiness.
40
Mean square of the high pass lateral position (heavily weighted for rapid changes in lateral position) shows potential as a drowsiness indicator.
40
4.5 Time-to-line
crossing
(TLC)
Time-to-line crossing represents the time available until any part of the vehicle reaches one of the lane boundaries. It is computed from the lateral position of the car. Time-to-line crossing is considered an important measure of driver per-formance [50, 51]. However, it is difficult to compute in real driving. Therefore approximation methods that resemble the real time-to-line crossing have been proposed for real-time measurements during car driving.
In a study by Verwey and Zaidel [52] it was found that time-to-line crossing may be used as a predictor for driver impairment induced by drowsiness. TLC minima may indicate progressing drowsiness and be used to warn the driver of deteriorating performance before the vehicle actually drifts out of the lane. Another important application of TLC in driver warning systems is to detect instances when the vehicle actually moves out of the lane and to warn the driver in order to avoid an immediate accident. A major problem with the measurement of TLC is the complexity of its computation in real time while driving on the road. Also, this measure is computed differently for straight stretches of road compared to curves.
TLC can be computed trigonometrically offline, and is used as a reference in the study by van Winsum et al. [53] (see also appendix 1 for the formulae). For real time calculation two methods are tested: approximation of TLC using the first derivation of the lateral distance, and approximation of TLC using the first and the second derivation of the lateral distance. The most reliable result for normal lane
mated and accurate TLC minima occur. The method of TLC estimation based solely on lateral distance and lateral velocity gives poor results on these points. Summarizing, the authors recommend using the approximation method based on lateral distance, lateral velocity, and the second derivation of lateral position (thus, the first and second derivation of lateral position) as an approximation of TLC in real world driving. A more precise method to calculate TLC is presented in the thesis by Chiu-Geng Lin [54]; methods used are among others Kalman Filtering.
It has to be noted that the lateral position data has to be sampled with at least 10 Hz in order to be usable for TLC calculations. Time-to-line crossing was used in the SAVE study [45] as a performance measure. The calculations were made based on 30 seconds of data.
Renner and Mehring [19] also used TLC, in their report it was used to initiate lane departure warning. Extensive work related to lane keeping and lane departure warning (related to TLC and drowsiness) can be found in the Ph.D. thesis by Batavia [55]. In the report by Pomerleau et al. [56] different algorithms to calculate TLC are presented and evaluated in their performance (see appendix 2). The extensive report also illustrates the results of the different algorithms related to TLC and lane keeping.
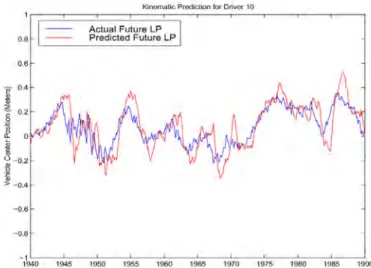
In order to calculate some form of TLC it is needed to estimate the vehicle’s travel path, this prediction can be made in several ways, as exemplified in the work of Batavia et al. [57] Methods for calculation of TLC are for example memory based learning and kinematics projection. In memory based learning current lane position and lateral velocity is used to look up the most likely future lane position based on previous training data. Kinematics prediction works as following: given the current vehicle state, which consists of lane position and lateral velocity, compute what the lateral position of the vehicle will be in t seconds, assuming constant lateral velocity, using lp’=lp+(t*lv), where lp’ is predicted lane position, lp is current lane position, lv is lateral velocity, and t is the prediction time step. Results of the methods by Batavia et al. in terms of performance of the TLC prediction are shown in figure 12 and figure 13. As concluding remarks for the results from Batavia, it can be said that a number of different algorithms and methods have being used to study the problematic of calculating TLC. The results of the calculations are somewhat similar, and the final scope of the calculation determines which method is used.
Figure 12 Prediction results for 50 seconds of driver_10 using kinematics
prediction. The blue (dark) is actual future lane position; the red (bright) is predicted.
Figure 13 Prediction results for 50 seconds of driver_10 memory based learning.
The blue (dark) is actual future position, the red (bright) is predicted future lane position.
In the thesis by De Waard ([47], also cited in relation to standard deviation of lateral position, see chapter 4.4 Lateral position) time-to-line crossing was mentioned to be related to state of fatigue of the driver. Table 4 shows results for minimum and median TLC for fatigued drivers and a baseline (driver not fatigued).
Table 4 Time-to-line crossing times in seconds for fatigued drivers compared to
signi-4.6
Combination of different methods
There is a general agreement that more than one of the methods mentioned above are necessary to obtain reliable drowsiness detection. Frequently combined methods are steering wheel movements and lateral position variables. Peltier-Dillies [27] describes in her study related to detection of decreased driver vigilance how a combination of more measures can be used to detect impaired driving (also caused by drowsiness). A real-time fuzzy pattern recognition process implemented in a neural network is fed with signals from the steering wheel, the speed of the car and the accelerator. According to the author of the paper the system allows a reliable on-line detection of driver vigilance decrease.
Moreno et al. [58] combined steering wheel movement data, acceleration and braking data, and speed data of the vehicle to detect the driving pattern of a drowsy driver. The first results of the research were promising; the authors concluded that more elaborated driving tests must be performed in the next stages of the research in order to evaluate the performance of the system and to adjust the system for optimal performance.
Use of sensors present in vehicles with navigation system
Vehicles with a navigation system onboard use among other sensors a gyro sensor. This gyro sensor, together with a velocity sensor, could be used to compute the driving trace in real time. The result of the calculation with gyro sensor is in fact very similar as the one with use of a lateral vehicle position detection system, with the great advantage that sensors already present in the vehicle can be used.
Honda Motor Co. has research plans regarding the use of gyro sensor and speed sensor to assess the amount of horizontal deviation and the driving path of the vehicle (i.e. zigzag driving), which is caused for example by drowsiness [59, 60] (see figure 14). By now, no details about used algorithms to detect drowsiness by use of the two sensors are known.
Figure 14 Zigzag driving detection with speed and gyro sensor.
Algorithms
The onset of drowsiness is slow, and there is no one single physiological or physical measure that is a reliable indicator. Therefore, the approach taken by Wierwille was to try over 120 different algorithms and test, which was best [28]. The inputs to some of these algorithms include steering motion, lateral acceleration, lane deviation measures, yaw, yaw rate, and physiological measures such as EEG data taken from a headband, so as to be minimally intrusive. The output is a prediction of one of four different accepted drowsiness measures:
1: AVEOBS, which is an observer rating measure, 2: EYEMEAS and PERCLOS, which are measures of slow eye closure, and 3: NEWDEF, which includes slow eye closure, and EEG data. The best prediction results to be implemented in algorithms (in terms of R2) were in fact obtained by using four to seven different variables together.
Related to the publication by Wierwille mentioned before [28], in the work by Knipling and Wierwille [3] many algorithms to detect drowsiness in drivers are examined. The algorithm, which was deemed best, was judged according to the greatest correlation with the PERCLOS metrics (the percentage the eyes of the driver are closed to 80 % and more); which is in fact considered as a standard for drowsiness indication for many authors. The algorithm that is presented is a linear combination of the standard deviation of the lateral velocity over a six minute time window, standard deviation of lateral position relative to the lane, mean standard deviation of the distance between the edge of the vehicle and the lane marker only when the vehicle is outside the lane, the proportion of time the steering velocity exceeds 150 deg/sec, the number of times the steering wheel is held still for more than 0.4 sec, and the proportion of time the steering wheel is held still for 0.4 sec or longer. The algorithm has 98 % correct classification (relative to the PERCLOS measure). The coefficients of the equation are shown in table 5. Thresholds were set for “awake, “questionable”, and “drowsy” state of the driver. The measure resulting from the regression equation was compared to the PERCLOS measure (which is considered a standard). Figure 15 shows the progression of drowsiness for a sample driver and the observed and predicted PERCLOS values. As it can be seen the algorithm is able to predict the original PERCLOS value to a good extent (regression coefficient 0.872). What is impressive is that they are able to classify fairly successfully between ’alert’, ’somewhat drowsy’, and ’dangerously drowsy’, over different drivers without modifying their algorithms. This generality is not seen in a lot of the other driver models.
A considerable number of other different algorithms that use different variables is listed and validated in the report by Wierwille [28, chapter 4 and 5].
Figure 15 Progression of drowsiness and concordance of predicted and observed
PERCLOS value. The three threshold values are also drawn [3].
Table 5 Algorithm to predict drowsiness based on the PERCLOS measure
(regression result). The "B Weight" factors are used to form a linear regression equation of the PERCLOS metrics.
For the calculation of drowsiness with lateral position and steering wheel data using PERCLOS as standard, the algorithm for drowsiness detection presented by Kipling (table 5) shows the most promising results of the whole literature study.
Neural networks
There are more attempts to use nonparametric methods such as artificial neural networks to predict drowsiness. The networks are typically fed with inputs from car position on the road, speed variables, and steering wheel position (see [30] for an example). This approach was also applied in the SAVE project.
▪ PERCLOS algorithm − Observed PERCLOS
5
Commercially available fatigue monitors
There is a number of commercially available fatigue monitors; working principles are based on head movements, heart rate variability, steering wheel movements and grasping strength, EEG analysis, eye movements and activity sensors [61, 45].
Examples are the Onguard eye closure monitor, Dozer's Alarm (a head nodding monitor), and an analogue of the Roadguard reaction time monitor. These devices have been evaluated in 1991 by the Monash University Accident
Research Centre [87].
The criteria used to evaluate the alarms were reliability, threshold and degree of intrusiveness.
Subjects rated the head nodding monitor (Dozer's Alarm) as the least annoying of the three monitors, considered it to be the most effective and said they would be most willing to use and purchase this device. However, these trends were not significant when subjected to analysis of variance, possibly because of the small number of subjects in each group. A problem with such a detection method is that it may not detect drowsiness until a late stage or even sleep, perhaps after serious performance deterioration has already occurred [87].
The reliability of the Onguard eye monitor (which monitors eye closure by using special eyeglasses that the driver must wear) and, to a lesser extent, the Dozer's Alarm (which is similar to a belt that is carried by the driver on the head and records the head position of the driver) is reduced by the tendency to slip from the correct position. Redesign of the devices or more secure attachment could correct this problem, however.
In conclusion, the devices showed the ability to detect fatigue in some cases but were not able to maintain alertness and thus prevent performance deteriora-tion, which is in some cases also seen as a goal. The need to develop more reliable detectors of driver fatigue still remains. Fatigue detectors can only be used as a warning to stop driving and rest, not as an aid to prolong driving.
A review of fatigue detectors can be found in [61, 45]. Other fatigue detectors than those briefly described here are found in the review by Hartley [11, page 16], the detectors described there belong to the group “physiological/behavioural monitoring” (thus, are left outside in this report).
5.1 SAM
Rebman Driver Alert Systems Ltd [62] is selling “SAM” a “driver fatigue alarm”, which is installed under the steering wheel of the car and is claimed to detect fatigue and drowsiness in drivers. The small device monitors movements of the steering wheel (micro-correction in steering) with a magnetic sensor, and through this detects drowsiness in drivers; it is currently priced 235 US $. The company gives no information about the working principle or the algorithms, and no proof of the functionality of the device provided.
5.2
DAS 2000 Road Alert System
The DAS 2000 Road Alert System [64] detects if drivers have inadvertently crossed the centre line or right shoulder lines (in the USA). If either line is crossed without using the turn signals, the system sounds an audio alarm to alert the driver. No formal evaluation of this system was found in the literature. However; as a very general statement, after reviewing such methods the Accident Research Centre at Monash University Australia (1997) did not recommend them on their own as driver fatigue countermeasure [11].
5.3 SafeTRAC
The SafeTRAC™ Drowsy Driver Warning System from the U.S. company “AssistWare Technology Inc” [65] is a lane tracker that monitors the lane markings with a camera mounted on the wind screen and facing toward the road, furthermore the system monitors the steering wheel movements of the driver. The system is sold in its basic form for 1975 $, with diagnostic and data output capability for 15.000$, and the algorithms are sold for 25.000$.
The company states that: “We and our customers have conducted about
80,000 miles of testing with the SafeTRAC™ system, on all types of road and all types of weather/lighting conditions. The system's availability (percent of the time the system is tracking the lane correctly) is in the vicinity of 99 %. False alarms occur about once every 4–5 hours. As one example, on a recent interstate trip of about 350 miles, the system was available 99.45 % of the trip, and experienced no false positives and no false negatives.” No independent validation has been
performed, though, and no measurement data are available from the company to assess the performance of the system.
FIAT (Fabbrica Italiana Automobili Torino) has also developed a system that monitors the lane markings and thus tracks the lateral position of the vehicle, and could theoretically be used as input for drowsiness prediction methodologies.
5.4 TravAlert
TravAlert, sold by TravAlert Safety International (Florida, USA), is a device that monitors steering movements. “When steering patterns deviate from the norm
indicating a lapse in driver alertness, a sensor on the steering shaft signals and an audible alarm is activated. The EEPROM computer receives data from the steering shaft sensor relating to motion. When there is no movement of the shaft (4–13 seconds) an alarm sounds. The EEPROM unit built into the device records the alarm event and generates a driver performance profile for downloading to an external source. TravAlert is armed automatically when the vehicle reaches 30 mph. This system can be installed for about $400.”
There is very little information available about the company and the product, however, it seems that the system is similar to the other steering movements monitors, since it alarms when no steering movements occur. No validation or performance data are available.
5.5 Companies that are planning to introduce
drowsiness or fatigue detection and warning
systems in vehicles
The following table (table 6) lists different companies that plan to introduce systems related to drowsiness detection in vehicles. For further information please consult the given references.
Table 6 Selection of companies planning to introduce drowsiness or fatigue
detection systems in their vehicles.
Manufacturer Method for detection Reference Nissan (cars) eye movements (blinking)
registration through infrared camera
Detroit News, November 1, 1995 [66]
Toyota (cars) steering wheel sensor and pulse sensor
[34] Mitsubishi (cars) two dash-mounted cameras to
monitor and analyze eye position and blinking
[66, 67, 68]
Daimler Chrysler (trucks)
vehicle speed, steering angle and vehicle position relative to road delimitation (recorded by camera) to detect if vehicle is about to leave road
Daimler Chrysler Report 1999 [69]
Siemens (automotive electronics)
video camera that monitors the eye lid movement (blink rate)
Siemens news release 1997 [70]
Renault infrared light, camera that monitors eyelid movements of the driver
Renault R&D Magazine [71]
ASCI & Complexica head position detection with neural net processing
6 Patents
A patent for an “alertness and drowsiness detection and tracking system” was awarded in 1998 (US Patent 5,813,993). The system analyses the EEG, more precisely the rhythmic signal components above 30 Hz. “One or more analogue EEG signals are collected from a subject, appropriately filtered, converted into digital form, and subjected to frequency analysis. Selected signal components from the frequencies above 30 Hz, which have a high correlation with subject drowsiness, are isolated, and their amplitude, energy, or power contribution to the EEG signal is used to produce a continuous output measure reflecting the subject's alertness or drowsiness. The output measure may be compared with a threshold to provide an indication of whether or not the subject is excessively drowsy.” [73]
Another patent for a “Driver's drowsiness detection method of drowsy driving warning system” was awarded in 1999 to Jung-Hack Yeo. The US patent with the number 6,243,015 describes the method of detection as based on monitoring of eyelid closure by means of a CCD camera [74].
There is a number of other patents that concentrate on drowsiness detection (see table 7 for a short list, for the patent details go to [74]).
Table 7 Patents related to drowsiness warning for drivers. Search terms used
alone or in combination with each other: drowsiness – detection – alertness – driving – alarm.
US Patent Number Name 6,016,103 Sleep-detecting driving gloves 4,144,531 Drowsiness detecting apparatus 4,450,438 Drowsiness alarm system for a vehicle 4,564,833 Dozing warning system for a vehicle
4,928,090 Arousal level judging apparatus and method 5,568,127 Drowsiness warning device and neck support 6,154,123 Driver alertness monitoring system
6,097,295 Apparatus for determining the alertness of a driver 4,967,186 Method and apparatus for fatigue detection
4,585,011 Conjugate eye movement detector for sleep analysis
Note: US patents are listed here. The list of patents is not complete and is only
7
Problems related to automatic drowsiness
detection
Problems with automatic drowsiness detection are: what is ‘normal’ or safety critical ‘abnormal’ variability for measures such as lane deviation? What is the range of ‘normal’ variability of these measures in the driving population? Could a perfectly safe driver be classified as ‘abnormal’ on occasions, for example, score a false positive (see also chapter 1.3 Validation). How has the threshold of ‘abnormal’ driving behaviour been selected? With rare exceptions these questions are not answered in the product descriptions of commercially available products. Thus these technologies also fail to provide satisfactory answers to the problem of successful validation [11].
7.1
Detecting vs. predicting drowsiness
Clearly the goal has to be the prediction of drowsiness onset, since the mere detection of it may already be too late to prevent an accident. The onset of drowsiness is slow, and there is no single physiological or physical measure that is a good indicator. The problem is emphasized in Renner’s and Mehring's paper:
”Drowsiness is not easy to recognize especially on a pure visual basis. There are moments in which the driver still looks awake (eyes wide open) but does not process the information anymore. These „looking without seeing“ moments are dangerous and need to be captured by an effective system.
In order to identify moments of both „insufficient perceptual capabilities“ (slow eye closures) and „deficient information processing“ (increase of slow wave EEG) we have chosen to define drowsiness as a combination of brain and eye function. This appears to be the most promising way to obtain a complete picture of the drivers state. Therefore our efforts to predict drowsiness were focused on modelling the time course of a complex drowsiness parameter rather than concentrating on a single aspect of alertness.” [19, page 2]
The prediction of drowsiness represents a greater problem then the detection of it. Many drowsiness detectors and more general methods to detect drowsiness identify when the driver has fallen asleep, which in many cases is too late to avoid accidents [75].
Folkard and Åkerstedt [76] simulated the changes of daytime alertness by the combined action of a homeostatic process, a circadian process and a sleep inertia process. This model was recently validated [77] and applied for predicting sleep latency and sleep duration (which is related to drowsiness in some extent), however, it will not be treated in depth here, since it belongs to the mathematical models of sleep-alertness dynamics, which are not part of the report.
![Figure 1 Correlation coefficients for different methods of drowsiness prediction, based on a study in the Daimler Benz simulator with 20 professional truck drivers [19]](https://thumb-eu.123doks.com/thumbv2/5dokorg/4840304.130914/17.892.196.740.533.870/correlation-coefficients-different-drowsiness-prediction-daimler-simulator-professional.webp)
![Figure 6 Consequences of falling asleep during driving according to Sagberg, [44].](https://thumb-eu.123doks.com/thumbv2/5dokorg/4840304.130914/24.892.263.629.674.1019/figure-consequences-falling-asleep-driving-according-sagberg.webp)