Test and Evaluation of CMA/NaCl Mixtures in Sweden
Anita Ihs and Kent Gustafson
The Influence of De-Icing Salt on Vegetation,
Groundwater and Soil along two Highways in the
south-western part of Sweden during 1994
Lars Bäckman and Lennart Folkeson
Winter tyres - Socio-Economic Calculations
Gudrun Öberg
Reprint from Technical Report, 4th International Symposium Snow Removal and
lce Control Technology, August 11 16, 1996, Reno, Nevada, USA
Swedish National Road and
, Transport Research Institute
VTI särtryck 280 - 1997
Test and Evaluation of CMA/NaCl Mixtures in Sweden
Anita Ihs and Kent Gustafson
The Influence of De-Icing Salt on Vegetation,
Groundwater and Soil along two Highways in the
south-western part of Sweden during 1994
Lars Bäckman and Lennart Folkeson
Winter tyres - Socio-Economic Calculations
Gudrun Öberg
Reprint from Technical Report, 4th International Symposium Snow Removal and
Ice Control Technology, August 11-16, 1996, Reno, Nevada, USA
TEST AND EVALUATION OF CMAINACL MIXTURES IN SWEDEN Anita Ihs and Kent Gustafson
ABSTRACT
Together with plowing and sanding, chemical de-icing and de-icing agents are important tools for highway snow and ice control. The most commonly used de-icing agent is sodium chloride (NaCI), and as such it is effective, easy to handle and inexpensive. Many negative and often costly side effects have, however, been recognised over the years. Extensive research has therefore been conducted to find alternatives.
Calcium magnesium acetate (CMA) is an alternative de-icing agent which has given very promising
results in laboratory and field tests. The most significant impediment to its use is its high price, which is more than 20 times that of NaCI. To reduce the cost but still benefit from the positive effects with CMA tests have been conducted with CMA/NaCI mixtures. In 1993 the Swedish National Road and Transport Research Institute initiated a research project of testing and evaluating a 20/80 weight-% CMA/NaCI mixture. The field evaluation was conducted on highway E4 and included both friction measurements and corrosion tests. The laboratory testing, mainly done at the Swedish National Testing and Research Institute, included corrosion tests and freeze/thaw testing on cement concrete. The laboratory tests showed that the addition of CMA to NaCI does reduce the corrosion of steel and the scaling of concrete. The corrosion of steel is reduced also according to the results from the field tests, but not to the same extent as in the laboratory tests. Furthermore, the same de-icing could be obtained with the CMA/NaCI mixture as with NaCI.
INTRODUCTION
The Swedish National Road and Transport Research Institute (VTI), in co-operation with the Swedish
National Road Administration, has conducted research projects of testing and evaluating salting methods and alternative de-icing agents for many years. During 1985-1990 the Swedish MINSALT programme, minimising the adverse effects of salt , was carried out with the aim of finding more effective ways of improving skid resistance without having the negative effects of salt (NaCl) (1). The results from the MINSALT projects have been reported in different reports and summarised in a final report.
Regarding chemical de-icing - i.e. salting spreading methods have progressed from the earlier use
of dry salt to the spreading of prewetted salt and saline solutions. The results from the MINSALT projects have led to a proposed strategy that will reduce the salt consumption and make the salting more effective. This has been accomplished by working more with anti-icing measures, before the icy conditions occur, and less with de-icing. Prewetted salt or brine are used.
A number of different chemical alternatives to NaCI have been tested. In particular, calcium magnesium acetate (CMA) has been studied more closely regarding its ice-melting capacity,
corrosiveness and effect on concrete. Studies of alternatives have also included chemicals suitable for
runway purposes. Potassium acetate, a liquid de-icer, has been tested and has come to use on some Swedish airports (2).
Since CMA is only available at a very high cost, more than 20 times higher than for NaCI, tests have been conducted with CMA/NaCI mixtures. In the USA very promising results regarding the corrosive effect
have been obtained by mixing NaCI and CMA. Tests conducted in Minnesota with a CMA/NaCI mixture of
20/80 % by weight showed that this mixture can give a significant reduction of the corrosion rate (3). In 1993 the Swedish National Road Administration commissioned VTI to start a research project of testing and evaluating a 20/80 % by weight CMA/NaCl mixture. The evaluation included a field study of the operational effects under varying weather and road surface conditions and laboratory testing of de-icing properties, corrosive effect and the effect on cement concrete. The two latter tests were made by the
Swedish National Testing and Research Institute (SP). The corrosion tests were conducted with steel plates in a climate chamber under simulated field conditions while the effect of various mixtures of CMA and NaCI on cement concrete was investigated by freeze/thaw testing.
METHOD
Laboratory tests Ice melting rate
The melting capacity of the 20/80 CMA/NaCI mixture was tested on blocks of ice at three different temperatures, -2, -6 and -10 0C. For comparison also pure NaCl and CMA were included in the test. The de-icer was evenly spread over the surface of the ice block, 114 cm2, in two different amounts, 10 and 20 g, respectively. The melted ice or brine that formed on the surface of the block of ice was decanted and weighed at specified time intervals.
Corrosion
The corrosive effect of the CMA/NaCI mixture on steel plates was investigated by the Swedish National Testing and Research Institute (4). A spray test was performed in a climate chamber under simulated field conditions. The chamber is devided into two sections to allow two de-icers to be tested at the same time and under identical conditions. In one of the sections a 3 % aqueous solution of the 20/80 weight % CMA/NaCI mixture was sprayed onto the steel plates, and for comparison a 3 % aqueous solution of NaCI was used in the other section.
Freeze/thaw test on cement concrete
Freeze/thaw tests were conducted by the Swedish National Testing and Research Institute to determine the effect of various CMA/NaCI mixtures on cement concrete (5). The method used was based on the Swedish Standard SS 13 72 44 according to which a sawed concrete surface is exposed to a 3 % NaCl-solution during 56 freeze/thaw cycles. Four proportions of CMA/NaCI were included in the test: 0/100, 20/80, 40/60 and 100/0, and cement concrete of three different qualities was used.
A) An old type of concrete, i.e., a type of concrete that was made before air-entraining agents came into use, which occurred in the middle of the sixties.
B) A modern type of concrete with air-entraining agents added.
C) A very dense concrete of high quality which is used only in certain structures but which is expected to
be more common in the future. The concrete is air-entrained and also contains 5 % silicondust.
An investigation of the effect of higher concentrations of CMA on cement concrete was also included. Field tests with CMA/NaCI mixture on Highway E4
De-icing performance
Field studies were undertaken during the winters 1993-94 and 1994-95 on a section of Highway E4, which is a four lane divided highway with bituminous surfacing. To compare the performance of the CMA/NACI mixture and NaCl as de icing agents, skid resistance measurements and pavement surface observations were conducted on a test (CMA/NaCl) and a control (NaCl) section. Each section was about 20 km long and included both the north- and the southbound lanes. Within the test and control sections were a number of 400 m long sampling sections, both in the driving and in the passing lanes, in which the skid resistance measurements were conducted. The sampling sections were selected to be uniform regarding
pavement cross-section, flatness, traffic and other conditions. This segment of the Highway E4 does not experience the effect of rush hour or commuting traffic.
Friction measurements and pavement surface observations were made at each of the sampling sections during a number of situations with slippery conditions. The friction measurements were made using a SAAB Friction Tester. The skid resistance monitoring and also pavement surface observations were usually made before spreading operation, 10 to 30 minutes after spreading, and then at intervals every 45 to 60 minutes until a stable or bare pavement condition was reached. In addition, the atmospheric conditions and pavement temperatures were monitored using two Road Weather Information System (RWIS) stations which were located in the test and control sections, respectively. The time of application and the application rate was reported by the operators of the spreading vehicles.
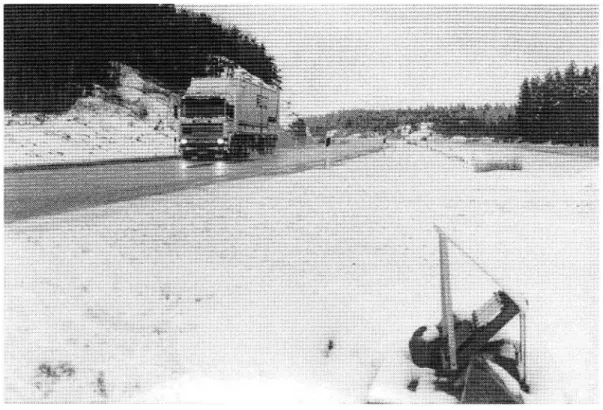
The ratio of the CMA/NaCl mixture used in the field testing was 20/80 by weight. The mixture was
prepared by using a small double hopper with a conveyor belt ( see figure 1). The accuracy of the mixture was checked by taking a sample of the mixture and then separating and weighing the salt and CMA compounds.
Corrosion
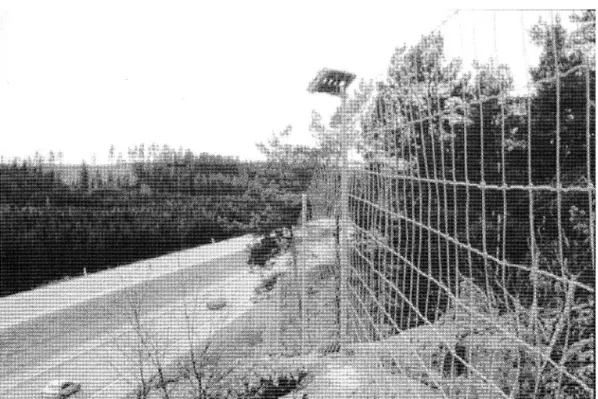
To study the corrosive effect of the CMA/NaCl mixture under more realistic and varying conditions, field experiments were conducted by placing steel plates in the median of the road between the northbound and the southbound lanes (4). Five painted and five unpainted steel plates were mounted on a stand (see figure 2). The painted steel plates were provided with a scratch to be used for evaluating the formation of cracks and scaling due to corrosion. Two stands were placed at the test and control sections, respectively. One stand facing the northbound lane and the other facing the southbound lane (see figure 3). The atmospheric corrosion rate was monitored with five unpainted plates placed a far distance from the road at each section (see figure 4). By subtracting the atmospheric corrosion from that of the specimens at the road side the corrosive influence from the road environment could be evaluated.
After the first winter the steel plates were taken down, the rust was removed and the weight loss of the plates was determined. The test was repeated with new steel plates the second winter.
Figure 2. Steel plates ( 5 painted and 5 unpainted) for corrosion test.
Figure 3. Panel with steel plates for corrosion test placed between the north bound and the south bound lanes of Highway E4.
Figure 4. Steel plates for monitoring the atmospheric corrosion.
RESULTS AND DISCUSSIONS
Laboratory tests Ice melting rate
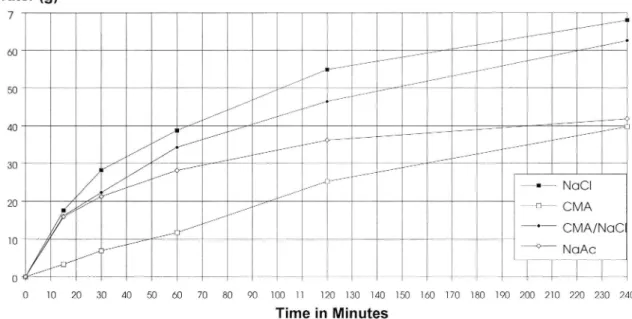
The ice melting rates at - 6°C for NaCl, CMA, a 20/80 weight-% mixture of CMA/NaCI and Sodium Acetate
(NaAc) are shown in figure 5 below. It can be noted that CMA has a considerably lower melting rate than NaCl. Especially, CMA has a very slow initial melting effect compared to NaCI. The melting rate for the CMA/NaCI mixture is, however, not very much lower than for NaCl. The same relations have been determined also at lower temperatures, but the slower melting effect of CMA is then even more pronounced.
Meltwater (g)
7 I 60 /// /<> /||// /// / / /4>/1 / // / f/f å 40 .. / 1,4 ///2/ // //<>/ //<> " /// 30 / / // // || >/ /
é/
.//
_ _
;?
//
- N06!
20
I///Ä
//+ CMA
10 )/(> 3/ ' CMA/NGCÄ
/D// //
""O" NoAc
o {A
l l l l
0 10 20 30 40 50 60 70 80 90 100 11 120 130 140 150 160 170 180 190 200 210 220 230 240 Time in MinutesFigure 5. lcemelting rate at - 6 °C for different de-icers. The amount of de-icer spread on the block of ice is 10 g.
Corrosion
According to the results from the corrosion test in the climate chamber the CMA/NaCI mixture reduced the corrosion rate of steel by 45 % compared to NaCI. The results from the laboratory test are presented in figure 7 (and 8) together with the results from the corrosion tests in field.
Freeze/thaw test
The concrete scaling obtained after 56 cycles of freezing and thawing are shown in table 1. As expected, the scaling of the old type of concrete (A) caused by NaCl is very extensive. The concentration of the solutions used in the test is chosen to be 3 % since earlier experiments have shown that the degradation caused by NaCl has a peek at this concentration (6). When NaCl is partly replaced by CMA in the solution the scaling is significantly reduced. The scaling caused by NaCl on modern, air-entrained concrete (B) is very small, but even here a reduction can be observed when NaCl is partly or fully replaced by CMA. Table 1. The scaling of three different qualities of concrete after 56 freeze/thaw cycles. A is an old type of concrete, B and C are two different modern types of concrete with air-entraining agents added.
Alt. Solution Scaling (kg/m2)
A
B
C
1
NaCl 3 %
13.78
0.03
2
CMA/NaCl 20/80 weight-%
10.84
0.01
0.03
3
CMA/NaCl 40/60 weight %
3.79
0.01
0.01
4
CMA 3 %
0.01
0.01
5
CMA 10 %
0.01
6
CMA 20 %
0.01
Field test
De-icing performance
During the winter 1993/94 approximately 10% more applications of de-icing agent were made and about 17 % more material was spread on the control section with NaCl than on the test section with CMA/NaCI. Maintenance personnel explained the difference by saying that when they applied NaCl to the control section, they sometimes judged that the CMA/NaCl was having a longer lasting effect and did not need to be applied again to the test section. Nine storms and approximately three times as many applications of chemicals were followed closely by monitoring the skid resistance. According to the friction measurements the CMA/NaCl mixture worked as well as, and in some cases even better than NaCl in situations with slippery conditions. There were also situations when NaCl worked better but these were not as frequent as the opposite.
The winter 1994/95 the locations of the test and control sections were switched and almost the opposite results compared to the first winter were obtained. Approximately 10 % more applications were made and as much as 28 % more material was totally spread on the test section. This result led to the conclusion that the difference in application rate and amount of chemicals on the test and control sections mainly was due to different local climates along the sections. The operational effects were studied during six storms and the friction measurements showed also this winter that it was possible to obtain the same de-icing with the CMA/NaCl mixture as with NaCl.
As an example the skid resistance monitoring performed during one storm in Mars 1995 is shown in figure 6.
Lane 1, South bound
I I | l l
+Nac| (13)
+Nac1 (11)
E CMA/NaCl (9)
x Precipitation Fr ic ti on . Appl. NaCl o Appl. CMA/NaClPr
ec
ip
it
at
io
n(
1/1
0m
m)
Mars15-17Figure 6. Friction measurements conducted in the north bound driving lane during a snow storm in Mars1995. The numbers in parenthesis refer to the sampling sections.
Corrosion
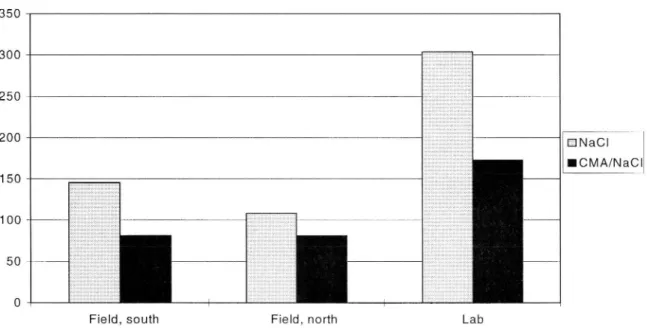
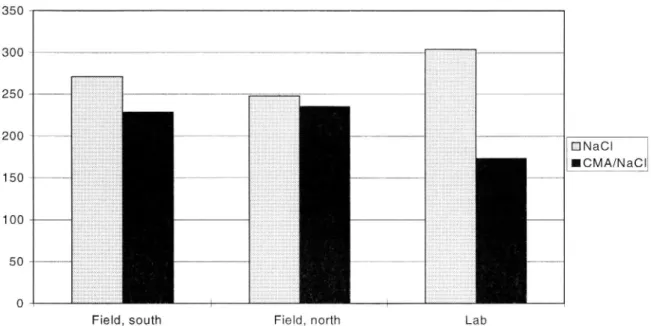
The results from the field test the first winter pointed in the same direction as the results from the Iaboratory test, i.e., the corrosion rate is reduced by adding CMA to NaCI (see figure 7). The reduction was, however, not as large as in the laboratory test. There was also a difference between the north bound and the south bound directions. The reduction of the corrosion rate for the CMA/NaCI mixture was approximately 45 % on the plates facing the south bound lanes and 20 % on the plates facing the north bound lanes. The difference in the two directions can be due to wind directions or traffic influence. The difference in corrosion rate for the CMA/NaCI mixture and NaCl is not only explained by the materials, but depends also to some extent on the difference in number of applications and amount of material spread. The first winter more applications were made and a larger amount of material was spread on the control section where the highest corrosion rate was also obtained.
The second winter, when the test and control sections had been switched, the situation regarding the number of applications and amount of material was the reverse. Even though more chemicals were spread on the test section the corrosion rate was still lower than at the control section (see figure 8). The reduction of the corrosion rate for the CMA/NaCI mixture was, however, considerably smaller than the first winter. The reduction was approximately 16 % on the plates facing the south bound lanes and 5 % on the plates facing the north bound lanes.
Weightloss (glmz) 350 300 250 200 INaCl lCMA/NaCl 150 100
50
Field, south Field, north Lab
Figure 7. Corrosion tests performed during the winter 1993/94. The histogram shows the results from field exposures at both the south bound and the north bound lanes. For comparison the results from laboratory experiments performed in a climate chamber are also presented.
Weightloss (glmz) 350 300 250 200 lNaCl ICMA/NaCl 150 100 50
Field, south Field, north Lab
Figure 8. Corrosion tests performed during the winter 1994/95. The histogram shows the results from field exposures at both the south bound and the north bound lanes. For comparison the results from laboratory experiments performed in a climate chamber are also presented.
CONCLUSIONS
During the period 1993 1995 a mixture of 20/80 weight-% CMA/NaCl was evaluated both in laboratory and
in field tests. The results from the tests are summarised below.
De-icing properties:
Laboratory tests have shown that the 20/80 weight-% CMA/NaCl mixture has the same ice melting capacity as salt.
Friction measurements have shown that the 20/80 weight-% CMA/NaCl mixture works as well as NaCl in most situations with slippery conditions.
There has not been observed any longer lasting effect of the 20/80 weight-% CMA/NaCl mixture than of NaCl.
Corrosion:
Corrosion tests in a climate chamber resulted in a reduction of the corrosion rate by 45 % for the CMA/NaCl mixture compared to NaCl.
Also in the field tests the 20/80 weight-% CMA/NaCl mixture gives a certain reduction in corrosion rate compared to NaCl. The reduction is, however, not as large as in the laboratory tests.
Concrete:
On concrete of poor quality a very large scaling is observed for NaCl in freeze/thaw tests. The scaling is considerably reduced by replacing some of the NaCl with CMA.
On modern, air-entrained concrete of good quality the scaling is very small even for NACI. Still a reduction of the damage can be observed for the 20/80 weight-% CMA/NaCl mixture.
The price for CMA is about 20 times the price for NaCI which means that the 20/80 weight-% CMA/NaCl mixture is about 5 - 6 times more expensive than NaCI. Even though a cost/benefit analysis has not been done it is doubtful if the benefit from particularly the reduced corrosion is large enough to compensate for the high price. Furthermore, the environmental effects of CMA have not been considered in this study. Many studies have shown that CMA is less harmful to the environment than NaCI. However, when CMA is decomposed oxygen is consumed. The decomposition rate is strongly temperature dependent and low temperatures may lead to the accumulation of nondecomposed acetate in soil and water. A very restrictive use of CMA was recommended in a Finnish study since it had been observed that the infiltration of nondecomposed acetate into deep soil can be rather significant (7).
ACKNOWLEDGEMENTS
This work has been sponsored by the Swedish National Road Administration.
REFERENSES
1. Öberg, G., Gustafson K. och Axelson, L.: More effective de-icing with less salt. Final report of
the MINSALT-project, VTI Report 369 SA, 1991.
2. a) K. Gustafson: Test with Clearway 1 on Örnsköldsvik airport 1988-04-05--08, VTI Notat V 63,
1988 (In Swedish).
b) K. Gustafson: Test with potassium acetate (Clearway 1) for de-icing of runways, VTI Notat 11/93, 1993 (In Swedish).
3. Bohlmann, B. W.: 1990-92 Salt Additives and Alternatives Lab Study, Minnesota Department of
Transportation, 1993.
4. Jutengren K.: Evaluation of salt (NaCl) with CMA-additive regarding the corrosivity by field
trials in the Nyköping area, SP AR 199526, Swedish National Testing and Research Institute, 1995 (In Swedish).
5. Lundgren, M. och Andalen, A.: A study of the influence of different de-icing agents on the
freeze/thaw resistance of concrete, SP AR 9584 3905, Swedish National Testing and Research Institute, 1995 (In Swedish).
6. Verbeck, G J and Klieger, P.: Studies of salt scaling of concrete, Highway Research Board,
Bulletin no 150, p 1-13, 1957.
7. Yli-Kuivila, J.: Infiltration Studies of CMA by Finnish National Road Administration in Winter
1993-1994, Finnish National Road Administration, Traffic Services, Internal Publication 34/1994 of FinnRa, Helsinki, Finland.
Lars Bäckman & Lennart Folkeson 1
THE INFLUENCE OF DE-ICING SALT ON VEGETATION, GROUNDWATER AND SOIL ALONG TWO
HIGHWAYS IN THE SOUTH-WESTERN PART OF SWEDEN DURING 1994
ABSTRACT
During spring 1994, vegetation damage, of a remarkable and previously unknown extent, was observed along many heavily used roads in southern Sweden. The purpose of the present investigation was to determine the cause of vegetation damage along the Highways E20 and 48 by means of a damage survey and measurement of sodium and chloride concentrations in pine and spruce needles, groundwater and soil. At the same time, changes in salt concentration in groundwater and soil in two previously studied
areas close to the E20 were documented.
The extensive damage to vegetation can probably be attributed to three interacting factors: the large amount of de icing salt applied during winter 1993/94, the lateness of the last salting and the hot, dry weather during the budding season. This conclusion is supported by the damage observations and the very high sodium and chloride concentrations in pine and spruce needles along the roads. ln extreme cases, the sodium concentration was >1,000 ppm (dry wt.) in current year needles and >5,000 ppm in needles from the previous year. The concentrations decreased rapidly with increasing distance from the road and similarly, the needles in branches turned towards the road had higher salt concentrations than needles in branches in other directions.
The groundwater and soil from an area along the E20 showed greatly increased sodium and chloride concentrations, especially next to the road, compared with previously measurements. The increased concentration can only be explained by the increase in road salting.
BACKGROUND
During early summer 1994, extensive damage to vegetation was observed along heavily used roads in large parts of southern and central Sweden, including clear signs of damage along Highways E20 and 48 in Skaraborg County. It was suspected even at an early stage that the damage was the result of road salting.
During the late 70s, the VTI had carried out a study of the environmental influence of road salt based on seven observation areas in Skaraborg County where samples of soil, groundwater and vegetation were taken. The areas were followed up from spring 1978 to autumn 1979. The results showed increased salt concentrations in several areas resulting from the use of road salt (Bäckman 1980).
To study the long-term effects of winter road salting, the VTI performed further sampling of groundwater and soil in 1988 in three of the observation areas, but limited the samples to groundwater and soil. The
results indicated that one area continued to be largely unaffected by salting, another showed a further
increase in already high salt concentrations and the third had an unchanged high level of salt
concentrations (Bäckman 1989).
The purpose of the present investigation was to contribute to identifying the causes of vegetation damage along Highways E20 and 48 in Skaraborg County using damage inspections and sodium and chloride analysis of conifer needles, groundwater and soil. In addition, changes in salt concentrations in groundwater and soil in two previously investigated areas along the E20 were documented (Bäckman & Folkeson 1996).
WINTER SALTING AND METEOROLOGICAL AND HYDROLOGICAL CONDITIONS IN THE AREA
ln comparison with earlier years, road salt consumption by the Swedish National Road Administration
(SNRA) was very high in winter 1992/93 and especially in winter 1993/94, both in Skaraborg County and in
Sweden as a whole (Table 1). ln spring 1994, the last salt applications on the E20 took place relatively late, 25 March and 3 April.
Lars Bäckman & Lennart Folkeson 2
In the survey area the E20 has an ADT of 5,000 8,500, with a large proportion of heavy vehicles (15-20 %)
Table 1. Salt consumption (tonnes) by the Swedish National Road Administration.
Skaraborg All Sweden
County
Winter 1991/92
24,000
210,000
Winter 1992/93
26,000
330,000
Winter 1993/94
31,000
420,000
In the particular area, the period April May 1994 was dry and precipitation 47 55% of normal. The temperature was unusually high for 4 5 weeks beginning on 22 April. During April 1994, the groundwater level in the county was almost normal, unlike areas to the north and south where the groundwater level was higher than normal. In May, the ground-water level was lower than normal.
FIELD METHODS
Inspection
The extent and character of the vegetation damage along Highways E20 and 48 was inspected in the beginning of June 1994. The damage was discussed with SNRA personnel and several university experts. Needle sampling
In June 1994, samples of current year needles and the previous year's needles on Scots pine and Norway spruce twigs were collected. This included sampling at two of the VTI's earlier sampling areas, R4 and R6 (see below). The samples were taken at different distances from the road, different heights above the ground and different orientations to the trunk. Sampling was also performed on two spruce hedges, one parallel to Highway E20 and one perpendicular to it.
The distance from the road was measured from the edge of the asphalt. Unless otherwise specified, samples were taken from twigs about 2 3 m above the ground.
Groundwater and soil sampling
Sampling of groundwater and soil was performed in two previously established observation areas on the E20 between Götene and Mariestad.
At one of the areas (R4), the road is built on a low embankment and consequently there are no proper ditches. The area is bordered to the east by a stream. The clay in the area is covered by a comparatively thin (1.0 1.5 m) layer of fine/medium sand. The groundwater level is mostly high, although during dry periods it may fall below the level of the sand layer. The groundwater flows slowly towards the north east, i.e. parallel to the road. Since the road's longitudinal profile also slopes towards the north east, the area receives water from a relatively long stretch of the road immediately to the south west.
The other area (R6) is level with the road, from which it is separated only by a normal ditch. Geologically, the area resembles area R4, with a relatively thin layer of fine/medium sand overlying clay. Unlike area R4, however, the sand layer contains more medium sand, which probably makes the layer somewhat more permeable to water. During spring and autumn, the groundwater level is high, about 0.5 m below the ground surface. In dry periods during the summer, however, the groundwater level may fall below the level of the sand layer.T he groundwater flows in a westerly direction from the road.
During spring 1978, groundwater pipes were installed in the two areas. The pipes were installed with the perforation 0.5 1.5 m below the ground level, i.e. in the sand layer.
Sampling of the groundwater was performed in the beginning of June 1994. The groundwater levels were then very low, and sampling was therefore not possible in all of the pipes.
Soil sampling was performed in the beginning of July 1994. Samples were taken from two to four levels down to 165 cm depth below ground level close to each groundwater pipe. It should be noted that samples were taken only in the sand layer since it was likely that fossil water, which has its origin in the Baltic seas earlier stages of development, could occur in the underlying clay.
Lars Bäckman & Lennart Folkeson 3
RESULTS
General damage situation in the area
A majority of the trees and bushes along both the E20 and 48 in Skaraborg County showed clear signs of damage. The damage appeared on most species of tree and bush, both in gardens and in agricultural and forested areas. It took the form of bare or dead branches, twigs or shoots, lack of emerging shoots during the latest spring, red brown needles from the previous year (pine), or generally sparse foliage. In general, the damage was by far the most pronounced in the immediate vicinity of the road. Trees and bushes nearest the road showed the most severe damage. There was no difference in vegetation damage on the two sides of the road. In the woods, the damage decreased rapidly with increasing distance from the road, in particular in dense stands. At sites with sparse stands or isolated trees or bushes, or where insufficient shelter by other trees was provided, the damage also appeared at greater distances from the road (at least
50 m). The damage was thus closely related to exposure to the road. Similarly, noise barriers seemed to
provide good protection: often, the part of the tree exposed above the barrier showed clear signs of damage while the sheltered part of the tree was relatively undamaged.
Visible damage to coniferous trees
On small pine trees very close to the road, all the foliage was often red brown, sometimes with the exception of the top shoot. On somewhat less exposed pines and also on older pines, damage usually
occurred only on branches facing the road. Similarly, the lower branches were often more damaged than
the upper branches, the top shoot being completely unaffected.
On exposed pine branches, the current year shoots had often completely failed to emerge, especially where the previous year's needles were red brown. However, it was not very unusual for shoot formation to have taken place also from branches where the previous year's needles were completely red brown and where no older needles were present.
Remarkably enough, the spruce showed a different damage image. Close to the road, small spruces and exposed branches of larger trees generally lacked needles from previous years, but also these branches had to a large extent succeeded in producing shoots in 1994. On fresh spruce shoots from the current year, the young needles had a healthy bright green colour. Because of these bright green current year shoots, the spruces near the road left a relatively healthy impression at a superficial inspection. It should be noted that the striking bright-green colour of the growing needles distinguished the spruce from
the pine, whose new shoots had a dark green colour from the beginning. Another factor that strongly
influenced the difference in visual impression between the species was that the red brown needles from the previous year were still in place on the pine trees, while the spruce trees had already shed their dead needles.
introduced coniferous species such as cypress, arborvitae etc. had also been damaged. However, damage in gardens was not registered systematically.
Visible damage to deciduous trees and bushes
ln gardens and elsewhere along the roads, extensive damage was observed in nearly all species of deciduos trees and bushes. The damage appeared mainly as sparse foliage, dried up twigs and twigs that had produced no buds, and failure to flower.
Salt concentrations in needles
ln every case, needles from the previous year had many times higher sodium concentrations than needles from the current year, both in high and low salt loading. The chloride concentrations were however more similar between the different year growths of needles: often, the previous year's needles showed higher concentrations than the current year's needles, although seldom more than twice as high.
Samples taken close to the road showed heavily increased sodium and chloride concentrations both in needles from the current year and those from the previous year (Figures 1-2).
The chloride concentration was greatly increased within about 10 30 m of the road, but the concentration was on the same level at a distance of 48 m as at 98 m. Even at 98 m, the chloride concentration showed a certain increase compared with normal concentrations according to the literature. However, it should be added that the studied area lies only 120 180 km from the sea and that salt can be transported long distances by the wind.
A tall spruce tree showed a large increase in concentration of both sodium and chloride in the lowermost branch and a certain increase in sodium concentration in the previous year s needles up to a height of 9 m.
Lars Bäckman & Lennart Folkeson 4
With few exceptions, the needles on branches facing the road had many times higher concentrations of both sodium and chloride compared with branches facing away from the road. The fact that a dense spruce hedge along the road can offer effective protection is shown by the low sodium and chloride concentrations in needles on the lee side of the hedge compared with the high concentrations in needles on twigs facing the road, which showed extensive damage (Table 2).
In needles from extremely exposed trees, very high concentrations were recorded: for sodium sometimes over 1000 ppm in the current year's needles and 5000 ppm in the previous year's needles, and for chloride sometimes over 8000 ppm in both years' needles. In brown previous year's needles of a dying pine, the sodium concentration was 1.7% and the chloride concentration 2%.
Na (ppm)
1000 a
Figure 1.
Previousyea r s need les
C urrent
&
year s need les
\
&-X_X_ X [ X I I
I I I I
20 40 80 100
Distance (m)
Concentrations of sodium in need/es from pine trees at various distances from Highway E20.
ppm = pg (9 dry wt)".
Cl(ppm)
Figure 2.
C un'ent year s need les
_ Previousyea I"s need les
I I I I I
I I I I 7
20 100
Didance (m)
Concentrations of chloride in needles from pine trees at various distances from Highway EZO.
Lars Bäckman & Lennart Folkeson
Table 2. Sodium and chloride concentrations in need/es from a spruce hedge on the E20.
ug (g dry wt)".
Na
Na
CI
Side of the Previous year s Current year s Previous year s Current year s
hedge
needles
needles
needles
Facing road 744 62 4280
Facing garden 358 28 2470
Salt concentrations in groundwater and soil
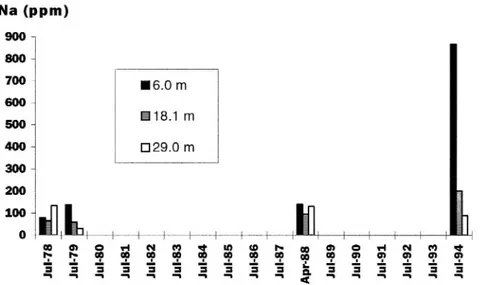
Compared with the earlier samplings, the sodium and chloride concentrations in area R4 were greatly increased in 1994 both in the groundwater and soil samples (Figs. 3). The concentrations were increased at all sampling points, but the greatest increases were measured in those points nearest the road. The concentrations also showed a very clear relationship to distance from the road.
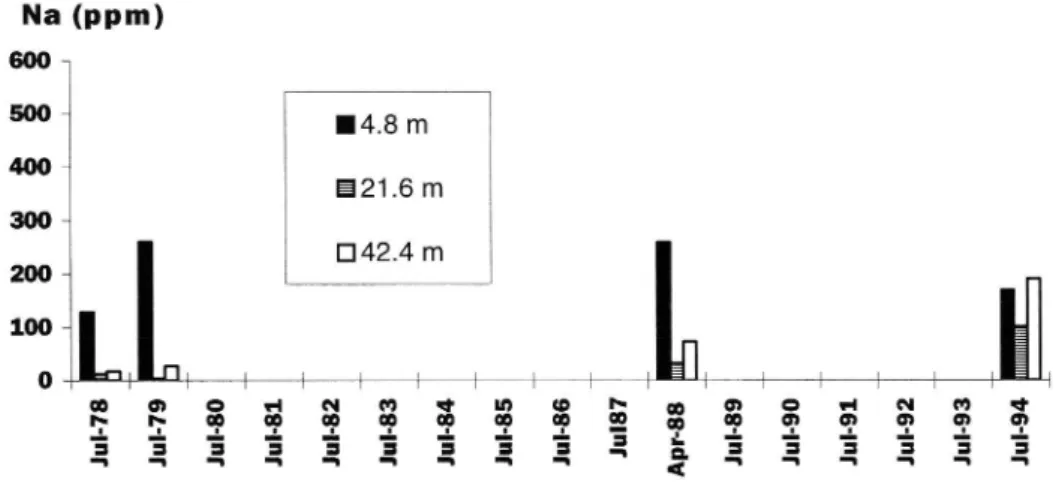
The sodium and chloride concentrations in area R6 in 1994 mainly remained on the relatively high levels measured earlier , i.e. no significant increase in concentrations was observed (Fig. 4). It should be noted that at the two sampling points nearest the road the concentrations were highest at a level 0.5 m below the ground surface not shown).
Na (ppm)
900 _ 800 _70°
l6.0m
518.1 m
400- E]291)n1 Ju l 78 Ju l 79 Ju l 80 Ju l 81 Ju l-82 Ju l 83 Ju l 84 Ju l 85 Ju l 86 Ju l 87 Ju l-89Figure 3. Sodium concentrations in soil (0 15 cm depth) sampled at different distances from the edge
of pavement. Area R4 on Highway E20.
Ju l-90 Ju l-91 Ju l-92 Ju l-93 Ju l-94
Lars Bäckman & Lennart Folkeson 6 Na(ppm) sona 500 l4.8m 400 e21.6m 300 D42.4m 200 100
0
lllllllllllllll
wmc memwhwmc me hqwmcpwwwwgwwmqmmm sssssssssagsssssa q-u-u-u-lH i-n-s (___ __!Figure 4. Sodium concentrations in soil (0 15 cm depth) sampled att different distances from edge of
pavement. Area Rö on Highway E20. DISCUSSION
Vegetation
Vegetation damage along roads
Nearest the road, the vegetation is generally exposed to severe conditions as a result of several interacting stress factors. In many cases, this may lead to generally weakened condition making the vegetation close to the road predisposed to damage from exhaust emissions, road salt and other pollutants, as well as attack by pathogens (fungi) of various types.
Damage situation for coniferous trees
The observed damage to the conifers is clearly of a physiological nature. The red brown colour, often of the whole needle but initially at its tip, is typical of drying out as a result of salt. Salt accumulation can produce rapid discolouration and die back of needles.
On the other hand, it is probable that the pollution load in combination with unfavourable meteorological conditions causing frost drought or water stress during previous years may have weakened those trees that showed damage in 1994. During spring and early summer 1993, the spruce was exposed to severe frost drought on a large scale in southern Sweden, including Skaraborg county. In many cases, the lack of previous year's needles observed during early summer 1994 may be attributed to frost drought during spring 1993.
Sodium and chloride concentrations in needles
According to the literature, the sodium concentration in pine and spruce needles is normally between 50 and 200 ppm (pg per g dry wt.) and sometimes up to 1000 ppm (Brod 1993). This probably applies to needles from the previous year and before. In the samples of previous year's needles analysed here, sodium concentrations lower than 200 ppm were observed only in a spruce tree 98 m from the road, in the spruce hedge at a distance of 38 m from the road, in two pine trees 48 m and 98 m from the road,
respectively, and in a pine branch 19 m above the ground. In the investigations carried out in 1978 79 along the particular section of the E20, the background concentration in the previous year's needles was about 60 80 ppm (Bäckman 1980). The highest concentrations recorded in the present investigation, several thousand ppm, must be considered very high. Needles on small, dying trees had concentrations of over 4000 ppm and in completely brown pine needles 17,000 ppm was recorded. In the investigations carried out in 1978 79, it was found that trees with sodium concentrations over 5000 ppm in needles regularly showed damage in the form of dying needles and branches (Bäckman 1980).
In the case of salt damage, the chloride ion is considered more indicative than the sodium ion. The extent of visible vegetation damage is often stated to be closely related to the chloride concentration in the
Lars Bäckman & Lennart Folkeson 7
tissues. In the literature, needles (probably the previous year's needles and older needles) are stated normally to have chloride concentrations of 500 800 ( 1300) ppm. Concentrations over about 2500 3500 are considered toxic. Other information indicates 4000 6000 ppm as a lower limit for the occurrence of damage. In one investigation, the needles on dying spruce trees proved to have chloride concentrations of 4500 10,000 ppm. An investigation of coniferous trees influenced by salt in highway storm water revealed chloride concentrations of 13,000 15,000 in damaged spruce trees, while undamaged spruce trees had concentrations below 1500 ppm. For current year's needles on spruce trees, a long-term investigation gives 3000 ppm as the lower limit for the occurrence of road salt damage. The spruce is stated to be somewhat more sensitive to salt than the pine. Similarly, coniferous trees, which are evergreen, are generally stated to be more sensitive to salt damage than deciduous trees (Brod 1993).
Damage situation in deciduous trees
In regard to deciduous trees, the damage in the survey area was of a remarkable and previously unknown extent. The damage to deciduous trees that appeared in 1994 was, as in the conifers, probably the result of a combination of salt load and other stress factors over a series of years. The birch was probably weakened by drought stress following very hot, dry weather during spring/early summer both in 1993 and particularly in 1992.
Foliar uptake or root absorption
The sodium and chloride ions in the salt can reach the leaves or needles both by foliar uptake and by root absorption. The fact that needle discolouration and lack of shoot formation in the present study were clearly limited to the most exposed branches and twigs indicates that transport took place mainly through direct spray and aerosol deposition on the foliage, and that root absorption did not play a major part, at least concerning the rapid damage. ln root absorption, the damage would not have been so clearly limited to the directly exposed branches and twigs.
Even if the observed damage is probably more attributable to direct deposition on the foliage than to root absorption, it cannot be excluded that unfavourable soil conditions, such as salt stress and drought, during earlier periods may have weakened the vegetation and made it predisposed to damage. Salt influence via the roots during a long series of years may thus have contributed to a deterioration of the tree's growth conditions.
Road salting and weather
In addition to the quantity of salt applied, the timing and the weather conditions are stated to be among the
most important factors controlling the occurrence of salt damage along roads (Brod 1993). It is likely that
one of the main causes of vegetation damage can be found in the high salt application in the area during winter 1993/94 and that salting was carried out relatively late in the season. The hot, dry weather during the period of bud swelling, bud unfolding and shoot formation has probably contributed greatly to the occurrence of damage or at least aggravated it.
Groundwater and soil
A conclusion from the earlier investigations in the area (Bäckman 1980) was that there is no clear and unambiguous relationship between the salt quantities spread on the road and the salt concentrations occurring in the surrounding natural environment. A certain quantity of salt may thus give rise to high concentrations in soil and groundwater in one area, while the same quantity of salt would lead to no observable salt increase in another area. Instead, it is the geological and hydrological conditions that determine the extent to which an area is affected by salt pollution.
From the pollution aspect, both the investigated sites on the E20 (R4 and R6) are considered to have unfavourable hydrogeological conditions with permeable surface soil layers, high groundwater levels and very poor water renewal rates (flat topography). This is also confirmed by the raised salt concentrations in soil and groundwater throughout the follow up period (1978 1994).
It is difficult to determine with certainty what makes area R4 appear to be considerably more influenced
than area R6 in 1994. A contributory cause is naturally the fact that area R4 receives salt from a
considerably longer section of road. The somewhat more permeable soil layers in area R6 may also contribute to the incoming quantities of salt being transported away more quickly. Another possible explanation is that there have been differences between the two areas in the salt quantities applied over the years.
Lars Bäckman & Lennart Folkeson 8
It is worth noting that both R4 and R6 are located in a low lying area which was covered by sea water after the latest deglaciation. The fine grained sediments (principally clays) deposited in this salt water still contain considerable quantities of salt. As a result, the area has a relatively large number of salt polluted wells. However, the salt concentrations in soil and groundwater reported here are not considered to be influenced by these conditions since sampling, both of groundwater and soil, has been performed only in the sand layers overlying the clay. Because of the permeability and the water renewal rate, it is unlikely that any fossil water of marine origin remains in this layer.
CONCLUSIONS
Relation to road/traffic: The extent of the vegetation damage clearly shows that this is related to the road (and its traffic).
Road salt: The very high concentrations of sodium and chloride in the needles indicate that road salt plays a decisive, or at least dominating, role in the occurrence of the damage.
Direct foliar uptake versus root absorption: In regard to salt transport to the needles, direct foliar uptake probably plays a more important role than root absorption. This is supported by two observations, the damage situation for branches with varying exposure to the road, and the difference in the salt concentration in the needles with varying exposure and height above the ground.
Triggering factors: The fact that the damage is so great is probably due to three interacting factors: the large quantity of salt applied during the salting season in 1993/94, the lateness of the last salt application and the very hot, dry weather during bud unfolding.
Predisposing factors: The large quantity of salt applied also during winter 1992/93 has probably contributed to the damage that occurred during spring 1994. The unusual weather conditions during 1993 may also have had a certain influence. The growth conditions for the vegetation nearest roads with heavy traffic are often unfavourable.
Groundwater and soil: Groundwater and soil showed clearly increased salt concentrations in the two
areas studied on the E20. The large increase in concentration in one of the areas during summer 1994
cannot be explained in any other way than by a large increase in road salting.
RECOMMENDATIONS
In order to reduce the influence on vegetation, groundwater and soil nearest the roads, it is important both to minimise the total salt consumption and to avoid salting late in the season, i.e. during the last few weeks
before bud unfolding.
REFERENCES
Bäckman, L. & Folkeson, L.: The influence of de-icing salt on vegetation, groundwater and soil along Highways E20 and 48 in Skaraborg County during 1994. VTl Meddelande 775A. 1996.
Brod H. G.: Langzeitwirkung von Streusalz auf die Umwelt. Berichte der
Bundesanstalt fiir
StraBenwesen, Verkehrstechnik, V 2. Bergisch Gladbach. 1993.
Bäckman L.: Vintervägsaltets miljöpåverkan. VTI Rapport 197. 1980.
Bäckman L.: Vintervägsaltets miljöpåverkan Uppföljning av miljöundersökningar i Skaraborgs län.
Gudrun Öberg, VTI
1
WINTER TYRES SOCIO-ECONOMIC CALCULATIONS
by Gudrun Öberg
Swedish National Road and Transport Research Institute ln general
Sweden has 8.7 million inhabitants, 5.3 million have driving licences and the amount of vehicles reaches 3.9 million (1). The total road length is about 415 000 km. Almost 100 000 km are State-administered ro-ads and 38 000 km are municipal roro-ads and all roro-ads trafficable with cars are 420 000 km. The vehicle mileage is almost 70 billion vehicle km (2). More than 80 000 accidents are reported by the police during one year. ln 1993, 632 persons were killed in traffic accidents (28). The traffic safety level in Sweden is high as can be seen from the figures in the table below.
Killed/100 000 inhabitants 7.2
Killed/10 000 vehicles 1.6
Killed/100 mil. vehicle km 0.9
In socio-economic calculations the accident costs are calculated according to the formula:
OLKOST=(a -EO+b -LS+c -SS+d -D)/ANTOL
where
a = SEK 100,000 b = SEK 230,000
C = SEK
5,400,000
d = SEK
12,100,000
The costs, including human value, are according to the 1992 price level of a police reported accident invol-ving property damage (EO), a slightly injured person (LS), a seriously injured person (SS) and a fatality (D). ANTOL is the number of police reported accidents.
The average accident cost for the whole year is for rural areas SEK 1,300,000 and in urban areas 520,000. The costs include also the accidents that are not reported to the police.
Background to the winter tyre project
During the winter 1993/94, the Swedish National Road Administration received considerable criticism for its winter maintenance and in particular for the high consumption of road salt. This led to discussions on changing the rules for winter maintenance, allowing a little ice/snow on the road and more roads with ice/snow were to be permitted. In addition, certain changes intended to influence vehicle equipment and driver behaviour were to be studied.
The purpose of the investigation described here is to calculate the socio-economic consequences that may be expected from a requirement on winter tyres in various circumstances.
The study started with a calculation of the socio-economic consequences that may be expected from a ban of studded tyres. That calculation was made to compare with earlier calculations. In this speech that result is transformed into the effect of the use of winter tyres in the winter compared to if all cars used summer tyres. The calculations were made for winter 1993/1994 and for winter 1999/2000. The conditions in winter 1993/1994, a fairly normal winter, form the basis for the calculations. The conditions in 1999/2000 are the same except for the assumptions that all those using studded tyres then will be using lightweight studs and that wear resistant pavements will be more common. All other factors, such as winter maintenance, will be the same as in 1993/1994.
Gudrun Öberg, VTI
2
Studied effects
The following effects are included:
Accidents (direct: at slipperiness; indirect: because of pavement wear) Road wear (pavement and road markings, cleaning signs)
Car costs (tyres/rims, fuel consumption, washing) Environment (car washing)
The effect of the use of winter tyres compared to all cars using summer tyres
The effects on road safety that are used are a 40 % decrease in accidents in icy/snowy road conditions on rural roads when using studded tyres and a 35 % decrease in accidents in built-up areas compared with summer tyres. The corresponding figures for other winter tyres are 25 % and 20 %. Each type includes both good and bad tyres in use at the beginning of 1990.
The results obtained that the use of winter tyres indicate an accident decrease of about 7,500 acci-dents/winter. There are also indirect accident effects, caused by the use of studded tyres, such as higher wet friction on pavements, since the studs create a coarse surface texture. They produce wheeltracks and dirt spray. The sum of these indirect effects is an accident decrease of 600-700 accidents. The number of
fatalities in road accidents have decreased by somewhat about 40, seriously injured around 350 and
slightly injured about 1,500. The values are uncertain.
When measuring road wear from traffic with studded tyres, the SPS index is normally used. SPS is the Swedish abbreviation for specific wear and indicates the number of tonnes of abraded asphalt per kilomet-re of road and million vehicles with studded tykilomet-res, or the number of grams of abraded asphalt per kilometkilomet-re of road and vehicle with studded tyres. The average SPS index has been calculated for roads with various AADT. With steel studs, the SPS index varied between 22 and 35 g/km for the various classes of traffic, with an average of 26 g/km. The SPS index for lightweight studs is half this figure.
During winter 1993/94, it is estimated that 17 % of the vehicles with studded tyres had lightweight studs. This gives a weighted SPS index of 24 g/km, which implies total wear of 300,000 tonnes, valued at ap-proximately SEK 150 million. To compensate for winters with more troublesome wear levels, the cost of wear can be said to be in the range of SEK 150-200 million. Wear on road markings and washing dirt spray from road signs is estimated to cost SEK 35-70 million/year.
In 1999/2000, when all vehicles with studded tyres have lightweight studs and the wear-resistant pave-ments are more common, the average SPS index is calculated to be 11 g/km, giving total road wear of about 130,000 tonnes worth SEK 65-90 million at today's prices. Wear on road markings and dirt spray on road signs is put at SEK 20-35 million/year.
The costs for motorists using winter tyres have increased compared to if they use summer tyres the whole year. The motorist pays for winter tyres and extra rims, and also the cost of wheel changing. The annual
cost will be about SEK 330 million.
Petrol consumption is calculated to decrease by SEK 90 million owing to an assumed difference of 2 % between summer tyres and winter tyres. It is also assumed that no difference exists between studded and studless winter tyres.
The use of studded tyres, means that vehicles need to be cleaned more often since road wear increases.
In this study, two different calculations have been made. The first is that studs necessitate 2-4 extra
washes during a winter, and the second is that all 13 washes during the winter take somewhat longer and that half a wash extra is required. The first alternative gives a somewhat larger dispersion in costs and this alternative is therefore the one used. lt entails a cost to car owners of SEK 300-700 million which could be avoided. Owing to the road wear in 1999/2000, the cost will be only SEK 130-300 million.
Gudrun Öberg, VTI
3
Vehicle washing requires stronger agents than would be necessary if tyre studs were not used. Emissions of petroleum-based solvents, attributable to studded tyres would then amount to 1,500-3,000 tonnes for 1993/94. Based on the Swedish Swedish National Road Administration's environmental valuation, this would lead to an environmental cost of SEK 25-50 million/year. In 1999/2000, the environmental cost of
vehicle washing necessitated by the use of studded tyres will have fallen to SEK 10-20 million.
The use of winter and studded tyres entails the following cost changes compared to if all cars use summer tyres (SEK million/year).
Decrease Increase 1993194 1999/2000 Accidents direct 2,750 3,370 indirect 240 290 Road wear pavemen 150 200 65 90 road markings 35 70 20 35 signs Car costs tyres/rims 330 330 fuel consumption 90 90 washing 300 700 130 300 Environment car washing 25 50 10 20 the rest ? ? TOTAL 2,990 3,66O 930 1 ,440 645 865 +? +?
The effect of winter/studded tyres on accidents is considerable and the cost of the decrease in accidents because of the use of such tyres is not offset by other cost increases. The effect on the environment is, however, difficult to measure and evaluate, and therefore only vehicle washes are included in the above table. With the above results for the other effects, this means that the total environmental effect may become fairly large before equilibrium is reached. In or near the year 2000, the difference between the advantages and disadvantages of using winter/studded tyres will be even greater. The lightweight stud will then be the only type of stud available, leading to lower car and wear costs and thereby a reduction in
envi-ronmental effects, at the same time as the effect of studded tyres on road safety is maintained.
Requirement on winter tyres in slippery conditions
In the case of a requirement on winter tyres in slippery conditions, it is possible that: all vehicle mileage with summer tyres on ice/snow will be eliminated
vehicle mileage with summer tyres in icy/snowy conditions will be replaced by travel in bare road condi-tions
motorists will change to winter tyres.
In the calculations the requirement of using winter tyres are compared with the use in the winter 1993/1994 and 1999/2000. Most often, minimum and maximum alternatives for a redistribution of the vehicle mileage are calculated. It will then be possible to interpolate between these alternatives. The distribution of vehicle mileage among different tyres controls the change in benefit/cost implied by the various alternatives, based
Gudrun Öberg, VTI
4
on conditions in winter 1993/94. The distrubution used here is that out of the 23 % that now use only sum-mer tyres in the winter will after a requirement 15 % use studded tyres, 5 % use winter tyre and the last 3 % will not drive when it is slippery on the road.Requirement on winter tyres in slippery road conditions compared to the use of tyres in the winter
1993/94 (SEK million/year).
Decrease Increase 199311 994 1999/2000 Accidents direct 385 485 indirect 75 95 Road wear pavement 25 35 10 1 5road markings/signs
10
5
Car costs tyres/rims 200 200 - fuel consumption 30 30 - washing 50 120 20 50 Environment car washing 5 1 0 0 5 other costs ? ? TOTAL 460 580 320 405 265 305 +? +?The road safety benefit with this requirement is greater than the known negative effects of the requirement. ln sudden slipperiness, it is possible that some vehicle mileage with summer tyres will take place, which will decrease the highest traffic safety value above.
The number of car accidents reported by the police will decrease by 1,100 1,400, the number killed in traffic by 6 7, the number seriously injured by 50 60 and the number slightly injured by 200 250. The val-ues are uncertain.
Conclusions
The requirement of winter tyres will, compared to summer tyres, cause a decrease in accident costs by SEK 3,450 4,24O million/year. The increase in in road, car and environment costs will be SEK 1,250 1,845 million in 1993/94 and SEK 900 1,170 million in 1999/00.
The decrease in police reported accidents will be about 9,200 9,600 accidents/winter. This is a reduction of almost 30 % during the winter.
The result of this project is that the government suggest a requirement of winter tyres during slippery con-ditions. The suggestion has been referred to authorities for consideration. The decision will be taken in the autumn.
Gudrun Öberg, VTI
5
References
Statistical Yearbook of Sweden 1994. Statistiska centralbyrån. In English.
Thulin, Hans; Nilsson, Göran. Vägtrafik. Exponering, skaderisker och skadekonsekvenser för olika färdsätt och åldersgrupper. (Road traffic, exposure, injury risks and injury consequences for different travel modes and age groups) Statens Väg- och transportforskningsinstitut. Rapport 390, 1994. English summary.
Piggdekk og vintervedlikeholdsstrategi. (Studded tyres and winter maintenance in the Nordic Countries). Nordisk Vegteknisk Forbund, Rapport nr 6, 1992. English summary.
Nordström, Olle; Samuelsson, Elisabeth. Vinterdäcks väggrepp på is. (Road grip of winter tyres) Statens Väg- och Trafikinstitut. Rapport 354. English summary.
Carlsson, Arne; Nordström, Olle; Perby, Harald. Effekter av dubbdäck. Konsekvenser av ändrade bestämmelser. (The effects of studded tyres. Consequences of amended regulations). Statens Väg- och Trafikinstitut. Meddelande 674. English summary.
Carlsson, Arne; Centrell, Per och Öberg, Gudrun. Studded tyres. Socio-economic calculations. Statens Väg- och Transportforskningsinstitut. Meddelande 756A. In English.
Carlsson, Arne och Öberg, Gudrun. Winter tyres. Effects of proposed rules. Statens Väg och Transportforskningsinstitut. Meddelande 757A. In English.
Kallberg, Veli-Pekka. Uuden, vähan tietä kuluttavan nesta tyypin vaikututs liikenteen käyttö - kustan-nuksiin. (The effects of a new stud type on the running costs of road traffic). Meddelande 914. Statens Tekniska Forskningscentral, Väg- och trafiklab., 1988. In Finnish.
Hemdorff, Stig et al Trafiksäkerhet och vågytans egenskaper (TOVE). Slutrapport (Traffic safety and the properties of road surfaces. Final report). Statens Tekniska Forskningscentral. Medde-lande 1075, 1989. English summary.
Öberg, Gudrun; Junghard, Ola; Wiklund, Mats. En studie av metoder för att beräkna samband mel-lan dubbdäcksanvändning och trafiksäkerhet. (A study of methods of calculating the connection between the use of studded tyres and road safety). Statens Väg- och Trafikinstitut. Meddelande 722. English summary.
Gustafson, Kent. Prov med lättare däckdubb i VTls provvägsmaskin. (Test with lightweight studs in the VTl's pavement testing mashine). Statens Väg- och Trafikinstitut. Rapport 377. English summary.
Nationellt trafiksäkerhetsprogram, 1995-2000 (National Traffic Safety Programme, 1995-2000) Vägverket, Rikspolisstyrelsen och Svenska Kommunförbundet. In Swedish.