VTI särtryck
o. 265 ' 1996
afety Effects of Adaptive Cruise Controls
in Critical Traffic Situations
ena Nilsson
eprint from proceedings of Steps Forward, Volume III,
the Second World Congress on Intelligent Transport
ystems, Yokohama, Japan, November 9 11, 1995,
p 1254 1259
Swedish National Road and
VTI särtryck
No. 265 0 1996
Safety Effects of Adaptive Cruise Controls
in Cr'tioal Traffic Situations
Lena Nilsson
Reprint from proceedings of Steps Forward, Volume lll,
the Second World Congress on Intelligent Transport
Systems, Yokohama, Japan, November 9 11, 1995,
pp 1254 1259
Swedish National Road and
ISSN 1102-626X
'Transport Research Institute
Safety Effects of Adaptive Cruise Controls
In Critical Traf c Situations
Lena Nilsson
Swedish Road and Transport Research Institute (VTI), S-581 95 Linköping, Sweden ABSTRACT
Driving with Adaptive Cruise Control was studied during exposure to critical traf c situations in the VTI driving simulator. The traf c situations focused on functional limitations of the ACC concept. Driver behaviour was compared to unsupported driving and found to be differently in uenced depending on the situation (e.g. more collisions among ACC users than among unsupported drivers approaching a stationary queue). Reasonable explanations could be too high driver expectations and overlearned reactions. The effects could neither be explained by increased driver workload nor by decreased level of driver alertness. The ACC was well accepted in spite of its limited capability to handle certain situations.
1. BACKGROUND
Conventional Cruise Controls (CCs) are capable of automatically keeping a constant speed chosen and set by the driver. When speed changes are required during driving, e.g. in catching up and car following situations, the CCs cannot adapt the speed and the driver has to intervene and control the speed manually. Thereby the possibilities to use the CCS are limited to certain traffic conditions like low or smooth traffic ows and motor-way driving. To increase the CC usability and the possibility to reach the expected effects of increased driver comfort and traffic smoothness as well as reduced driver workload, Adaptive Cruise Controls (ACCs) are developed. In the ACCs the automatic speed keeping function is extended by automatic distance control. Thus, the speed is automatically adapted to the behav-iour of other vehicles, e.g. slower vehicles can be
followed at a safe distance, making it unnecessary for
drivers to take over the control in these situations. ACC solutions have been evaluated both on the road and in a driving simulator [1], [2]. The results indicate that the combination of automatic speed and distance control was generally well accepted by drivers, who experienced increased comfort and decreased workload when driving with the ACCs compared to unsupported driving. Furthermore, the minimum time headways were increased when the ACCs were used, indicating that the number of rear end collisions and near accidents caused by too short headways may be possible to reduce. Expressed worries that automatic support systems would
1254
result in too low levels of driver alertness, and thereby impair the drivers ability to react to unexpected events, were not supported for the ACCs. The reported positive effects were obtained during ordinary non-critical ACC supported driving on highway and motorway types of roads.
However, as ACCs are intended to be comfort systems
and not collision avoidance systems, they are not
designed to handle critical traffic situations. As critical situations usually appear unexpectedly and abruptly, proper and timely driver interventions are still needed in such situations in order to avoid incidents or accidents. Three types of limitations (there may be more) appearing in various ACC solutions may be
crucial in critical situations. First, the maximum
braking capability is limited. Reasons for such design are that the car can be dif cult to handle under hard braking, possibility of early recommendation to the driver to take over control leaving reasonable time for the action , and increased comfort (only comfortable decelerations and accelerations are performed). Second-ly, the adaptive control is automatically performed only within a certain speed interval. In both these cases, insufficient braking capability and out of functional range, the ACC knows that it cannot handle the situation. Thus, it is possible to present warnings asking the driver to take over control. A third limitation is that some ACC solutions do not consider (adapt to or warn for) stationary objects (vehicles, obstacles) in the used lane. The reason therefore is the limitations of available distance sensors. In this case the driver has to detect the situation and act properly by him lherself.
The purposes of the study were to investigate effects of ACC use on driver behaviour, acceptance and work-load when drivers were exposed to critical traffic situations, and to consider the possible impact on traffic safety. Will ACC drivers expect more from the automa tic system than it can provide, and when intervention is necessary react later and more abruptly than during manual driving? Will the reported positive attitudes towards ACCs be influenced by their behaviour in
critical situations? In case, system improvements both
from safety and acceptance points of view may be considered before ACCs are introduced on the market.
2. METHOD
Twenty experienced drivers, ten male and ten female, between 26 and 46 years old participated in the study. They were randomly assigned to two experimental conditions with the restriction of an equal number of men and women in both groups. One subject group drove a test route in the VTI driving simulator using an ' ACC. The other group drove the same test route with-out any support system. The VTI driving simulator is an advanced simulator consisting of six subsystems includ-ing a movinclud-ing base [3], [4], [5]. The subsystems are controlled to interact in a way evoking impressions, reactions, and actions which are very close to those experienced by a driver in real driving. The simulator is very fast responding with an additional delay of 40 ms. 2.1. ACC System
The ACC installed in the simulator was a propotype performing speed and distance control using both throttle and brake. The simulated distance sensor had a detection range of 3 to 130 metres. The maximum braking capability of the ACC was limited to 2 - 3 m/s2 to keep the automatic system accelerations and
decelerations comfortable . Also, the complete
functionality was only possible in the speed interval 30 to 130 km/h. For speeds above the upper limit the ACC worked as a conventional CC. For speeds below the lower limit the ACC switched itself off and had to be reengaged when the speed again exceeded 30 km/h. Finally, the studied ACC was designed to not consider stationary objects. Stationary targets were ltered away to avoid annoying detections and ACC actions due to irrelevant elements like road signs, edge poles, railings etc. appearing along the road.
The MMI (Man Machine Interaction/Interface) of the ACC included control switches, the ordinary pedals, visual information and audible warnings. Switches for ON/OFF, SET Speed, RESUME, Tap up/down Speed by 10 km/h were positioned on the left steering wheel
stalk. When the ACC was ON, CRUISE was shown in
amber in the lower right of the dashboard. A set speed was marked by a lit LED (amber) in the outer speedo-meter circle at the chosen (set) speed. The LED remained lit also if the ACC reduced the speed because of a slower leading vehicle. As long as a leading vehicle appeared within . the detection range of the distance sensor, an amber car symbol was presented on the dashboard to the right of the speedometer. The driver could disengage the ACC and take over control by pressing either the brake pedal or the accelerator. If the brake pedal was used, the LED on the speedometer went out and the driver had to control the speed manually. The automation could be reengaged by setting a new speed, or by using the RESUME switch to cruise with the same speed as before disengagement (braking). If the automation was disengaged by use of the
accelera-1255
tor, the LED remained lit. As soon as the driver s foot was taken away from the accelerator, the ACC returned
to automatic cruising with the speed set before over riding (accelerating). The ACC could be completely
turned off by the OFF switch. If a situation occurred where the braking capability of the ACC was
insuffi-cient an audible warning (tone) was presented asking the
driver to take over control. The criteria for warning was that the deceleration of a vehicle ahead had been larger than 3 m/s2 during three consecutive control loops of 0.1 seconds. If the speed went below 30 km/h, another audible tone was sounding to make the driver aware of that s/he had to control speed and distance manually. 2.2. Driving Tasks
2.2.1. Basic
M. The test route in the simulator was a two-lane
motorway with hard shoulders, 100 km long. Each lane was 3.75 metres wide, and the road surface was of
asphalt with randomised texture and high friction. The signed speed limit was 110 km/h, and the visibility was approximately 400 metres.
gtr. The car body used in the experiment was an ordinary Saab 9000 with an automatic gearbox.
Other traffic. The subjects were overtaken (23 times), and also caught up and had to overtake other vehicles. Nineteen times they overtook a single vehicle, and four times two vehicles in a row. Eight times the subjects were overtaken when there was another vehicle driving in the right lane ahead. The situations appeared in a randomised (but equal to all subjects) sequence during the driving session and created a realistic situation variability along the test route.
2.2.2. Critical tra ic situations
Three traf c situations speci cally designed to address the limitations of the studied ACC appeared once each along the test route. The subjects in the control group were exposed to exactly the same situations, but they drove a conventionally equipped car without ACC.
Subiect stuck by leading cars braking hard. The subject was approaching a leading vehicle and over-taken by another car at the same time. The two cars were interactively controlled to lock the subject in. When the distance to any of the two leading cars had been less than 75 metres gig the distance between them had been less than 20 metres for 8 seconds, their brake lights were on and they were braking with 8 m/s2 to 12 m/s (= 43.2 km/h). Then the left leading car accelerated
and disappeared, and the subject had to overtake the
right car. During approach the ACC detected a leading car and the car symbol was presented on the dashboard. When the cars ahead were braking the ACC reached its maximum braking capacity, which was insufficient. The subject had to take over control in order to avoid a collision, and was told to do so by an acoustic signal (tone) from the ACC.
Car pulling out in front of the subject s car. The
subject caught up with what looked like two leading cars
in a row, and started to overtake them. The speed of the
preceding cars was controlled in relation to the subject s speed. When the distance to the assumed rst car ahead was the subject s speed minus that car s speed (or max 22 m/s) multiplied by 3.5 seconds (TTC = time to colli-sion), it activated its left direction indicator and pulled out in order to overtake another ( hidden ) real leading car further ahead. When the middle car was blinking and abruptly pulled out, the ACC detected it and reached its maximum braking capacity, which was insuf cient to handle the situation. The subject had to take over
control in order to avoid a collision, and was told to do
so by an acoustic signal (tone) from the ACC.
Stationary queue. A stationary queue was simulated by stationary vehicles in both lanes in front of the subject. The ACC did not detect the stationary vehicles (no car symbol shown on the dashboard). Therefore no system action (braking) was performed and no warning was given when the subject s car was approaching the jam. The subject had to take over control and avoid a collision by interpreting the situation and act properly completely on his/her own.
3. RESULT
3.1. Driver Behaviour
All subjects reacted by immediate braking when one of the cars in the overtaken row activated its direction indicator and pulled out in the subject s lane. Thus, the supported subjects reacted faster than the ACC, and no warnings (audible tones) were activated because the subjects had already taken over the control. The time taken from the direction indicator was activated until the subjects braked was on the average 1.11 sec (sd 0.13 sec) during ACC driving and 1.17 sec (sd 0.21 sec) during manual driving. The difference was not statisti-cally significant (5%). In the situation where the cars ahead braked hard with 8 m/sz, nine of the ten subjects in the ACC group received the audible warning. The time from the brake lights were activated to the warning was presented was on the average 0.43 sec (sd 0.05 sec). After another 0.90 sec (sd 0.33 sec) the subjects started
to brake. Thus, the time taken from the brake lights were
on until the subjects braked was on the average 1.33 sec (sd 0.13 sec) during ACC driving compared to 1.49 sec (0.11 sec) during manual driving. The difference was again not statistically signi cant (5 %).
Five collisions were observed in the study. All occurred when the subjects approached the stationary queue and crashed into its tail. Four of the colliding subjects were in the ACC group, and one was in the control group.
The subjects driving with the ACC spent signi cantly more time in the left lane than the subjects driving
1256
without ACC (F(1,18) = 10.93; p = .0039). The proportions were 33 % and 17 % of the driving time, respectively. Also if driving distance was considered the subjects in the ACC group drove significantly more of the 100 km in the left lane compared to the subjects in the control group (F(1,18) = 9.66; p = .0061). The respective proportions were 19 % and 11 %.
3.1.1. Time headway
The time headway in seconds was calculated as the distance between the front of the subject s car and the rear of a preceding car divided by the subject s speed. Means and standard deviations (sd) of the resulting minimum time headways for driving with and without ACC are shown in Table 1 for the selected critical traf c situations.
Table 1
Minimum time headways (sec) when driving with and
without ACC in selected critical situations, n = 10
(means for not colliding subjects within brackets, n(ACC) : 6 and n(no ACC) = 9)
ACC No ACC
mean sd mean sd
Cars braking hard 1.13 0.55 1.07 0.75 Stationary queue 1.19 1.11 2.10 1.01
(1.98) (2.33)
Car pulling out 0.49 0.05 0.48 0.08 Two of the studied situations resulted in longer minimum headways when the ACC was used. When a car pulled out from a queue and intruded into the subject s lane during overtaking, the headways were very short (= 0.5 sec) and similar in both experimental conditions. The small headway variability (sd in Table 1) indicates that the behaviour was consistent between subjects. In the situation where the cars in front of the subject braked hard, the minimum headways were
around 1.1 sec, and varied more between subjects.
When the subjects approached the stationary queue, the average minimum headway was shorter when ACC was used compared to when it was not. The averages were 1.2 sec and 2.1 sec for ACC supported and manual driving, respectively. Four subjects in the ACC group and one subject in the control group did not manage to stop, but crashed into the queue tail (minimum headway = 0). This in uenced the inter-individual headway variability (sd), which was large in both experimental conditions. If only the headways of those subjects who did not collide (means within brackets in Table 1) were used in the analysis, it revealed that the minimum headway was still shorter by 0.35 sec when the ACC was used compared to when it was not used. The difference was not statistically significant (5%).
3.2.2. Braking manoeuvre
When the subjects were exposed to the critical traffic situations they had to brake manually to solve the task properly. The time headways when braking was initiated are listed in Table 2 for driving with and without ACC.
Table 2
Time headways (sec) when braking was initiated when driving with and without ACC in selected critical
situations, n = 10
ACC
No ACC
mean sd mean sd
Cars braking hard
1.62 0.32
1.70
0.57
Stationary queue 2.79 0.70 3.38 0.86
Car pulling out
0.57 0.06
0.52
0.09
In the pulling out situation both ACC supported and unsupported subjects initiated braking at time headways close to the minimum time headway 0.5 sec (Table 1), while the subjects generally started to brake at larger than minimum time headways in the other two situations. When the stationary queue was approached and when the cars ahead were braking hard, the ACC supported subjects started to brake at shorter headways (averages 2.8 and 1.6 sec) compared to the unsupported subjects (averages 3.4 and 1.7 sec). The differences were not significant (5 %).
The recorded maximum forces applied in the different critical traffic situations are shown in Table 3.
Table 3
Maximum braking forces (N) applied when driving with
and without ACC in selected critical situations, n = 10 (means for not colliding subjects within brackets,
n(ACC) = 6 and n(no ACC) = 9).
ACC No ACC
mean sd mean sd
Cars braking hard 248 78 297 172
Stationary queue 358 49 302 120
(360) (286)
Car pulling out 119 49 94 42
The largest maximum braking forces were applied in the stationary queue situation, especially by the subjects driving with ACC. If only the subjects who did not crash
into the queue were considered, the difference between
ACC and manual driving was even larger. In the braking hard situation the applied maximum forces were nearly as large, but the unsupported subjects braked slightly harder than the ACC drivers . The applied forces were lower in the pulling out situation, especially for driving without ACC.
The decelerations at maximum braking were generally large in the studied critical situations (Table 4). The largest mean value (8.7 m/s2) was recorded when the
1257
subjects in the ACC group approached the stationary
queue, and the lowest (5.1 m/s ) when a car pulled out
in front of unsupported drivers. Table 4
Deceleration (in/$2) when maximum braking forces were applied when driving with and without ACC in selected
critical situations, n = 10 (means for not colliding
sub-jects within brackets, n(ACC) = 6 and n(no ACC) = 9).
ACC No ACC
mean sd mean sd
Cars braking hard 7.78 1.90 7.33 2.23 Stationary queue 8.67 0.23 7.70 1.15
(8.58) (7.61)
Car pulling out 7.08 1.27 5.13 0.94 The time headways when the maximum forces were applied are shown in Table 5.
Table 5
Time headways (sec) when maximum braking forces were applied when driving with and without ACC in selected critical situations, n = 10 (means for not colliding subjects within brackets, n(ACC) = 6 and n(no ACC) = 9).
ACC No ACC
mean sd mean sd
Cars braking hard 1.34 1.03 1.20 0.74 Stationary queue 1.50 0.92 2.32 0.98
(2.17) (2.52)
Car pulling out 0.49 0.05 0.48 0.08 When the stationary queue was approached, the max braking/deceleration occurred at shorter time headways when the ACC was used (average 1.5 sec) than when the subjects were unsupported (average 2.3 sec). For cars
ahead braking with 8 m/s2 the maximum braking/
deceleration appeared at larger time headways in the ACC group (averages 1.3 and 1.5 sec) compared to the group driving manually (averages 1.2 and 0.9 sec). 3.2.3. Workload
NASA-RTLX were used to measure experienced workload [6]. After completion of the driving session the subjects rated the six workload factors mental demand, physical demand, time pressure, performance, effort, and frustration on continuous subscales from very low (0) to very high (100). The mean ratings of all six workload factors indicate that both experimental conditions imposed a moderate load on the subjects
(Table 6). Mental demand, effort and frustration were
estimated very similarly by the subjects driving with and without ACC, while the subjects driving without ACC
experienced slightly higher physical demand and larger time pressure than the subjects supported by the ACC. The differences were not statistically significant (5%). Consequently, both subject groups experienced that they performed the task relatively well. The inter-individual variations in workload ratings were large (Table 6).
Table 6
Subjective ratings of the six NASA-RTLX workload factors after driving with and without ACC.
ACC No ACC mean sd mean sd Mental demand 32 26 34 25 Physical demand 1 8 1 6 29 25 Time pressure 15 14 18 18 Performance 70 19 69 17 Effort 27 27 28 20 Frustration 25 22 25 20 3.2.4 Driver opinions
After the experiment, the subjects judged aspects of importance for ACC acceptance and usability on rating scales from negative opinion (1) to positive opinion (7). The obtained scores were generally high, indicating that the subjects had a positive attitude towards the ACC, and that they found it usable. The subjects expressed a wish to have the ACC in their own car, and thought they would use it often if they had it available. They also seemed to trust the system, which was judged to communicate valuable information without drawing too much attention. Finally, the subjects rated the ACC very easy to learn and to manoeuvre. Some anxiety that ACCs would make drivers inactive and influence negatively their capability to react and make decisions was expressed in the open remarks. Opinions about increased convenience and capacity released for other tasks e.g. supervision of the traffic environment were also found.
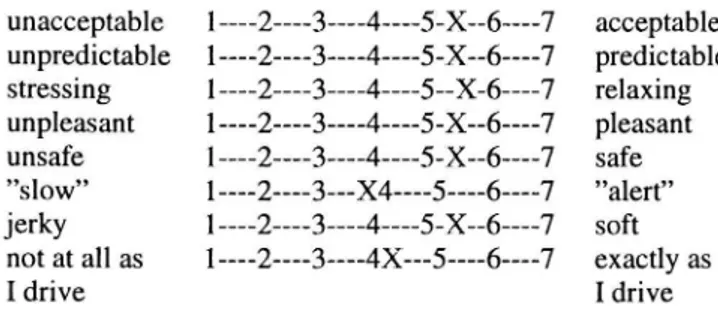
The ACC performs the longitudinal control of driving automatically. Therefore, various dimensions of system behaviour are of specific interest, and the subjects were asked to rate also some of these. The mean scores, again using seven step scales, are shown in Figure 1. It is obvious that the ACC did not behave completely as the subjects unacceptable 1 ---2----3----4----5-X -6 --7 acceptable unpredictable 1--- 2-- -3- 4- -5-X--6----7 predictable stressing 1--- 2 -- 3 --4-- 5--X 6 --7 relaxing unpleasant 1 ---2 ---3- -4- -5-X--6- --7 pleasant unsafe 1-- -2----3----4----5-X--6 - -7 safe slow 1----2 -- 3- -X4 ---5----6- --7 alert jerky 1 ---2 - 3-- -4----5 X -6----7 soft not at all as 1----2- --3--- 4X-- 5 ---6- - 7 exactly as
I drive I drive
Figure 1 Subjective ratings of selected aspects of ACC behaviour ( means indicated by X, n = 10).
1258
would have done if driving manually. Comments were also given that the ACC could be a little more alert, especially when accelerating during overtaking of cars that had been followed at a lower than set speed. The system braking was occasionally experienced as a little jerky . But overall the ACC behaviour was experienced to be well designed.
4. DISCUSSION
It seems reasonable that drivers knowing that they are supported by a system capable of automatic speed and distance control occasionally would expect more from the system than it can provide. Even drivers who have been informed about the ACC limitations may have problems to identify situations requiring them to take over control, at least in time to avoid the development of critical situations or in the worst case accidents. Intended effects of comfort and smoothness may then be diminished by decreased safety.
In the pulling out situation drivers generally reacted fast and similarly in the ACC and control groups. The immediate nature of the reactions is obvious as braking initiation, as well as maximum force and deceleration all occurred at time headways very close to the minimum headways (= 0.5 sec), which were obtained for speeds slightly above the speed limit 110 km/h and distances around 15 metres. The applied forces/decelerations were not extremely high, because the pulling out car did not decelerate but accelerated and drove away from the driver. No warnings were presented when the vehicle pulled out in the driver s lane because the drivers braked and thereby disengaged the ACC before the
warning was activated, and no collisions occurred. The
result indicates that the ACC drivers were as alert as the manual drivers. The criticality of the situation was neither increased nor decreased when an ACC was used. A reasonable interpretation is that driver behaviour in pulling out situations is overlearned, and will not be in uenced by ACC use.
The reactions were slower but stronger in the other
two situations, where leading vehicles braked or stood
still. In these situations the braking initiation, maximum forces and decelerations did not occur immediately, but at longer than minimum time headways. The cars ahead did not drive away from the drivers but came closer .
When leading cars braked hard (8 m/sz) with activated brake lights the drivers behaviour varied more, but did not differ between ACC and manual driving. During the approach the speed was (automatically or manually) reduced because the distance to the leading car had to
be adapted. Thus, the speed was well below 110 km/h
when the brake lights were activated, which probably contributed to the longer minimum time headways. The braking cars may possibly have been perceived as less critical than the pulling out car as all drivers but one
received the audible warning and seemed to consciously await how the situation would develop. No collisions occurred, but large braking forces and decelerations were required in spite of the relatively low speed. So the avoiding manoeuvre was somewhat delayed, and driver reactions to brake lights seem not to be overlearned.
In the stationary queue situation, the ACC drivers tended to start to brake actively at a shorter time head way and also apply the maximum force/deceleration closer to the queue tail than the unsupported drivers. Throughout the approach, the speed was slightly higher in the ACC group. A reasonable explanation is that the ACC supported drivers detected the vehicles ahead, and expected the ACC to perform the longitudinal control as usual. No warnings were given when the situation turned out to be critical. When the drivers discovered that the vehicles ahead were stationary, and understood that the ACC would not react and automatically adapt, the speed was high in relation to the available stopping distance. In spite of the application of high maximum forces resulting in maximum decelerations of 8.7 m/s2 on average, four drivers in the ACC group (and one in the control group) did not manage to stop, but crashed into the queue tail.
Drivers using the ACC drove more in the left lane than unsupported drivers, possibly because of the limited ( comfortable ) acceleration level. The related risk was probably low on the motorway.
For the future it would be of interest to study also conventional CCS in critical situations, and compare the effects to those obtained for ACC. Also ACCs paying attention to stationary ought to be evaluated. 5. CONCLUSIONS
0 Use of the studied ACC prototype in uenced driver behaviour differently in the various critical traffic situations:
- approaching a stationary queue lead to more colli-sions among ACC users than among unsupported drivers, possibly because of too large expectations leading to too late and abrupt interventions.
- a car pulling out in front of the drivers, lead to identical and immediate reactions by unsupported and ACC supported drivers. All ACC drivers reacted (braked) before warnings were presented, possibly because of overlearned behaviour.
- cars ahead braking hard lead to strong but less immediate driver actions with larger variability. No difference was revealed between unsupported and ACC supported drivers. Nine of the ten ACC users waited to take over control until the warning was received.
1259
0 The collisions among ACC drivers could neither be explained by increased driver workload nor by decreased level of driver alertness.
0 The ACC was well accepted in spite of its limitations in the studied critical traffic situations. 0 The results can be valuable in deciding about ACC
improvements and MMI optimisation. Early ACC actions and warnings may reduce criticality if the targets are detected.
6. REFERENCES
[1] Becker, S. and J. Sonntag, Prometheus CED 5: Autonomous Intelligent Cruise Control Pilot Study Conducted by the Daimler Benz and Opel Demonstrators , Report from TL z'V Rheinland Institute of Trafic Safety, Project EU 45, Phase II, TV 89404, Cologne, 1993.
[2] Nilsson, L. and A. Nåbo, Evaluation of Application 3: Intelligent Cruise Control Simulator Experiment. Effects of different levels of automation on driver behaviour, workload and attitudes , Deliverable No. 10, Project V2006 (EMMIS), DRIVE II, 1994, Chapter 5,
[3] Nilsson, L, The VTI Driving Simulator
-Description of a Research Tool , Report No. 24 Project V101 7 (BERTIE), DRIVE I, 1989.
[4] Nordmark, S, The VTI Driving Simulator Trends
and Experiences , Proceedings of Road Safety and Tra ic Environment in Europe, Gothenburg, 1990. [5] Nilsson, L, Behavioural Research in an Advanced Driving Simulator - Experiences of the VTI System , Proceedings of 37th Annual Meeting of the Human Factors and Ergonomics Society, Seattle, 1993, pp. 612-616.
[6] Hart, S. G. and L. E. Staveland, Development of
NASA-TLX (Task Load Index): results of empirical and
theoretical research , in Hancock, P. A. and N.
Meshkati (Eds), Human Mental Workload, Amsterdam, Elsevier Science Publishers B.V. (North Holland),
1988, pp. 139-183.
7. ACKNOWLEDGEMENT
This research was supported by the Driver Assistance and Local Traffic Management (DALTM) project within the Swedish RTI research program 91 94. Main sponsors of this project are The Swedish National Board for Industrial and Technical Development, AB Volvo, Saab-Scania AB and the Swedish National Road Administration. Saab Automobile initiated the study, provided the ACC and supported its installation in the VTI simulator.