Application of
assembly line
balancing in
manufacturing
industry
MAIN FIELD: Industrial Organization & Economy, Logistics and Management AUTHOR: Julia Eriksson
SUPERVISOR:Roy Andersson
JÖNKÖPING 2020 June
I would like to take the opportunity to thank everyone that made this final thesis possible. A big thank you to all project group members at Husqvarna Group in Orangeburg, for the support and valuable input throughout my thesis. Especially thanks to Mrs. Cristina Rhea, for your involvement and devotion. Thank you to all other employees at the case company, for your hospitality and continuous flow of positive energy. Thank you, Dr. Roy Andersson, for being my supervisor and guiding me in my writing. Finally, I want to thank my study colleagues for all your advice and for being by my side throughout the entire thesis process. I could not have done this without you!
This final thesis has been carried out at the School of Engineering at Jönköping University within Industrial Organization & Economy, Logistics and Management. The author is responsible for the presented opinions, conclusions and results.
Examiner: Leif-Magnus Jensen Supervisor: Roy Andersson Scope: 15 credits
Abstract
Purpose – The purpose of the study is to explore how productivity can be improved in an assembly line in manufacturing industry. In order to fulfill the purpose, following three research questions have been formulated:
1. How can an assembly line be designed?
2. Which potential improvement areas can be found in an assembly line? 3. How can assembly line balancing be used to improve productivity?
Method – A case study was performed in order to answer the research questions. A combination of quantitative and qualitative data have been collected. To build an understanding of existing theories and research within the study area, a literature study was conducted which formed a theoretical framework. Parallel to the literature study, empirical data was collected through a case study. Data collection methods included observations, document studies, time measurements and focus group meetings. The reviewed theories and the collected data were later analyzed and a result was generated. Findings – In order to improve productivity, Theory of Constraints enabled the identification of potential improvement areas. To address the improvement areas, Assembly Line Balancing was found an appropriate method. Through the case study it was found that through Assembly Line Balancing, a reduction of takt time can be achieved which opens up the possibility to increase the production volume. Also, when re-allocating operators between work tasks, a reduction in numbers of operators is possible which results in lower costs. By lowering costs and increasing production volume, improved productivity is achieved.
Implications – This study presents an application of the two improvement methods Theory of Constraints and Assembly Line Balancing in a manufacturing industry. Therefore, the thesis can be used as a basis when performing improvement work related to reduction of takt time in other manufacturing industries, to gain a better understanding for the implementation of the studied methods.
Limitations – One limitation of the study was the pandemic Covid-19, which enforced restrictions on the case company. This disturbed the conduction of the case study since less focus group meetings were conducted, and suggested improvements could not be tested. Another limitation was the limited study time frame. Consequently, the collected time measurements were relatively few and the study scope was delimited to only packaging activities. To increase reliability, a more extensive time frame is necessary. The analysis has been adopted to the situation at the case company. The conclusions may hence be biased, which could restrict to what extent the study can be generalized. Keywords – Assembly Line Design, Assembly Line Balancing, Productivity,
Table of contents
1
Introduction ... 1
BACKGROUND ... 1
PROBLEM STATEMENT ... 1
PURPOSE AND RESEARCH QUESTIONS ... 2
THE SCOPE AND DELIMITATIONS ... 3
DISPOSITION ... 3
2
Methods and implementation ... 4
LINK BETWEEN RESEARCH QUESTIONS AND METHODS ... 4
WORK PROCESS ... 4 APPROACH ... 5 DESIGN ... 5 DATA COLLECTION ... 6 2.5.1 Literature study ... 6 2.5.2 Document study ... 6 2.5.3 Observations ... 6 2.5.4 Time measurements ... 7 2.5.5 Focus group ... 7 DATA ANALYSIS ... 8
VALIDITY AND RELIABILITY ... 9
2.7.1 Validity ... 9
2.7.2 Reliability ... 9
3
Theoretical framework ... 11
LINK BETWEEN RESEARCH QUESTIONS AND THEORY ... 11
ASSEMBLY LINES ... 11
ASSEMBLY LINE DESIGN ... 12
POTENTIAL IMPROVEMENT AREAS ... 13
3.4.1 Theory of Constraints (Bottlenecks) ... 13
3.4.2 Takt time and Cycle time ... 13
ASSEMBLY LINE BALANCING ... 14
4
Empirical data ... 16
RQI–HOW CAN AN ASSEMBLY LINE BE DESIGNED? ... 16
RQII–WHICH POTENTIAL IMPROVEMENT AREAS CAN BE FOUND IN AN ASSEMBLY LINE? .. 18
RQIII–HOW CAN ASSEMBLY LINE BALANCING BE USED TO IMPROVE PRODUCTIVITY? ... 19
5
Analysis ... 20
RQI–HOW CAN AN ASSEMBLY LINE BE DESIGNED? ... 20
RQII–WHICH POTENTIAL IMPROVEMENT AREAS CAN BE FOUND IN AN ASSEMBLY LINE? .. 21
RQIII–HOW CAN ASSEMBLY LINE BALANCING BE USED TO IMPROVE PRODUCTIVITY? ... 22
6
Discussion and conclusion ... 25
RESEARCH QUESTION I ... 25
RESEARCH QUESTION II ... 25
RESEARCH QUESTION III ... 25
DISCUSSION OF METHODS ... 26
THEORETICAL AND EMPIRICAL CONTRIBUTION ... 27
LIMITATIONS ... 27
CONCLUSIONS ... 27
FURTHER RESEARCH ... 28
References ... 29
List of Figures
Figure 1 - Scope and delimitations ... 3
Figure 2 - Link between research questions and methods ... 4
Figure 3 - Study time frame ... 5
Figure 4 - Data analysis process ... 9
Figure 5 - Link between research questions and theories ... 11
Figure 6 - Metal crates assembly process ... 17
Figure 8 - Wooden pallet assembly process ... 18
Figure 9 - New metal crate assembly process ... 24
List of Tables
Table 1 - Observation scheme ... 7Table 2 - Original work descriptions ... 23
1 Introduction
This chapter introduces the thesis. It is starting with the study’s background and the problem statement. This is followed by presenting the purpose and the research questions. Also, scope and delimitations of the study are described as well as the disposition of the thesis.
Background
Pattern of business has rapidly changed over the past ten years. Globalization has accelerated which has resulted in business becoming more complex and challenging than before (Branch, 2009). With an increased accessibility to world markets, competition can now turn up from anywhere in the world. This makes globalization the most significant influencing factor on modern industrial competition (Closs & Fawcett, 1993).
Today, it is critical to companies in international constellations to have a strong competitive strategy. A competitive strategy consists of a number of different factors such as resources and management, but the factor which usually is recognized as the most important is the cost factor. Therefore, is critical for companies to formulate and implement a strategy which is cost-productive. (Huang, Boon Leing, & Joo Heng, 2015) Assembly lines were originally developed to run mass production of standardized products in a cost-productive way (Adeppa, 2015). The assembly line is often recognized as one of the greatest developments in the modern world. To produce goods on an assembly line has proven to be much more productive than finishing each product individually (Thomopoulos, 2014).
An assembly line is a manufacturing process where a product is carried, usually by a mechanical conveyor, through a series of workstations (Nielsen, Ponnambalam, & Mukund Nilakantan, 2017). The workstations are layed out in series and linked by a material handling system (Buzacott, 2013). Operations are performed one-by-one to create the finished product. Installing an assembly line is a high cost and long-term investment. Hence, it is necessary to design a productive assembly line (Nielsen et al., 2017).
Designing an assembly line is a complex task since there are many constraints in industrial problems, for example limited resources, precedencies or incompatibilities between work tasks (Corominas, Ferrer, & Pastor, 2011). By designing a productive assembly line, costs are decreased which allows lower sales prices on goods, stronger competitiveness and better exploitation of markets potential (Adeppa, 2015).
Problem statement
Formulating and implementing a successful competitive strategy is critical for a company’s survival (Huang et al., 2015). Furthermore, Huang et al. (2015) argues that the most significant factor for a company to be competitive is the cost factor. Assembly lines are flow-line production systems and are of significant importance in the industrial production. Assembly lines require high capital investment in installation or re-design but if assembly lines are configurated in a successful way, cost-efficient production can be achieved (Boysen, Fliedner, & Scholl, 2007).
Designing an assembly line is a complex task due to its combinatory nature (Corominas et al., 2011). Due to technological and organizational conditions, assembly line work tasks have constraints such as precedencies and cycle time limitation. Designing an assembly line with respect to these while reaching for a certain objective goal is referred to as assembly line balancing (Alghazi & Kurz, 2018).
Assembly line balancing is a manufacturing strategy used to allocate work tasks and work time evenly over workstations in the assembly line (Thomopoulos, 2014). The goal might be to maximize productivity, minimize number of workstations or to reduce probability of line stop or accomplish a given output volume (Adeppa, 2015).
The productivity rate of an assembly line can yield or waste millions of dollars per year, making assembly line balancing one of the most significant industrial optimization problems (Adeppa, 2015). Hence, it is critical for manufacturing companies to design their assembly lines in the most productive way to keep costs down and therethrough increase competitiveness.
Purpose and research questions
Drawing on the problem statement, it is evident that designing a productive assembly line is a complex process but of significant importance to stay competitive in today’s market.Consequently, the purpose of the thesis work is:
To explore how productivity can be improved in an assembly line in manufacturing industry
Three research questions were formulated based on the purpose of the thesis work. To introduce the thesis and build a foundation for following research questions, it is important to gain an understanding of assembly line design. Therefore, the first research question (RQ) is:
RQ1: How can an assembly line be designed?
To improve productivity in an assembly line, a starting point is necessary. The second research question aims to explore which potential improvement areas can be found in an assembly line. The second research question is:
RQ2: Which potential improvement areas can be found in an assembly line? When potential improvement areas in an assembly line are identified, these need to be addressed. The third research question aims to explore how productivity can be improved by using assembly line balancing. Hence, the third research question is:
The scope and delimitations
The study aims to provide insight in assembly line design and assembly line balancing in manufacturing industry. The study scope refers to perform an assembly line analysis and identify ways to make an assembly line more productive.
The study is delimited to focus on one assembly line and one product family. Further delimitations have been taken where only packaging assembly activities will be explored. The remaining parts of the assembly flow will be excluded in the study, as well as external activities (See Figure 1).
Presented suggestions on improvements only refers to the problem which affects the assembly line productivity the most. Further improvement possibilities will be excluded due to the limited time frame of the study.
Figure 1 - Scope and delimitations
Disposition
Chapter 1 introduces the study by presenting the background, problem statement, the study’s purpose and research questions. Further it describes the delimitations to clarify what the study will cover and not.
Chapter 2 explains the research study work process, approach and design. It also describes the study’s data collection and data analytics. Lastly it discusses the study’s validity and reliability.
Chapter 3 presents the theoretical framework of the study, which are Assembly lines, Assembly line design, Theory of Constraints, takt and cycle time and Assembly Line Balancing.
Chapter 4 narrates collected data done through time measurements, observations, focus group and document studies.
Chapter 5 aims to answer the research questions by comparing theoretical framework and collected data.
Chapter 6 discusses and concludes the study. The research questions are answered, and the methodology is discussed. Moreover, theoretical and empirical contribution as well as the study’s limitations are presented. Lastly conclusions and recommendations on further research are given.
2 Methods and implementation
This chapter presents the methodology by which the thesis work has been formed. It is introduced by describing the link between the research questions and chosen methods which is followed by an overview of the work process. Further, a description of the study’s approach and design is provided as well as data collection methods and data analysis. The last part of the chapter discusses the validity and reliability of the study.
Link between research questions and methods
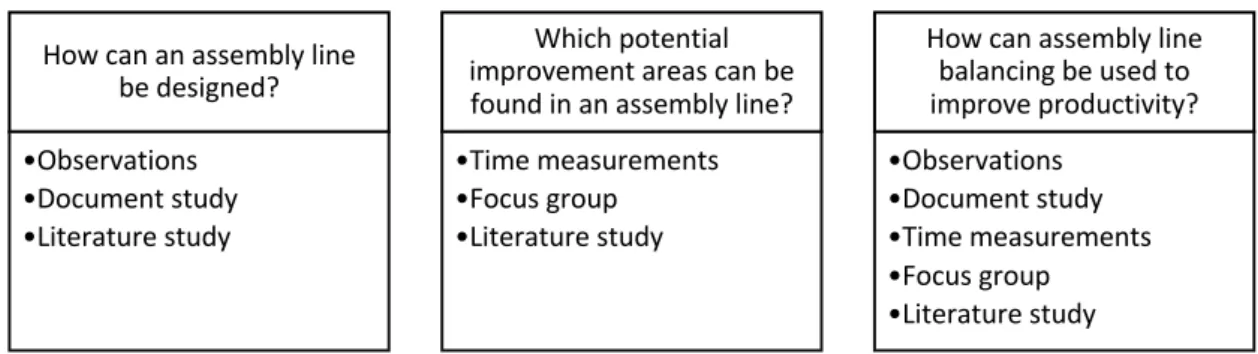
A literature study has been used as a method throughout the whole study to contribute with knowledge from previous research and theories within the subject. To answer the study’s first research question, additionally to the literature study, observations and document studies have been conducted in order to collect empirical data from a real-life assembly line. For the second research question, further empirical data has been collected in the form of time measurements and focus group discussions. The third research question has been answered by the result of previous research questions. A deeper explanation of the chosen methods is presented under subheading 2.5 Data collection.
Figure 2describes the link between the research questions and used methods.
Figure 2 - Link between research questions and methods
Work process
The study time frame went from February 2020 to the end of May 2020. The study started with an introduction phase at the case company, including a plant tour and a meeting where the company’s ongoing improvement project was presented. Further it was discussed how this thesis work project could contribute to the project. The introduction phase involved defining the problem as well as formulating the purpose and research questions. Further, to fulfill the purpose and to answer the research questions, an appropriate methodology was formulated.
The next two phases involved literature study and data collection which ran parallel with each other. The literature study involved theories about assembly lines, assembly line design, Theory of Constraints, takt and cycle time and Assembly Line Balancing. The empirical data collection involved several different methods, starting with performing time measurements, document studies and observations, and continued with discussions with a selected focus group, where the collected raw data was discussed. The last phases were the analysis and the discussion and conclusion. These steps were partly conducted parallel to the focus group discussions to bring ideas and views brought up at the meetings into the case analysis. These parts were also partly
How can an assembly line be designed? •Observations •Document study •Literature study
Which potential improvement areas can be found in an assembly line? •Time measurements •Focus group •Literature study
How can assembly line balancing be used to improve productivity? •Observations •Document study •Time measurements •Focus group •Literature study
performed parallel to the literature study, in order to ensure alignment in between the findings and the theoretical framework. Report writing took place continuously during the thesis work. The study time frame is visualized in Figure 3.
Figure 3 - Study time frame
Approach
A quantitative study approach is characterized by data collection through measurements and statistical process- and analytics methods (Patel & Davidson, 2011). The study is partly by quantitative approach since the data collection includes time measurements. When the empirical data constitutes of subjective data it is referred to as qualitative research approach (Patel & Davidson, 2011). Often a qualitative method is representing a wide variety of data collection methods (Kuada, 2012). The study is partly by qualitative approach since there are analytical assumptions made from literature, document study, observations and focus group discussions. Combining several data collection methods strengthens the study’s validity and reliability (Yin, 2007).
Design
To fulfill the purpose and answer the research questions a case study structure was used. A case study is a research method where a delimited group of individuals, organizations or situations are studied (Patel & Davidson, 2011) and is characterized by one or several areas to analyze (Yin, 2007). The study involves only one case company, making it a one case study. Further, it involves only one assembly line and one product family, making it a one area analysis. A case study is suitable when the study objects are processes or changes (Patel & Davidson, 2011).
The study was conducted in collaboration with a larger improvement project running at the case company. Hence, to perform a case study was favorable. The selected assembly line from which empirical data was obtained, was an area of interest, meaning that there was some concern about the assembly line’s low performance. Therefore, this case study could be conducted and contributed with valuable information for the case company. This information was both raw data in form of time measurements but also the analysis and discussion chapters where strategies for making the assembly line more productive is presented.
Data collection
The data collection consisted partly of studying literature and partly of collecting empirical data through document studies, observations, time measurements and focus group discussions.
2.5.1 Literature study
To be able to fulfill the study purpose, a literature study was conducted to gain an understanding of underlying research and theories. The starting point when searching for relevant scientific articles and journals was Primo and A-Z Databases, search engines provided by Jönköping University Library and University of South Carolina. Primo and A-Z Databases obtain worldwide research and journals from many databases. By using appropriate keywords when performing the literature study search, relevant sources were retrieved. All articles retrieved were peer-reviewed. To use sources which have been examined by experts strengthens the study validity (Yin, 2007).
Search words were chosen accordingly with the selected theories. These were mainly “Assembly line”, “Assembly line design”, “Assembly line balancing”, “Theory of Constraints”, “Takt time” and “Cycle time”.
2.5.2 Document study
In order to answer the research questions, conducting a document study was helpful. Document study takes real-life conditions and events into consideration (Patel & Davidson, 2011) and play an distinct role in case study research (Yin, 2014). Reviewed documents were work descriptions for the workstations in the selected assembly line at the case company. By reviewing these documents, a solid ground and understanding about the assembly line design could be achieved. The work descriptions were compiled into spread sheets and were later compared to the assembly line’s real-life work tasks through observation.
2.5.3 Observations
In daily life the most commonly used method for retrieving information about the world is through observation. To a large extent this happens randomly, depending on experiences, needs and expectations. But when observation is performed in a systematic way, it is also a scientific technique for collecting data. Observations are foremost useful when collecting information within areas which involves behavior and events in real-life settings (Patel & Davidson, 2011). In this thesis, observations were conducted to analyze the layout and work tasks in an existing assembly line.
To answer the research questions, two observations were conducted (See Table 1). The purpose of the first observation was to get an overview of the case company assembly flow and it was conducted in an unstructured manner. Unstructured observations are
often used in exploring purpose to extract as much information as possible about a certain problem area (Patel & Davidson, 2011).
The second observation was conducted at one of the case company assembly lines. It meant to be a supplement for the document study and meant to find out whether the reviewed work descriptions matched with the work tasks performed on the assembly line in real-life. Patel and Davidson (2011) argues that observations are most commonly used to complete information which has been collected with other techniques. The second observation was conducted in a structured way. Patel & Davidson (2011) argues that structured observations require a clear objective. The actions and behaviors which are involved in the observation should be known from beforehand and an observations schedule should be made. An observations schedule could for example be a list where a number of expected events are described, which are being checked off throughout the observation. In the case study, a spread sheet with all work descriptions was used, and notes were taken whether observed work tasks matched the work description or not.
Table 1 - Observation scheme
Observation observation Name of Purpose Object Location
1 Assembly line study
Gain a broader understanding of the assembly line Assembly line, operators, resources, products Pack floor 2 Work descriptions Verify work descriptions from document study Assembly line,
operators Pack floor
2.5.4 Time measurements
When measurements are taken of the study phenomena, it is referred to as quantitative research. To verify the taken measurements, the collected data is analyzed with the aim to find trends or relationships among the data. When taking measurements there is always the risk for errors and faults. Error may occur from several sources in the measurements. Usually these are divided into systematic and random errors. Systematic errors are found when there is a fundamental flaw in the system while random errors appear by chance, including human error (Watson, 2015). To avoid quality flaws in quantitative studies, it is important to build the research with underlying theories, good instruments and accuracy when taking the measurements (Patel & Davidson, 2011). This study encompasses time measurements of work tasks in one assembly line. The time studies were conducted throughout a period of three weeks by one observer with one clock. Each work task on the assembly line was timed five times and the times were taken with preciseness of two decimals. The clock started when the operator initiated the work task and stopped when it was finished. The five measurements of one work task were collected in a sequence, but sometimes the operator was switched during the time study.
2.5.5 Focus group
Interviews are commonly found and a significant source in a case study research. Interviews can be with a single person or with a group, referred to as a focus group (Yin, 2014). The methodology of focus groups builds upon only interaction to generate data. One or several aspects are discussed in the focus group with the aim to gaining an
understanding of a group’s different and shared experiences. In contrast to using one-to-one interviews, group discussions may facilitate the exploration of different views and perspectives on the topics since experiences are discussed between group members (Traynor, 2015).
There is no consensus on how to build and compose focus groups. Participants could be selected by statistical representativeness, but the group could also be recruited through more pragmatic means, for example by using members of already existing groups (Traynor, 2015). The size of focus groups varies depending on the research questions, but in general a number in between three to ten people is appropriate (Kitzinger & Barbour, 1999). Since the case study was performed as a part of a larger improvement project at the case company, it was natural to use the improvement project group as a focus group for the study. The project group consisted of five employees at the engineer’s department, one employee from the supply chain department and the researcher, a total of seven people.
To transcribe a focus group discussion is more complex compared to a one-person interview. There are usually overlapping conversation which brings difficulties for the typist to recognize who said what (Traynor, 2015). It is preferable to record a focus group discussion by video recording or audiotape. However, the most basic way is through notetaking and writing meeting summaries (Kitzinger & Barbour, 1999). The focus group discussions were not led by the researcher, but by the improvement project leader. This resulted in some discussions being irrelevant to the case study. Hence, it was chosen to only record the discussions by notetaking when relevant topics to the case study were brought up to discussion.
The focus group meetings were conducted at the case company on a weekly basis from the initiation of the study in February until mid-March. Thereafter, the meetings were held online due to the pandemic Covid-19, which prevented the group from meeting in person. Also, several meetings were cancelled since the improvement project had to be postponed. The meetings lasted between 15-30 minutes.
Data analysis
Data analysis is the process when collected information is compiled and analyzed. Collected empirical data formed the foundation of the study and was compared to the theoretical framework. Yin (2007) refers the technique to where empirical data is compared to a theoretical hypothesis as pattern matching (Yin, 2014). To counteract misalignment, the study purpose was continuously heeded to ensure collected data and theories were relevant to the study.
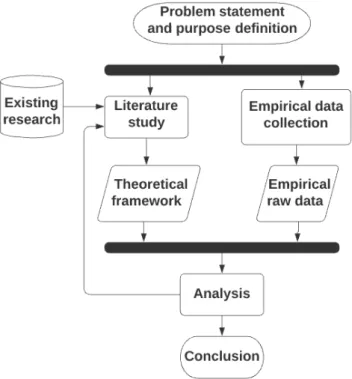
The flowchart (See Figure 4) shows the process for how data was collected and analyzed. Literature study was conducted by reviewing previous research and built a theoretical framework for the thesis work. The data collection process gave raw empirical data. By merging the theoretical framework with the empirical raw data, data analysis could be conducted. The arrow pointing back at literature study visualizes that the theoretical framework sometimes had to be supplemented in order to perform the data analysis. From the data analysis, conclusions were drawn.
Figure 4 - Data analysis process
Validity and reliability
2.7.1 Validity
Validity measures the extent to which what is meant to be studied, is what is studied (Patel & Davidson, 2011). Yin (2014) divides validity into three categories – construct validity, internal validity and external validity. These three are described as following: • Construct validity is about specifying what areas are to be measured and link these with the study purpose and research questions. It is also important to describe how these measurements will contribute to knowledge about the chosen areas. To improve the construct validity there are different tactics to use, one example is to use multiple empirical sources.
• Internal validity is about finding relationships between events. For example, did event x lead to event y, or where other factors involved? Tactics to use in order to strengthen internal validity is for example pattern matching.
• External validity measures to what extent the findings can be generalized and applicated to other areas than the delimited study object.
To strengthen the construct validity, the link between data collection and the purpose questions are presented in chapter 2.1. Several empirical sources where used when collecting data which also strengthens the construct validity. The internal validity is increased by conducting pattern matching. A thoroughly described methodology chapter is obtained to facilitate the study to be repeated on other cases, increasing generalizability and thereby the external validity.
2.7.2 Reliability
How trustworthy collected data and information is, is referred to as the study’s reliability (Patel & Davidson, 2011). The objective is to minimize errors in the study. To improve reliability, a well described methodology of how the study is conducted is
required. The aim is that other researchers can re-do a study and arrive to the same result (Yin, 2014).
The better precision of measurements, the better reliability. There are different ways to track and determine a study’s reliability. A simple way is to measure within-subject variation. For example, this could be done through measuring the standard deviation of repeated trials on the same individual or setting, so called standard error of measurement (Hopkins, 2000). In this study, the quantitative data in form of time measurements were taken five times repeatedly on each workstation. Further, the standard deviation was calculated to determine the level of reliability.
Other ways to ensure reliability, according to Patel and Davidson (2011), is to perform structured interviews or observations. Furthermore, if the interviews are conducted with people with good knowledge in the subject, it could improve the study’s reliability. In this study, a structured observation was performed at the assembly line. The focus group consisted of engineers working at the company, strengthening the reliability of the study.
3 Theoretical framework
This chapter presents reviewed theories from literature study. To introduce the chapter, the link between the research questions and selected theories is described.
Link between research questions and theory
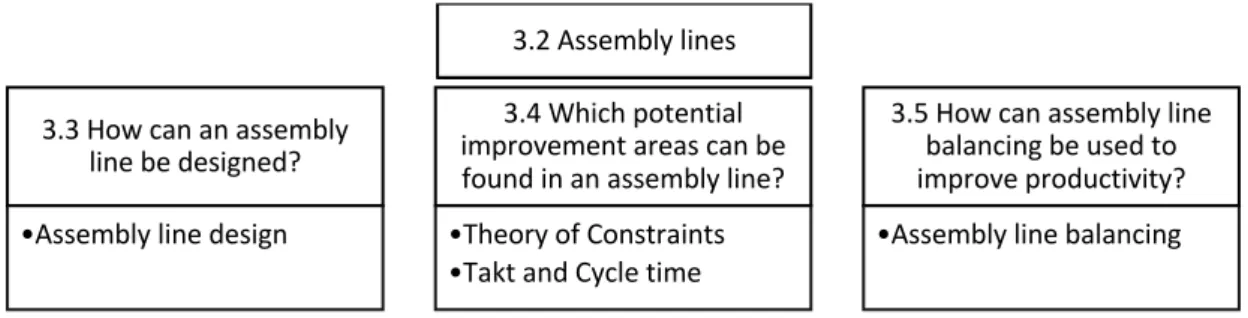
In this chapter, relevant theories are retrieved and presented to answer the research questions. Figure 5 describes the link between the study’s research questions and the selected theories.
Figure 5 - Link between research questions and theories
The main subject of the study is assembly lines, which is present throughout all three research questions. Therefore, the first part of the theoretical framework gives an introduction about assembly lines to encounter the reader with the subject.
A theoretical foundation to the first research question, “How can an assembly line be designed?” is given through theory about different types of assembly lines and their characteristics. This is to give a deeper understanding about assembly lines and the different ways they can be designed. Further, to explain how different layouts affect the way improvement work is conducted. In other words, it lays the ground for the following two research questions.
The second research question, “Which potential improvement areas can be found in an assembly line?” is addressed by presenting the widely recognized theories, Theory of Constraints and theory about takt and cycle time. Theory of Constraints is covered to describe how improvements areas can be identified. Theory behind takt and cycle time is presented since these are fundamental tools for monitoring an assembly line’s productivity rate.
Research question one and two together lay ground to answer research question three, “How can assembly line balancing be used to improve productivity?”. To give a theoretical foundation to the third research question, theory about Assembly Line Balancing is presented to describe how higher performance of an assembly line can be reached through the appliance of the method.
Assembly lines
In assembly lines it is common to manufacture by forecast and Make-to-Stock. Investments in assembly line designs are usually high, since tools and equipment along the line are designed for only one single product or product family. This design also
3.2 Assembly lines 3.3 How can an assembly
line be designed? •Assembly line design
3.4 Which potential improvement areas can be found in an assembly line? •Theory of Constraints •Takt and Cycle time
3.5 How can assembly line balancing be used to improve productivity? •Assembly line balancing
results in low flexibility regarding volume and product mix. On the other hand, total throughput time is usually short, material handling is simple, transportation costs are low and if assembly line balancing is performed in a successful way, capital work in progress can be kept low. Hence, an assembly line is an appropriate production method if the demand is high for one product or product family (with limited variation in design) throughout a longer time period (Olhager, 2000).
Assembly line design
The resources (such as tools or machines), required for the product’s assembly are placed in the order for which operations are to be performed and located near each other. Often an automatic material transporter connects the different operations. While some other production layouts (such as functional layout) are designed with the starting point from the machines used, the assembly line is product oriented and designed with the product in focus (Olhager, 2000).
According to Olhager (2000) assembly lines can be divided into two different types: Continuous Assembly Flow is characterized by a mechanical transportation system where units are directly moved to the next operation without buffering option. This type was introduced by Henry Ford in year 1913 when manufacturing the “T-Ford” and has since set the standard for mass production in assembly environments.
Floating Assembly Line is a manually regulated material handling system. This system is less limited in terms of for example cycle time and less sensitive for interruptions, due to buffer possibilities in between operations.
Thomopoulos (2014) gives another description on various types of assembly lines. Some of these are described below:
Single Model Assembly is the simplest version. It is an assembly system where only one product is assembled. Each product is the same without any variation. To make the assembling running productive, assembly line balancing is implemented.
Batch Assembly is a system where several products or models of a product are assembled. Each separate model is divided into batches, a number of units, which run through the assembly line simultaneously. When the desired inventory level is reached, the next product goes on the assembly line. In between batches, some changes on the assembly line are usually required, referred to as a changeover. Individually, each batch run as Single Model assemblies, why Batch Assembly also involves assembly line balancing when improvement work is performed.
Mixed Model Assembly takes place when there are several distinct models on the assembly line without changeovers. This type of assembly system is divided into two subsystems, where the first handles standardized products. The main improvement work tools for this kind of system are assembly line balancing and sequencing. Sequencing is the order for which units are running on the line with the aim to minimize inactivity and blockage in shift of workstations. The second subsystem handles customized products, which is a more complex system since two orders rarely are the same. A projection of incoming customer order needs to be made in order to design the
assembly line. When a customer order has been received, the required operations need to be determined for each individual order and workload assigned accordingly.
Potential improvement areas
Improvement work in manufacturing industry is widely recognized in existing research. There is a broad range of methodologies, techniques and tools with the objective to improve the productivity of operational activities (Grünberg , 2008). In this thesis work, Theory of Constraints and theory about takt and cycle time are presented.
3.4.1 Theory of Constraints (Bottlenecks)
Theory of Constraints (TOC) is an improvement method which was introduced by Dr. Eliyahu M. Goldratt and Jeff Cox through the widely recognized business novel, The Goal, in the 1980s. Goldratt and Cox argue that a system consists of interconnected processes and functions. A given system’s maximum performance is depending on the constraint within that system (Sproull, 2019). In this thesis work, a system constraint will sometimes hereinafter be referred to as a bottleneck.
The bottleneck is the part of the system which limits the achievement of higher performance. Hence, to strengthen the system, the bottleneck needs to be identified and eliminated through improvement work. When necessary improvements have been implemented, a new bottleneck will appear. To make improvements to other processes will not result in any stronger output from the system, since the bottleneck is the limiting factor (Sproull, 2019).
Sproull (2019) further presents the five steps for addressing bottlenecks: 1. Identify the bottleneck
2. Decide how to exploit the bottleneck
3. Subordinate everything else to the bottleneck 4. Elevate the bottleneck (if necessary)
5. Prevent inertia from becoming the new bottleneck. Return to Step 1.
When the bottleneck is identified, how does one break it? According to Sproull (2019), this can be done through actions such as off-loading work tasks from the bottleneck to other parts of the system, reduce waste or change conditions in the bottleneck and following workstations.
3.4.2 Takt time and Cycle time
Takt time is defined as the production rate which corresponds to the rate of customer demand on a specific product. Takt time is calculated by dividing the total available production time with the product volume (demanded by customer). This does not automatically entail that production should run parallel to customer demand. However, takt time can be used to set pace of production and is a simple tool to use to tell if operators are ahead, on or behind schedule. If the production flow is going faster than the takt time there will be overproduction and if it is going slower, bottlenecks will appear in the production (Gao & Low, 2014).
Cycle time is the amount of time it takes to complete a work task. More specifically, the time between finishing two products on the line. It represents each station’s maximal amount of work processed (Rekiek & Delchambre, 2006).
𝐶𝑦𝑐𝑙𝑒 𝑡𝑖𝑚𝑒 = 𝑁𝑒𝑡 𝑝𝑟𝑜𝑑𝑢𝑐𝑡𝑖𝑜𝑛 𝑡𝑖𝑚𝑒
𝑁𝑢𝑚𝑏𝑒𝑟 𝑜𝑓 𝑢𝑛𝑖𝑡𝑠 𝑝𝑟𝑜𝑑𝑢𝑐𝑒𝑑
Takt time and cycle time are often mistaken for being the same. Even if the terms might appear synonymous, there is a difference that needs to be understood. Takt time is the time it takes to finish a product in order to meet a designed output volume, while the cycle time is the time it takes to complete a product. In order words, cycle time could vary from one station to the next in contrast to the takt time where the time is related to the customer demand (Ortiz, 2006).
Assembly Line Balancing
Assembly Line Balancing (ALB) forms an essential part of assembly line management and design. ALB aims to make the partition of assembly work tasks in a way that maximizes the total productivity rate (Pereira, 2018).
Simple ALB is an assembly problem which requires that each workstation has a known, deterministic cycle time and when work tasks are performed in a certain, known sequence. The given sequence of the work tasks is necessary due to the product design and is referred to as precedence constraints. There should also be a given takt time which is the same throughout the workstations and defines the line’s production rate (Pereira, 2018).
When there are more factors affecting the assembly line design than the work task sequence and cycle times, it is referred to as general ALB problems. These factors could for example be difference in the workforce skills or the need of specific machinery. Hence, the ALB problem will need to consider resources, salary and investment costs (Pereira, 2018).
According to Olhager (2000) the ALB problem is something that must be addressed when designing a assembly line. The aim is to reach a production pace that corresponds well to customer demand but also to reach high resource utilization. Equal amount of work need be allocated to each workstation and precedence constraints have to be taken into consideration as well as the location of already installed, fixed machines. To achieve maximum balance in the assembly line, the cycle time should be the same on each workstation.
According to Olhager (2000) there are two approaches to address ALB problems: • Type I - to minimize the cycle time at a given number of workstations • Type II - to minimize the number of workstations at a given cycle time
Ponnambalan et al. (1999) describes the same two approaches, and further argues that: Type I is usually performed when designing new assembly lines. Minimizing the number of workstations leads to lower labor costs and possibly reduced space
requirements. This requires that the desired production rate, work tasks, cycle times and precedence constraints are known.
Type II, on the other hand, is more commonly used when a company wants to optimize an already existing assembly line without purchasing new machinery. By minimizing the cycle times, the production rate will be maximized. It is important to take subassembly lines into consideration while balancing the main line.
4 Empirical data
This chapter provides the empirical foundation of the case study. To introduce the chapter, a description of the case company and the case study’s objective is given. Further, collected empirical data from observations, document study, time measurements and focus groups are presented.
Case company description
Husqvarna Group started its business in 1689 in the small town with the same name (Huskvarna) in Småland, Sweden. The company has since manufactured a wide variety of products – for example weapons, sewing machines, kitchen equipment, bicycles and motorcycles. The first lawn mower was made in 1919 and since then, Husqvarna Group continued on the outdoor power product path which still is the main focus. The company today has three divisions in different product areas. Besides producing lawn mowers, the company is one of the world leaders in watering products, forest cutting equipment and power tools for the construction industry. The long history of Husqvarna Group has formed the company to what it is today. Work towards a sustainable future, technological innovation and value for the customer are the company core focus areas. The company’s net sales reach 41 billion SEK (approximately 4 billion USD) and the company has more than 13 000 employees in over 100 different countries in the world. (Husqvarna Group, n.d.)
One of these locations is the Orangeburg facility in South Carolina, USA, where the case study has been conducted. In this plant, the main activity is assembling of lawn mower tractors. The plant has approximately 1500 employees and the volume of products assembled is approximately 302,000 a year. About 60,000 units are produced in the studied assembly line, making up 20 percent of the total yearly amount. (Rhea, et al., 2020)
Being a lawn mower manufacturer means strongly seasonal business and this also applies to the plant in Orangeburg. From January to May, the production is triggered by Make-to-Order. Throughout this period the company has about 300 temporary operators, making up about 25 percent of the total operating core staff. From June to December, production goes by Make-to-Stock. In these months, the production rate is only about 80% of high season rate and the production is completely closed for four weeks throughout this period. This has led to the initiative of project TREX - Tractor Residental Extended Season. From year 2020 the production will not close for four weeks but continue the whole year round, this means that the production schedule must change. Production needs to be spread out over the year and the number of temporary operators will be reduced. There is also a goal of increasing output volume on the studied assembly line, which will be the focus area in the case study. (Rhea, et al., 2020)
RQ I – How can an assembly line be designed?
To gain an understanding of the studied assembly line’s design, document study and an observation was conducted. The findings are presented below.
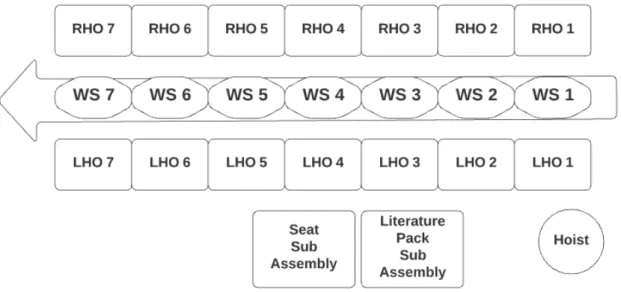
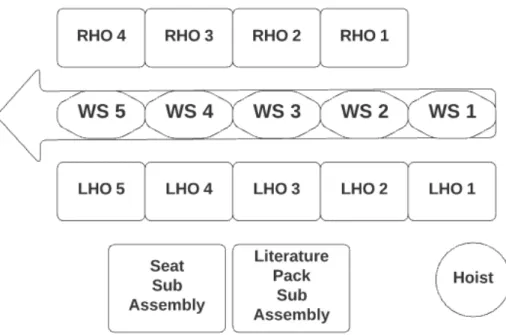
The main activity on the assembly line is packaging of lawn mower tractors. A mechanical conveyor moves units through workstations with a takt time of 60 seconds and the assembly line does not have any buffer option. There are several distinct models running on the line, these are of similar size and design and run on the line in different
batches. Each workstation along the assembly line requires that the work tasks from prior workstations have been performed. Additionally, line stops occur at times due to problems arising in the packaging area or in previous parts of the assembly line. Besides the workstations connected directly to the assembly line, there are two assembly stations, Literature Pack Sub Assembly and Seat Sub Assembly. Each sub-assembly station has one operator. Most times, there is a stock of literature packs and seats for assembly line operators to pick up and attach to the unit.
Depending on the shipment method, two different packaging types are used. The lawn mower tractors are packaged in either a metal crate or on a wooden pallet. The two different packaging types involves different types of work tasks but are of similar nature. The metal crate process contains seven workstations (WS) and the wooden pallet process contains five workstations. The assembly processes are visualized in Figures 6 and 7.
Each workstation on the assembly line involves two sets of work tasks. These are performed by one operator on each side of the assembly line, a right-hand-side operator (RHO) and a left-hand-side operator (LHO). One exception is in the wooden pallet process, which only involves one operator in the first workstation. In general, the LHOs and RHOs have similar work tasks. The work task could be strapping, and each operator is assigned different parts of the unit to strap. For instance, the LHO is responsible for strapping the unit on the front and left side while the RHO did the rear and right side. No special skills are required for any of the tasks on the assembly line. To run the hoist some training is necessary.
Figure 7 - Wooden pallet assembly process
The hoist is the only firm resource along the assembly line. This is used to load both metal crates and wooden pallets to the assembly line. This is placed at the start of the assembly line on the left-hand (LH) side. Other tools that are used are a staple gun and a nail gun for wooden pallets and a zip tie tool for metal crates. These do not have a firm location but are kept within the area of the assembly line. Nails are used for wooden pallets while hitch pins and wire ties for metal crates. The same plastic bags and labels are used for both packaging types.
The document study involved work descriptions for wooden pallet and metal crate packaging and was retrieved through the case company’s database. Further, these were compared to the work tasks on the assembly line through observation. Through the observation it was found that operators did not always follow the given work descriptions. Some steps are skipped, some are performed differently, and some steps are re-allocated in between the operators. The work descriptions were therefore updated. However, no workstations were taken away in this step. The updated work descriptions laid ground when performing the time measurements to answer research question two.
RQ II – Which potential improvement areas can be found in an assembly line?
To identify potential improvement areas, quantitative data was collected in the form of time measurements. Two time studies were performed, one for wooden pallets (See Appendix 1, 2 and 3) and one for metal crates (See Appendix 4 and 5). The updated work descriptions obtained from the document study and observation formed the basis for the time study.
Each operator has 60 seconds to finish the listed tasks for the workstation. Some operators are responsible for one work task while others for several. In the Appendices 1-5, LH workstations are marked in grey and RH workstations are in white. Total cycle time for each workstation is marked in orange. Work tasks count how many steps the
operator is responsible for, followed by the job description and the average cycle time to perform the work task. The average cycle time is calculated based on five measurements.
The average cycle times are all below 60 seconds. However, the longest workstation cycle times are 55,70 seconds and 55,21 seconds. These were the Sub Seat Assembly Station and the LH side of Workstation 1 for metal crates. The longest single work task is loading pallet to the line, which belongs to Workstation 1. For wooden pallets this work task in average takes 26,51 seconds and for metal crates it takes 37,03 seconds. For metal crates, the workstations 2 and 3 involves strapping the front respective the back of the unit and were both designed to be performed by in total four operators, two on each side of the assembly line. However, it was found through observation that only two operators perform these work tasks. One RHO secures both sides in the rear of the unit and one LHO secures the front with straps.
RQ III – How can assembly line balancing be used to improve productivity?
To answer research question three, meetings with a focus group were conducted. The objective with the meetings was to discuss the running improvement project at the case company. The discussions are to some extent confidential and therefore only a short summary of the empirical data is included in the thesis.
One part of the improvement project was the productivity rate in the studied assembly line. Hence, one of the topics discussed was the collected time measurements. It was stated that Workstation 1 with metal crate packaging had distinguishing cycle time and therefore was a potential improvement area. It was discussed whether it was feasible to re-allocate work tasks between operators in order to reduce the cycle time. One possible strategy could be implementing a higher division of labor to the workstation and add more operators to perform the work tasks.
5 Analysis
This chapter presents an analysis of the literature study and collected empirical data from the case study. The aim is to find connections between existing theories and findings from the case study and thereafter apply the selected theories on a real-life case, in order to answer the research questions.
RQ I – How can an assembly line be designed?
Olhager (2000) describes that assembly line production is an appropriate method for high volume, standardized and low variation goods throughout a longer production period. In one year, the case company manufactures 302,000 units, where approximately 20 percent is assembled in the studied assembly line. This high demand makes assembly line a suitable method for the objective, which is packaging of lawn mowers tractors.
The studied assembly line has a classical design that goes in line with previously presented theories. The case company is using what Olhager (2000) refers to as a Continuous Assembly Flow, meaning an assembly line without buffer options and with a mechanical conveyor moving the units from one workstation to the next. Further, a Batch Assembly method is used which Thomopoulos (2014) argue is an assembly setup where several different models are running on the assembly line but in individual batches. Precedence constraints have been taken into consideration in the assembly line design and do not allow many changes to the workstation sequence. Each workstation has two operators, performing work tasks from each side of the assembly line. One exception is the Workstation 1 with wooden pallets, which only has an LHO.
The lawn mower tractors models are of similar size and design. Therefore, differences in product design between the models is not a factor that need attention when formulating the packaging work tasks. What instead appears as a critical factor is the later coming shipment process of the units. The shipment requires the lawn mowers tractors to be packaged in two different ways – with metal crates or wooden pallets. However, this results in only two sets of work tasks which makes the design of the assembly line relatively uncomplicated. According to Thomopoulus (2014), designing an assembly line is less complex when the different products on the line are to be assembled similarly.
The metal crate and wooden pallet tasks differ but are of similar nature through the start to the finish (See Appendices 1-5). The first step involves loading the unit to either the pallet or the crate, followed by securing the unit to respective packaging type with straps. Next, a literature pack is placed on one of the arm rests and a cardboard sheet and a seat is placed on the unit. Then the unit is covered by a plastic bag and secured. Lastly, labels are put on the package. However, tasks differ in form of how to assemble and secure the crate and the pallet. For the crate, hitch pins and wire ties are used compared to the pallet where nails are used. These differences are necessary from material reasons.
Further Olhager (2000) states that resources should be placed in the same order for which work tasks are to be performed and close to the assembly line. Resources and tools needed for packaging is a hoist, staple gun, nail gun and zip tie tool. Only the first mentioned has a firm location and is placed at the beginning of the assembly line. The possibility to use the same hoist for both the crates and the pallets facilitates the
assembly line design. Staple guns, nail guns and zip tie tools are kept close to the assembly line but do not have a specific location.
As the case assembly line is of classical design, a classical improvement method may be conducted. Thomopoulos (2014) argue that to make a batch assembly line run productive, ALB is an appropriate improvement method to use.
RQ II – Which potential improvement areas can be found in an assembly line?
To monitor pace of production, cycle time and takt time are two simple tools to use. Takt time refers to the desirable production pace with regards to the customer demand, while cycle time is the actual time is takes to produce one unit. If these two time measurements are not synchronized, either overproduction or bottlenecks will appear, making it an area for improvements (Gao & Low, 2014). The purpose of the time study was to identify if any workstation’s cycle time was preventing the reduction of takt time, which currently is 60 seconds. In other words, to investigate if there were any potential bottlenecks in the assembly line. TOC says that to achieve higher performance of a system, the bottleneck needs to be the focus area for improvement work. The first step when addressing a TOC problem according to Sproull (2019) is to identify the bottleneck.
The longest cycle times were found in the following two workstations: 1. Workstation 1
When packaging with metal crates, the LH side workstation on average took 55,21 seconds to perform. The cycle time is shorter than the current takt time, meaning that production runs according to schedule. However, in order to reduce takt time and increase production volume, this workstation will appear as a bottleneck.
It was observed that the operator on the LH side worked continuously, while the operator on the RH side and on the following operators got spare time between performing their work tasks. In addition, Workstation 1 was identified as a potential improvement area by the focus group due to its long cycle time.
2. Seat Sub Assembly
These work tasks on average took 55,70 seconds to perform, which is slightly under the current takt time. Reducing the takt time would, according to the time study, result in the workstation being the bottleneck in the system. The sub seat assembly being a possible bottleneck could not be foreseen through observation. Prepared seats were always lined up for the assembly line operator to pick up.
Since this is a sub-assembly, the station is not affected by occasional stops on the assembly line. This could be an explanation of the observed stock of seats, despite the long cycle time.
By combining the empirical data from the time measurements, the observations and focus group meetings, Workstation 1 appeared to be the most critical bottleneck. Therefore, only this part of the assembly line will be investigated further, since the TOC
says that the weakest link is to be addressed before other parts of the system are improved.
RQ III – How can assembly line balancing be used to improve productivity?
When a potential problem area is identified, it needs to be tackled. The second step when addressing a TOC problem is to find a way to exploit the system’s bottleneck. According to Sproull (2019), bottlenecks are broken through actions as for example off-loading work tasks from the bottleneck to other parts of the system. This led to the decision to use ALB as a tool to break the bottleneck. The objective of ALB is to use resources in a high productive way by allocating the work tasks evenly between operators (Olhager, 2000). Also, according to Thomopoulus (2014) is ALB an appropriate improvement method when a Batch Assembly layout is used.
According to Pereira (2018), the requirements for performing simple ALB is knowing the precedence constraints as well as the workstations’ cycle times. The current work task sequence is designed with precedence constraints in consideration. Each work task is dependent on the previous work task, why there cannot be any changes to the work task sequence. The cycle times for each workstation was collected through time measurements, see Appendices 1-5.
If there are more critical factors to consider when designing the assembly line, the problem is referred to as a general ALB problem (Pereira, 2018) and these factors need to be mapped. Additional found critical factors have been formulated below:
Differences in model design do not make out a critical factor on why these will not be an affecting factor when performing ALB. The different sets of work tasks for the packaging types are relatively independent of each other. However, there are factors that are directly involved in both packaging types which have to be taken into consideration when performing ALB. These factors are the operators, resources, material and the mechanical conveyor. No special workforce skills are required for any of the tasks on the assembly line. To run the hoist some training is needed but is not considered a factor of major importance to the ALB problem. The hoist is a firm resource, hence changing its location is a major project. Yet, if the hoist is to be moved when performing ALB, the wooden pallet work tasks need to be taken into consideration as it is dependent on the same resource. The materials used for both packaging types are plastic bags and labels. Hence, if work tasks related to using this material are moved, another material station might need to be set up or the operator will have to use more time to go and pick up the material. The mechanical conveyor is a firm installation, why any changes to this shall be avoided if possible. The tools used differs between the packaging types, why any changes related to tools will not affect the wooden pallet work tasks. Other tools used for metal crates are all small and easy to move, hence this will not be a critical factor in the ALB problem.
One way to approach an ALB problem is to minimize the cycle time at a given number of workstations (Olhager, 2000). Also, according to Ponnambalan et al., 1999) this method is most commonly used when improving an already existing assembly line. This corresponds well with the case company’s objective to reduce the takt time and increase the production volume in the studied assembly line.
To exploit the Workstation 1 bottleneck, the work task with longest cycle time need to be separated from other work tasks and performed by one operator. This is the work tasks of LHO 1, which in total takes 55,21 seconds (See Table 2). Related work tasks need to be re-allocated to another workstation and performed by a different operator. This can be done by dividing the first workstation into two separate workstations on the LH side (See Table 3). One operator is responsible for pushing the unit to the edge and loading the crate to the assembly line while another operator will load the unit to the crate. On the RH side, assistance will only be necessary for the second mentioned work task, loading the unit to the crate. This results in a similar set up to the wooden pallets, where the work tasks involving loading the pallet to the line is a separate workstation only performed on the LH side.
Table 2 - Original work descriptions
Table 3 - Suggestion on improvement
The third step when addressing a TOC problem is to subordinate everything else to the bottleneck. Strapping only requires one operator on each side of the assembly line, why these two workstations will be joined. Hence, the same number of workstations is kept, which is one of the requirements when performing ALB according to Olhager (2000). However, this results in one less operator on the RH side (See Figure 8) and a reduction in cycle time for Workstation 1 to an average of 42,80 seconds, a reduction of 12,41 seconds, which means that step 4 - elevating the system, is not necessary.
Workstation Work task Job description Average St. dev.
RH 1 1 Load unit to crate. 12,41 2,00
Total 12,41 2,00
LH 1 1 Push unit to "the edge" 5,76 0,75
LH 1 2
Using lift, get metal crate and load to conveyor. Assist LHS operator by unfolding back and front
of crate. 37,03 2,86
LH 1 3 Load unit to crate. 12,41 2,00
Total 55,21 2,87
RH 2 1 Get strap and use to secure rear of unit. 43,56 4,84
Total 43,56 4,84
LH 2 1 Get strap and use to secure rear of unit. -
-Total -
-RH 3 1 Get strap and use to secure front of unit. 24,26 3,76
Total 24,26 3,76
LH 3 1 Get strap and use to secure front of unit. -
-Total -
-RZ Metal Crate Suggestion on improvement
Workstation Work task Job description Average
LH 1 1 Push unit to "the edge" 5,76
LH 1 2
Using lift, get metal crate and load to conveyor.
Unfold back and front of crate. 37,03
Total 42,80
RH 1 1 Load unit to crate with assistance of LH operator 12,41 LH 2 1 Load unit to crate with assistance of RH operator 12,41 RH 2 1 Get 2 straps and use to secure front of unit. 24,26 LH 3 1 Get 2 straps and use to secure rear of unit. 43,56
By adding some margins, the current 60 second takt time could be reduced with approximately 10 seconds. This is a major reduction and by implementing this, the case company goal to increase production volume will be possible. Also, reducing the numbers of operators will results in lower costs, which was another case company goal.
6 Discussion and conclusion
The following chapter summarizes and presents the study’s result by discussing and answering the research questions. Further, a discussion of chosen methodology is provided as well as theoretical and empirical contribution and limitations of the study. At the end of the chapter, final conclusions and suggestions for further research are given.
Research question I
Assembly line design is a complex process due to many constraints and critical factors in industrial problems. Factors that have a big impact on the assembly line design are, among others, precedence constraints. In the studied assembly line, there could be no changes to the workstation sequence because of work task dependencies. Other factors to consider is the surrounding processes. In the case study is was shown that different shipment methods of the goods required different types of packaging, which resulted in different work tasks along the assembly line.
The more constraints and variation in work tasks, the more complicated is the assembly line design. Location of resources, material and tools should be subordinate to workstations to achieve maximum productivity.
It is importance to build an understanding for the assembly line design since the different types affects which tool for improvement work is more appropriate. If critical factors are mapped out and if the assembly line design is kept close aligned with the theories, classical improvement methods may be successfully conducted.
Research question II
By having a clear objective with the improvement work, potential improvement areas can be identified. When the objective is to increase productivity through reduction of takt time, identifying potential improvement areas with TOC was found to be a suitable method. TOC says that a system is never stronger than its weakest link. Hence, to improve the performance of an assembly line the bottleneck needs to be fully exploited. Cycle times were used to identify the bottleneck. By measuring cycle times throughout the assembly line in a consistent and reliable way, the workstation with the longest cycle time was found to be the potential bottleneck of the assembly line. To perform cycle time measurements accurately, it is required that the assembly line have well defined and accurate work descriptions.
In the case study, Workstation 1 and Seat Sub Assembly were identified as potential improvement areas. However, TOC says that the bottlenecks are to be addressed one-by-one. Workstation 1 was found to be the more critical bottleneck. This was due to information obtained through observation and focus group meetings. At times, assembly line stops occurred due to reasons out of the studied assembly line’s control. These stops affected Workstation 1, but not the Seat Sub Assembly. This resulted in the Sub Seat Assembly station not being considered as critical, why only Workstation 1 was investigated further.
Research question III
One strategy for improving productivity is through ALB. However, this method comes with certain requirements. Firstly, ALB requires known cycle times. The assembly line also requires known precedence constraints and if there are any other critical factors