By
Philip T. Partain and Graeme L
.
Stephens
Department of Atmospheric Science
Colorado State University
Fort Collins, Colorado
Research supported by Department of Energy contracts #DE-FG-03-94ER61748, DE-FG-03-95ER61985
and DE-FG-03-97ER62357 PI: G. Stephens
APPROACH TO MONTE CARLO MODELING
Philip T. Partain and Graeme L. Stephens
Research supported by Department of Energy contracts #DE-FG-0:3-94ER61748 , #DE-FG-0:3-9,5ER6198.5, and #DE-FG-03-97ER623.57
Principal Investigator: Graeme 1. Stephens
Department of Atmospheric Science Colorado State University
Fort Collins, Colorado
February, 1998
HETEROGENEOUS ATMOSPHERES: A NEW
APPROACH TO MONTE CARLO MODELING
Philip T. Partain and Graeme L. Stephens
Research supported by Department of Energy contracts #DE-FG-O;~-94ER61748 , #DE-FG-03-95ER61985, and #DE-FG-03-97ER62:357
Principal Investigator: Graeme L. Stephens
Department of Atmospheric Science Colorado State University
Fort Collins, Colorado
February, 1998
ABSORPTION OF SOLAR RADIATION BY HETEROGENEOUS ATMOSPHERES: A NEW APPROACH TO MONTE CARLO MODELING
The debate involving the observation of solar radiation absorption in the atmosphere in excess of model prediction has plagued the atmospheric science community for over forty years. If true, this discrepancy has major implications on our understanding of solar radia-tive transfer, remote sensing, atmospheric dynamics, and global climate. Past comparisons between theory and observations of atmospheric absorption have primarily shown results ranging from model underestimation of absorption to good agreement, however model overestimation has also been presented.
To reconcile the magnitude and cause of the absorption discrepancy, the Department of Energy Atmospheric Radiation Measurement (ARM) Program implemented the ARM Enhanced Shortwave Experiment (ARES E) in northern Oklahoma. Recent re:=mlts from this experiment published by Zender et al. (1997) and Valero et al. (1997) report not only that absorption in the atmosphere is in excess of model prediction, but is larger than indicated by the studies which first introduced the problem.
Throughout the literature, many possible causes for this discrepancy have been pro-posed. These include, (1) instrument error or inadequate measurement technique, (2) inaccurate specification of the observed atmosphere in radiative transfer models, (:3) in-accurate absorption theory for aerosol, gas, or cloud, and (4) the unresolved effect of cloud heterogeneity. Of all possible causes, the least well understood is the effect of cloud heterogeneity. This study investigated the effect of cloud heterogeneity on gas and cloud absorption of solar radiation. This was accomplished with a three-dimensional, broadband
was derived from the Equivalence Theorem as introduced by Irvine (1964) and repreHents a new and major advancement in the power and utility of the Monte Carlo method.
Results from experiments showed that, for the cloud situations modeled, the effect of cloud heterogeneity on absorption is too small to explain ARESE observations but could be important for applications such as general circulation modeling where cloud fields are assumed to be plane-parallel. Two ARESE cases are revisited to try and determine the nature of the observed excess absorption. Using spectral simulations from the Monte Carlo model and what was learned from the cloud heterogeneity experiments, it was discovered that an inconsistency exists between the broadband and spectral instruments used to measure radiative fluxes. Using the spectral instruments in conjunction with model results decreased the absorption discrepancy between theory and observations from 16% to 5% on the overcast day.
III
Philip T. Partain
Department of Atmospheric Science Colorado State University
Fort Collins, Colorado 8052;3 Spring 199R
We are indebted to several people who have helped make this research possible. We would first like to thank Dr. David Randall and Dr. Richard Eykholt for their review of the manuscript. Andrew Heidinger started work in the application of the Equivalence Theorem to problems such as those investigated in this work and assisted in its implementation. He provided invaluable help in constructing the Monte Carlo model and also created the 32-stream adding-doubling model which was used to validate the Monte Carlo/Equivalence Theorem model. Many discussions were held with Philip Gabriel who helped with Monte Carlo modeling issues and statistical probability along with many other questions and concerns. Paul Stackhouse created a two-stream model from which the k-distribution data and its implementation were obtained.
Discussions held with other colleagues here at Colorado State University also aided in the completion of this work. In particular, Steve Miller, Charles Drummond, and Ian \Vittmeyer contributed many ideas and/or support. We are also grateful to Sue Lini and Angie Narum who helped with a variety of administrative concerns.
Funding for this research was provided by Department of Energy contracts
#DE-FG-O;~-94ER61748, #DE-FG-03-95ER61985, and #DE-FG-03-97ER62;~57. Data
were obtained from thf) Atmospheric Radiation Measurement (ARM) Program sponsored by the U.S. Department of Energy, Office of Energy Research, Office of Health and Envi-ronmental Research, EnviEnvi-ronmental Sciences Division.
1 Introduction 1 1.1 The Nature of the Problem . . . " 1 1.2 The Shortwave Solar Spectrum and the Measurement of Atmospheric Absorption 3
1.3 The ARM Program and the ARESE lOP 8
1.4 Scientific Objectives . 10
1.1) Plan Of This Research . . . 11
2 A History of Model and Observation Discrepancy 13
2.1 Introduction... 1:3
2.2 Observations of Anomalous Absorption .. 14
2.3 Observations of No Anomalous Absorption 20
2.4 Operational Error Sources . 2:3
2.1.1 Model Input Error 2:3
2.4.2 Observation Error . 24
2 .. 5 Absorption Theory . . 21)
2.,).1 Aerosol Absorption. 2,)
2 .. 5.2 Gas Absorption. . . 26
2.5.:3 Cloud Absorption . 27
2.5A The Effect of Cloud Heterogeneity 2K
2.6 Results From the ARESE lOP 29
2.7 Summary . . . :30
3 Required Atmospheric Radiative Transfer Theory 33
:3.1 Introduction... 3;3
;L2 Basic Optical Properties . . :B
:3.2.1 The Gaseous Atmosphere :3;3
:3.2.2 Cloud Particles . . . :3(j
:L3 The One-Dimensional Radiative Transfer Equation ;38
:3.4 Summary . . . 40
4 The Monte Carlo Model 42
4.1 Introduction... 42
4.2 Integration Using the Monte Carlo Method 4:3
4.~3 A Simple Monte Carlo Model . . . 44
4.4 The Monte Carlo Model Used for this Study 46
4.4.1 Measurement Levels 47
4.4.2 Cloud Heterogeneity 47
4.4.3 Rayleigh Scattering 48
4.4.4 Variance Reduction 48
5 Gaseous Absorption .5.1 Introduction . . . .
<'>.2 The K-Distribution Method 5.2.1 K-Distribution Theory .. 5.2.2 K-Distribution Implementation
5.:3 The Equivalence Theorem . . . . .5.3.1 Application to Gas Absorption
5.3.2 Application to Cloud and Surface Absorption 5.:3.3 Equivalence Theorem Implementation
.5.'1 Model Performance.
.5.5 Summary . . . .
6 Accurate Me JET Simulation of the Shortwave Spectrum fi.1 Introduction . . . .
6.2 Subdivision of the Shortwave Spectrum (j.:3 Model Performance. 6.4 Summary . . . . 54 54
56
56
57 60 60 6;3 67 71n
79 79 79 82 877 Experiments and Results I: The Theoretical Effect of Cloud
Heterogene-ily 88
7.1 Introduction... 88
7.2 The Model Atmosphere . 88
7.2.1 Cloud Characterization 89
7.2.2 Surface Characterization 7.2.:3 Gas Profile . . . .
7.3 Spatial Heterogeneity and the Redistribution of Radiation 7.3.1 Fluxes and Total Atmospheric Absorption.
7.:3.2 The Effect of Cloud . . . .
7.:3.:.3 The Effect of Gas . . . . 7.:3.4 The Effect of Cloud Distribution on Albedo.
7.4 Internal Heterogeneity and the Redistribution of Radiation
7.5 Combining Spatial and Internal Heterogeneity: Landsat Simulations 7.f) Summary . . . . 89 89 90
92
9396
· 100 · 105 · 107 · 109 8 Experiments and Results II: Comparisons of Simulated and ObservedAtmospheric Absorption 111
8.1 Introduction . . . III 8.2 Surface Albedo Retrieval. . . 112 8.:3 ARESE Case Studies: Comparisons to RAMS Broadband and TDDR and SSP
Spectral Quantities
8.:3.1 11 October 199.1 . . . . 8.3.2 30 October 1995 . . . . 8.4 A Consistency Analysis and a Probable Discrepancy Source 8.5 30 October Absorption Inferred by TDDR, SSP, and Theory
8.6 Summary . . . . vi · 113 .113 · 118 .124 · 127 · 129
9.2 T'he Effect of Cloud Heterogeneity on Flux, Absorption, and Albedo · 1:3:3
9.:{ ARESE Comparisons . . . . · B4
9.4 Suggestions for Future Research · US
REFERENCES 137
A Formulation of the Total Flux Equation For Various Combinations of
Atmospheric Absorbers 142
1.1 Downwelling solar spectral flux at TOA and the ranges of the VIS and NIR portions of the spectrum. . . . 4 1.2 A common method of observing column absorption involves differencing the
net flux above and below cloud. . . . . S
1.3 Spectral ranges or measurement wavelengths of the TSBR, FSBR, SSP, and TDDR instruments. . . . 10 2.1 Comparison of the calculated (heavy curves) and measured (light curves)
spec-tral reflectances for two Sc cases. The comparisons are shown for cloud top a.nd some level approximately in the middle of the cloud. Also included in the lower panel are the measured and theoretically derived broadba.nd albedos and shortwave absorption estimates. (from Stephens and Platt, 1987) 16 2.2 Calculations of the similarity parameter as a function of wavelength for water
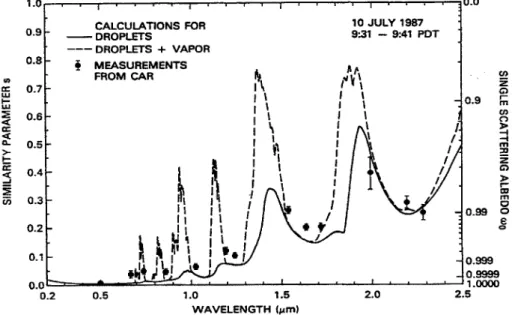
droplets alone (solid line) and drops pI us vapor ( dashed line) for a cloud droplet size distribution and water vapor conditions of the marine stratocu-mulus cloud of 10 .J uly 1987. The single scattering albedo scale is valid at
0.754 pm, where the cloud asymmetry factor g
=
0.848. The measurementsderived from the cloud absorption radiometer (solid circles with error bars) are averages of the similarity parameter derived by applying the diffusion domain method to a .50 km section of the cloud. (from King et al., 1987) .. 18 :L3 Comparison of values of,8 (determined from the ECMWF GCM and CCM2)
with the observed values. The vertical bars denote the 9.5% confidence intervals of the observations. (from Cess et al., 1995) . . . .. 19 2.4 Scatter plots of the modeled and (a) observed absorptance, (b) true
absorp-tance, (c) observed albedo, and (d) observed transmittance for four cloud cases. The model results are those initialized with the minimum and max-imum profiles of LWCjr'e as explained in the key. (from Taylor et al., 1996) 22 2.5 Observed and modeled instantaneous surface insolation, albedo, and absorption
for :30 October 1995. Solid circles indicate total shortwave and open cirles
indicate NIR (adapted from Zender et al., 1997). . . . . " ;32
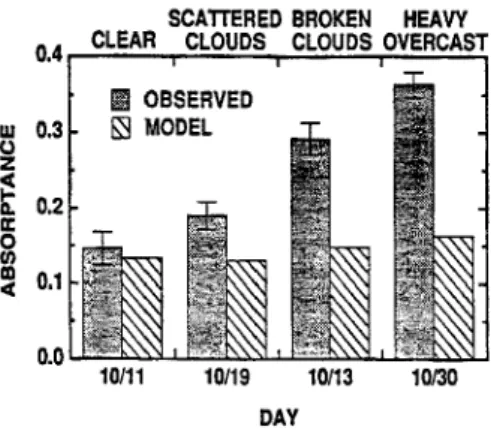
2.G Comparison of the observed and modeled column absorptance for 1 days (from Valero 81, a1., 1997) . . . " :32
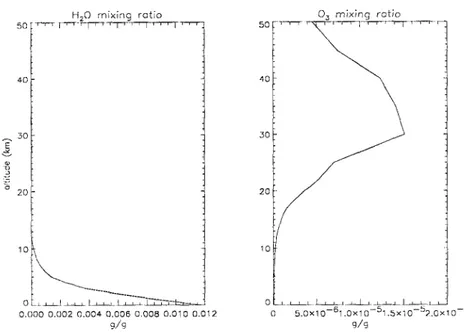
3.1 Mixing ratios for H20 and 03 for the standard mid-latitude summer atmosphere. :34
:3.2 Rayleigh optical depth for the atmosphere layer between 50 and 0 km as a function of wavelength . . . . . 35 :3.:3 Phase function examples including the Diermendjian C1, single and double
Henyey-Greenstein. All have an effective asymmetry parameter gej j = .85 37
:~.4 Optical properties of a stratocumulus I (ScI) cloud as computed by Stephens (1979). . . . . :39
x-z plane to illustrate the zenith angle fL and the other in the y-z plane to illustrate the azimuth angle <p. . . • . • . . . . (15
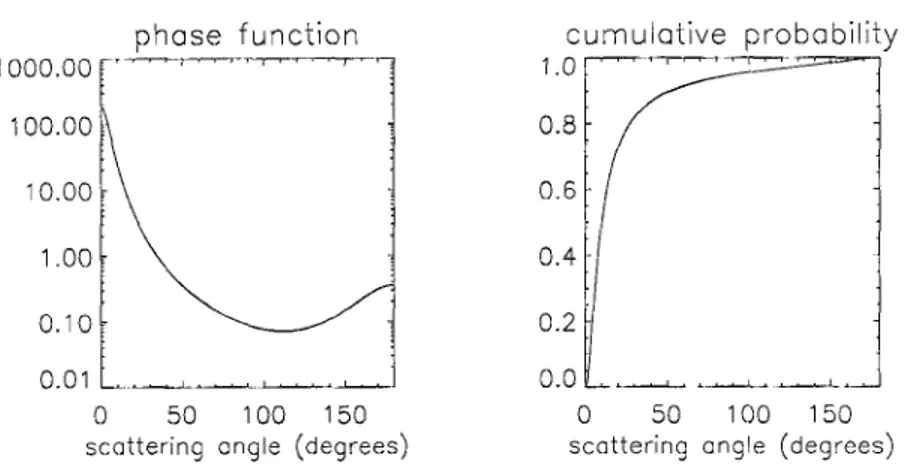
4.;~ Double lIenyey-Greenstein phase function and its associated cumulative density function, geJ J = .8,1 . . . 46 4.4 An example of the summed optical pa,th for a photon which travels through 4
cloud pixels, each with a different extinction coefficient. . . . 18 4.5 Convergence rate for the Monte Carlo model using two different random
num-ber generators. Relative errors are shown for a single layer cloud, T
=
.1,9
=
.85, and Wo=
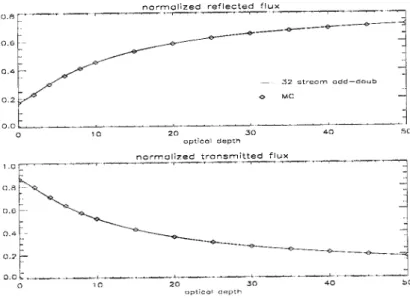
1 . . . " 504.6 Flux comparisons between the Monte Carlo code and a ;~2-stream adding-doubling model: single layer cloud, flo = .866, gefJ = .8.5 (double Henyey-Greestein), a: = .2, Wo = 1. . . 52 4.7 Flux comparisons between the Monte Carlo code and a ;{2-stream
adding-doubling model: single layer cloud, 110
=
.866, 9 =eJJ .85 (double Henyey-Greestein), a: = .2, Wo = .9 . . . 52 4.8 Flux comparisons between the Monte Carlo code and a :32-streamadding-doubling model: single layer cloud, T
=
10, 9 =eJJ .85 (double Henyey-Greestein), a:=
.2, Wo=
1 . . . 5:~ 4.9 Flux comparisons between the Monte Carlo code and a :32-streamadding-doubling model: single layer cloud, T
=
10, 9 =eff .8.5 (double Henyey-Greestein), a:=
.2, Wo=
.9 . . . .5:3.5.1 Absorption coefficient k(v) in (em atm)-l as a function of (a) wavenumber and (b) cumulative probability k(g) for the 03 9.6-Wn band for a pressure of 2.5 mb and a temperature of 220 K. (from Fu and Liou, 1992) . . . 57 5.2 A path length pdf for downwelling flux at the surface. This example is from
the model run with a cloud in the lowest layer. a solar zenith angle of ·1f> degrees, and no Rayleigh scattering. . . . . . . 62 .1.:3 Path of one photon through 2 gas layers (scattering cloud not shown in layer
2).
h,
12 , andh
are used to calculate the mean gas extinction coefficient. G:305.4 The pdf
p(l,
n) is actually a collection of one pdf for each path length value. This example is for downwelling flux at the surface from the model run with a cloud in the lowest layer, a solar zenith angle of 4.5 degrees, and no Rayleigh scattering. . . . ()4 .1.5 A cloud scattering pdf for downwelling flux at the surface. This example isfrom the model run with a cloud in the lowest layer, a solar zenith angle of 45 degrees, and no Rayleigh scattering.. . . 65 05.6 A surface scattering pdf for downwelling flux at the surface. This example is
from the model run with a cloud in the lowest layer, a solar zenith a.ngle of 45 degrees, and no Rayleigh scattering. . . 66 5.7 A portrayal of the three-dimensional pdf
p(l,
8,r).
Integration of this pdf overone absorber results in a. two-dimensional pdf (one of three faces) that can be used to compute the flux associated with the remaining two absorbers. Integration over two absorbers results in a one dimensional pdf (one of three axes) which is used in a similar fashion. . . . . . . 67
crease in size from
p(l,
8, 7') allows this information to be stored in computerInemory. . . .. ·70 .5.9 Comparison of results from MC/ET and the 32-stream adding doubling model
without any atmospheric absorption. . . . . 74 5.10 Comparison of results from MC/ET and the 32-stream adding doubling model
when absorption by the surface is taken into account. . . . 7.5 5.11 Comparison of results from MC/ET and the 32-stream adding doubling model
when absorption by cloud is taken into account. . . ., 76 5.12 Comparison of results from MC/ET and the 32-stream adding doubling model
when absorption by gas is taken into account. . . .. 77 5.13 Comparison of results from MC/ET and the 32-stream adding doubling model
when surface, cloud, and gas absorptions are accounted for. . . . . 78 6.1 Results from the error minimization scheme to subdivide the shortwave solar
spectrum. The first row is the output normalized flux from the :32-stream model run at full resolution. The second and third rows are the absolute and relative errors incurred when the full resolution flux is approximated by 5 nodes and linear interpolation. . . . 8;3 6.2 Comparison of results from MC/ET and the 32-stream adding doubling model
without any atmospheric absorption. . . .. 8.5 6.:3 Comparison of results from MC/ET and the 32-stream adding doubling model
when gas, surface, and cloud absorption is used. . . 86 7.1 Fit to the SSP retrieved AR.ESE surface albedo used in all experiments 89 7.2 Temperature (solid) and dew point (dashed) profiles for :30 October 1995. 91 7.:3 Gas profiles used as model input. IhO profile to 24 km is obtained from ;30
October 1995 sounding. The H20 profile above 24 km and O:i profile are from standard atmosphere mid-latitude summer data. The dashed curve in the H20 mixing ratio profile is the standard mid-latitude mixing ratio for comparison. . . 91 7.4 Upwelling and downwelling fluxes at 10 km (top) and 0 km (bottom) as a
function of cloud fraction for ScI cloud between 1 and 2 km. The water vapor profile is saturated in the cloud layer. Dashed curves indicate plane-parallel fluxes for area averaged optical depth corresponding to each cloud fraction. . . .. 92 7.S The total column absorption for the case in Fig. 7.4. Dashed curve indicate
plane··parallel values for area averaged optical depth corresponding to each cloud fraction.. . . .. 93 7.6 The spectral absorption for a cloud fraction of .36 (solid) compared to that
obtained when the plane-parallel approximation (dashed) is used. . . . .. 94 7.7 Cloud absorption for the case in Fig. 7.4. Dashed curve indicate plane-parallel
values for area averaged optical depth corresponding to each cloud fraction. 95 7.8 Average cloud scattering order as a function of cloud fraction (solid) or
equiv-alent plane-parallel optical depth (dashed). Values were obtained from the
.726 lim top up and bottom down cloud scattering pdf for each cloud scenario. 96
7.10 The spectral cloud absorption for a cloud fraction of .:36 (solid) compared to that obtained when the plane-parallel approximation (dashed) is used. . .. 97 7.11 Gas absorption for the case in Fig. 7.4. Dashed curve indicate plane-parallel
values for area averaged optical depth corresponding to each cloud fraction. 98 7.12 Average photon path length as a function of cloud fraction (solid) or equivalent
plane-parallel optical depth (dashed). Values were obtained from the .726 pm top up and bottom down path length pdf for each cloud scenario. '" 100 7.B The .726 p'ni top up and bottom down photon path length pdf for cloud
frac-tion .36 (solid) and equivalent plane-parallel optical depth (dashed) cloud geometries. . . . . 101 7.14 The spectral gas absorption for a cloud fraction of .36 (solid) compared to that
obtained when the plane-parallel approximation (dashed) is used . . . 101 7.15 Albedo for the case in Fig. 7.4. Dashed curve indicate plane-parallel values for
area averaged optical depth corresponding to each cloud fraction . . . 102 7.16 Upwelling NIR/VIS flux ratio for broken cloud (solid line) and plane-parallel
cloud (dashed line) as a function of respective upwelling VIS flux. The diamonds indicate, from left to right, plane-parallel optical depths of 0.0, 0 .. 5, 0.16, 0.:36, 0.49, 0.64, 0.72, 0.81, 0.9, and 1.0 times the full Sel op-tical depths. The squares indicate cloud fractions of the same values for the broken cloud field. For upwelling flux values above 2.50 W rn-2, cloud
morphology and optical depth have very little impact on the NIR/VIS flux ratio . . . 104 7.17 Same as Fig. 7.16, except for spectral wavelengths. The wavelengths 0.87,
O.81Fl, and 0.762 are regions of strong water vapor, weak water vapor, and strong oxygen absorption, respectively . . . lOS 7.18 Fractal cloud field used to investigate the effect of internal heterogeneity. The
cloud fraction is 1.0 and the minimum and maximum visible optical depths are 1:3.12 a.nd 99.52 . . . 106 7.19 Scene from the Landsat satellite (left) and the portion of t.hat scene used in
the MC/ET model. The maximum cloud visible optical depth is 101.2 . . . . 108 8.1 Spectral response functions of the RAMS TSBR (solid line) and FSBR (dashed
line) pyranomet.ers. . . 112 8.2 SGP CART site and aircraft flight strategies (dotted line). SSP measurement.s
m,;ed for albedo retrieval were made during a t.hree-Ieg low level instrument comparison flight . . . 113 8.3 SSP retrieved ARESE surface albedo (solid) and the fit used in modeling
sim-ulations (dashed).. . . 114 1i.4 Downwelling Egrett and Otter total broadband flux (dark traces where the
Otter measurement is lower) and upwelling Egrett and Otter total broad-band flux (light traces) for the clear sky case of 11 October 199.5. Model simulation was performed for the time period indicated by the shaded region.lI.5 1i.5 SGP CART site and aircraft flight strategies (dotted line). Flight track where
measurements are used for comparison to model simulation is shown as a dark line between small squares. . . . . 115
an altitude of 13.6 km. Bottom: CDL image obtained during the flight leg between 17.,55 and 17.62 UTC on 11 October 1995 . . . 116 8.7 Above cloud (Egrett) and below cloud (Otter) spectral flux as simulated by
MC/ET (solid line), observed by TDDR (squares), and observed by SSP (diamonds) . . . 117 8.8 Downwelling Egrett and Otter total broadband flux (dark traces where the
Ot-ter measurement is lower) and upwelling Egrett and OtOt-ter total broadband flux (light traces where the Otter measurement is lower) for the overcast case of ;30 October 199,5. Model simulation was performed for the time period indicated by the shaded region. . . 120 8.9 SG P CART site and aircraft flight strategies (dotted line). Flight track where
measurements are used for comparison to model simulation is shown as a dark line between small squares. . . . . 120 8.10 Upper left: 17.5 UTC sounding from the Central Facility in Lamont returned
temperature (solid) and dew point (dashed) from which water vapor mixing ratio was determined. Upper right: WFOV image taken from the Egrett at an altitude of 13.,5 km. Bottom: CDL image obtained during the flight leg between 17.6.5 and 17.9 UTC on 30 October 199.5 . . . 122 8.11 Above cloud (Egrett) and below cloud (Otter) spectral flux as simulated by
Me/ET (solid line), observed by TDDR (squares), and observed by SSP (diamonds) . . . 123 8.12 Original simulated fluxes for 30 October 199.5 (dotted line), TDDR
measure-ments (squares), and SSP measurements (diamonds). The spectra used in the conservative assumption simulation are plotted as solid lines. . . . . 126 8.U Original simulated fluxes for 30 October 199,5 (dotted line), TDDR
measure-ments (squares), and SSP measurements (diamonds). The spectra derived to match broad band RAMS measurements are plotted as solid lines. . . 128
2.1 Summary of modeled and observed
f3
and f~ (adapted from Zender et aL 1997). ;~O .5.1 Gas absorption regions in the solar spectrum5.2 Reference parameters and scaling exponents .
6.1 Results from the error minimization scheme to subdivide the shortwave solar 59 .59
spectrurn. . . . . 82 6.2 relative errors between MC/ET and 32-stream (denoted "present study") and
between the Monte Carlo model of Hignett and Taylor (1996) and the ra .. diation scheme of Slingo and Schrecker (1982) (denoted "H
&
T (199G),") .. 87 7.1 Fluxes from the fractal cloud simulation compared to those computed usingarea-averaged optical depth. . . " 106 7.2 Absorptions from the fractal cloud simulation compared to those computed
llsing area-averaged optical depth. . . . . 107 7.:3 Fluxes from the Landsat cloud simulation compared to those computed using
area-averaged optical depth . . . 108 7.4 Absorptions from the Landsat cloud simulation compared to those computed
using area-averaged optical depth. . . . . 109 8.1 11 October 199.5 model vs. observation column albedo and absorption. . 119 8.2 ;30 October 199.5 model vs. observation column albedo and absorption. . 124 8.:~ Albedo and absorption results assuming 0.5 f.lm TDDR and SSP variation arE~
correct and all radiation outside of SSP wavelengths is absorbed . . . 127
INTRODUCTION
Are these large absorptances real, or are they caused by instrumental deficien-cies, or a three-dimensional effect? The ideal plane-parallel and homogeneous conditions are seldom realized, and hemispheric pyranometers may per'haps be somewhat i'nadequate for accurately determining fluxes in complicated cloud situations. Clearly, lnore sophisticated radiometric techniques are required to re80lve the cloud ab80rptance q'nestion.
-Herman (1977)
1.1 The Nature of the Problem
For more than four decades, a discrepancy between measured and simulated atmo-spheric absorption in the shortwave solar part of the electromagnetic spectrum has been observed in the presence of clouds. Studies have questioned to some degree every aspect of measurement uncertainty and theoretical inaccuracy, however the discrepancy still remains unresolved. If measured radiative fluxes are interpreted as truth, many simulations result in an underestimation of atmospheric absorption. This discrepancy, termed "anomalous absorption", has major implications on our understanding of radiative transfer in the Earth's atmosphere and all atmospheric processes that are affected by solar absorption. For example, about 70% of the globally averaged solar radiation incident on the top of the atmosphere (TOA) is absorbed by the surface and atmosphere. Small errors in par-titioning this absorption between surface and atmosphere can lead to large errors in our understanding of dynamic and climate processes. Roughly 80% of the solar radiation that is absorbed in the tropics is used to heat the surface and drive oceanic circulations. This
implies that the remaining 20% goes toward driving atmospheric circulations. Inaccurate specification of solar absorption leads to large errors in the ocean and a,tmosphere dynam-ics in climate models. This has implications on heat and energy budgets and, therefore, the state of the simulated equilibrium climat(~.
On a smaller scale, incorrect cloud absorption theory can have an effect on modeled cloud dynamics. Davis et al. (1979) note that inaccurate vertical profiles of solar absorption in modeled cloud systems have implications on cloud droplet growth and the static stability of the cloud layer.
In addition to atmospheric dynamics, incorrect absorption theory can lead to problems in remote sensing. Retrievals are dependent on forward model simulations which involve perturbing the optical properties of atmospheric constituents and calculating resulting flux or radiance. Inaccurate absorption theory can lead to a misrepresentation of the state of physical and optical properties of any given scene.
Ramanathan et al. (1995) refer to the problem concerning anomalous absorption as "a missing physics" that is not accounted for in present theory. This is a position that has gained much support in recent years in studies like Cess et al. (1995) and Pilewski and Valero (1995) which observe absorption in the presence of douds in excess of both model results and the results presented by earlier studies which first introduced the discrepancy. However, the physical cause of increased solar absorption in the atmosphere is only part of the controversy, Adding to the confusion are the many studies that have presented findings which agree with model simulations. Hence, it is unclear if the anomaly really exists. There are several factors which may be the cause of the discrepancy:
• Operational Errors
instrument error or inadequate measurement technique
inaccurate parameterization of observed atmospheric constituents used for model input
• Theoretical Errors
- unresolved effect of cloud heterogeneity
The goal of this study is to provide insight into the last item on the above list: the effect of cloud heterogeneity. Most simulations of observed fluxes are performed with a plane-parallel radiative transfer model. Under the plane-parallel approximation, cloud fields are horizontally homogeneous and infinite in extent. However, the horizontal homo-geneity of an actual cloud field rarely occurs on scales large enough to make this assump-tion valid. Stephens and Tsay (1990) note that the relevance of plane-parallel theory is
"much less developed" than the other possible causes of anomalous absorption. Though several studies have been published in the literature which have investigated the role of cloud heterogeneity on the reflection of radiation from clouds (usually though the use of a Monte Carlo model), few have investigated its effect on atmospheric absorption. Also, as a result of limited radiative transfer theory, none have investigated absorption at high spectral resolution across the shortwave solar spectrum. As Hignett and Taylor (1996) state, "greater spectral resolution in the broad-band Monte Carlo model will be necessary to compare with better spectrally resolved observations."
In this study, the development of a Monte Carlo model with unlimited spectral res-olution for atmospheric absorption properties is discussed. The model is then used to provide further insight into the role of cloud heterogeneity on the redistribution of solar radiation. Even if cloud heterogeneity does not solve the anomalous absorption issue, it still has many implications on the remote sensing (McKee and Cox, 1974; Stephens and Preisendorfer, 1984) and climate modeling communities (Harshvardhan and Randall,
19815).
1.2 The Shortwave Solar Spectrum and the Measurement of Atmospheric
Absorption
Shortwave solar radiation is defined as the electromagnetic radiation emitted from the sun that is incident on the top of the atmosphere (TOA) between the wavelengths of .2 and 4 lJ,m. The spectral emission of the sun can be approximated by the Planck
7000 E 1500 N:::i. 'E x 1000 c, 2 () ~ 500 cn o o
TO/\ downwelling solar flux
T--.--r-r--T-.-r-r--·i~...,...,--r' ~f-r--r--r--T·--.-,---r-T ~·1-'~ !
~~
j
I
i
___________
~1
VIS NIR-1
~-~~~j
2 3 4 wavelength (fJ-m)Figure 1.1: Downwelling solar spectral flux at TOA and the ranges of the VIS and NIR portions of the spectrum.
function:
. h 2
F, _ 27f C
II - y5(ehc/kllT _ 1) (1.1)
where y is the wavelength (the character A is reserved for use later in this study), h is
Planck's constant, T is the temperature of the emitter, c is the speed of light, and k is Boltzmann's constant. The temperature of the sun is near 6000 K. The solar spectral flux that reaches TOA is shown in Fig. 1.1. The spectral radiation curve shown differs from that of a. true blackbody described by the above equation as a result of absorption features in the snn '8 atmosphere.
The shortwave solar spectrum is divided into the visible (VIS) region which ranges from .2 to .68 11m and the near infrared region (NIR) which ranges from .68 to 4 f-1m. The spectral ranges of the VIS and NIR regions are also shown in Fig. 1.1. The spectral flux is expressed in ltV m-2 f-1m-1. The integration of spectral flux between two wavelengths provides the broadband flux which is expressed in W m-2
• Hence, integration of the
spectrum between .2 and 4 f-1m results in the total shortwave broadband flux whereas integration over the VIS or NIR regions result in VIS or NIR broadband flux.
r.t'\; bot= Fdll, bot- F~p, bot
- - - below cloud observation level
Figure 1.2: A common method of observing column absorption involves differencing the net flux above and below cloud.
Solar radiation that enters the atmosphere can be absorbed or scattered by clouds, gas, aerosol, and the Earth's surface. As seen in the first section of this chapter, the amount of atmospheric absorption that occurs is controversial. The most common method of estimating absorption from observations or model simulations is deriVE~d from an ellf~rg;y conservation relationship. Namely, for a conservatively scattering atmospheric column (no absorption) the flux in must equal the flux out. This is to say that the net fluxes at the top and base of the column must be equivalent. If absorption is present in the atmosphere, the amount is equal to the difference of the net fluxes:
A
=
(Fdn,top - Fup,top) - (Fdn,bot - Fup,bot)Fdn,top
(1.2)
This difference is normalized by the downwelling flux at TOA so that absorption is ex-pressed as a percentage of the incoming solar flux. For theoretical simulations, the fluxes at the required levels are produced by a model. For field observations, this requires measurements at the bottom of the column from surface or airborne instruments and measurements at the top of the column from airborne or space borne instruments. The geometric setup for obtaining the measurements important for estimating absorption is shown in Fig. 1.2.
Observations of atmospheric absorption in the field suffer from a problem not en-countered in model simulations. While the formulation for observing column absorption from a model or field observations in (1.2) is accurate for a plane-parallel cloud, sampling
issues arise when clouds become heterogeneous. These sampling issues are not a problem for simulations because clouds are approximated as plane-parallel. However, model error is created by this approximation and will be discussed later. When clouds become broken, flux measurements change depending upon where the measurements are made. Thus, to get a representative measurement of the area average fluxes for a single layer cloud field, the field must be sampled until it is determined that all scales of horizontal variability have been observed and that more measurements would be redundant. This determina-tion is almost impossible to perform while measurements are being made and very difficult to perform when analyzing data. Therefore, most measurements of absorption are said to be representative of the cloud field when the time series of absorption converges to a steady value. Of course, the accuracy of this method is variable and dependent on large scale cloud morphology. This is made increasingly difficult by the non-stationarity of cloud statistics. That is, clouds grow, move, and dissipate as measurements are being performed. Thus, averages and deviations change in time and space. For this reason, it may be impossible to adequately sample a cloud field.
To try and reduce errors created by cloud heterogeneity, Ackerman and Cox (1982) introduce a correction to (1.2). This correction accounts for leakage of solar radiation out tbe sides of broken clouds that is not measured by instruments above and below the cloud:
A = (Fdn,top - Fup,top) - (Fdn,bot - Fup,bot) -
I:
F.s
Fdn,top (l.:~)
where
I:
Fs is the unmeasured flux through the side of the cloud. To get an estimate of the flux through cloud side, absorption calculations are performed at a wavelength where absorption does not occur. If a positive or negative absorption results from this calculation, then it is attributed to "apparent" absorption and subtracted from or added to the total absorption. In addition to providing a better estimate of atmospheric absorption, this technique decreases the sampling time required for fluxes to converge.Other observation techniques can be used to infer atmospheric absorption. Among these is the use of column albedo. Albedo (R) is simply:
R
=
Fup,topmeasured at the top of the atmospheric column. Along with discrepancies in absorption, several studies have reported an overestimation of albedo by models. Assuming that surface albedo was properly assigned and downwelling flux at the top of the column is easily derived, a low observed albedo implies that the atmosphere absorbed more and reflected less solar radiation than theory describes. Albedo is a measurement that is inherently more reliable than net flux differencing because observations are made simultaneously in time and location.
Directional reflectance or vertical radiance is a measurement that is similar to albedo observation except that only upwelling radiation that enters the instrument from directly below in a vertical path is seen. This measurement can be compared to simulations, however this technique suffers greatly from sampling issues and cloud heterogeneity effects as noted by Foot (1988).
The parameter f3 has been created to provide information about atmospheric absorp-tion. This parameter is the slope of the line fit to a plot of observed or calculated TOA albedo versus normalized surface insolation:
(1..5) where T is the "transmission" of the atmosphere. The theory behind this procedure is that albedo plus transmission plus absorption is equal to one. Thus, the change in the slope of an albedo versus transmission plot should be due to changes in atmospheric absorption. Typical model values of f3 are around .8, whereas observations produce /1 near .55 (Cess et al, 1995).
A similar parameter,
is,
has also been used to infer the existence of anomalous ab-sorption. This parameter is the ratio of shortwave cloud forcing at the surface to that at TOA:is
= ~s,bot = Fnet,bot (cloud) - i':et,bot (clear)Cs,top Fnet,top(cloud) - 1'net,top(clear) (1.6)
Cloud forcing
C
s at the top or bottom of the atmosphere is the difference between theall sky (doudy) net flux and clear sky net flux. Model values are typically less than 1.2, whereas observations place this value closer to 1.5 (Ramanathan et al., 1995).
1.3 The ARM Program and the ARESE lOP
To investigate the interactions between solar radiation and the Earth's atmosphere, the United States Department of Energy (DOE) started the Atmospheric Radiation Mea-surement (ARM) Program. As dE)scribed in the ARM Program Plan (U. S. DOE 1990), the main objectives of this endeavor are to:
• describe the radiative flux profile of the clear and cloudy atmosphere,
• understand the processes determining the flux profile,
• parameterize the processes determining the flux profile for incorporation into general circulation models (GCMs).
Several Cloud and Radiation Testbed (CART) sites around the world were dedicated for observational research in support of the above objectives. These sites include the North Slope of Alaska (NSA), the Southern Great Plains (SGP) in northern Oklahoma, and the Tropical Western Pacific (TWP). Each CART site consists of a high concentration of instrumentation which provide data to the research community.
As a result of the recent intensification of the debate involving the role of clouds in absorption of solar radiation, the DOE organized an intensive observation period (lOP) to add understanding to the issue. This lOP, called the ARM Enhanced Shortwave Exper-iment (ARESE) was implemented in the fall of 1995 at the SGP field site. The primary objectives of the ARESE program! were to:
• directly measure the absorption of solar radiation by clear and cloudy atmospheres a,nd place uncertainty bounds on these measurements,
• investigate the possible causes of absorption in excess of model predictions.
Using instrumented platforms on the ground and on board aircraft and satellites, radiomet-ric flux data were obtained for a variety of atmospheradiomet-ric conditions between 25 September
and 1 November, 1995. In support of the radiometric measurements, cloud radar, lidar, and radiosondes provided more observations of cloud structure and atmospheric quantities to help accomplish the objectives mentioned above.
The procedure used to obtain radiometric measurements used to study atmospheric absorption involved aircraft colocation. To measure net :flux above and below cloud level as described in the previous section, two aircraft :flew in a "stacked" formation to obtain net flux information: the Twin Otter at an altitude near 3 km and the Egrett near 1;3 km. The two aircraft flew in patterns that would periodically result in a colocation between them and the ARM CART site to provide further information about the column flux profile.
For the present study, the measurements of greatest interest are the radiometric data obtained by the instruments on board the two aircraft. Both aircraft carried a set; of upward and downward looking RAMS radiometers to measure broadband solar flux. Thesp included the Total Solar Broadband Radiometer (TSBR) which measured total flux in the .:26 to 4.0 j,lTn range and the Fractional Solar Broadband Radiometer (FSBR) which
measured NIR flux in the .69 to 2.9 f..lm range. Subtracting the FSBR data from the TSBR data provides a measurement of VIS flux (.26 to .69 f..lm).
In addition to the RAMS radiometers, each aircraft carried upward and downward looking Total Direct Diffuse Radiometers (TDDR) which measure spectral :flux at seven wavelengths in the solar spectrum. These wavelengths are . .5, .862, 1.064, 1.2.5, 1..5, 1.65, and 1.7.5 f..lm. The RAMS and TDDR instruments were provided by Scripps Institution of Oceanography at the University of California, San Diego.
The Egrett also carried a radiometric instrument called the Scanning Spectral Po-larimeter (SSP) provided by Colorado State University. This instrument measured spectral flux at 40 wavelengths in the solar spectrum. The SSP was only mounted on the Egrett and was downward looking to measure upwelling or reflected spectral :flux and radiance. A graphical representation of the spectral ranges of the above instruments is shown in Fig. 1.3 overlayed on a plot of the incoming spectral flux at the top of the atmosphere.
2000 ! ~ 1500
z; ___
x 1000 ..J ;:: u (j) 0... (fl 500instrument spectral range
·~-I··T uT··T··--r-r i
'1
rSBR---~
FSBR --;~
-~
SSP (40 channels)~
x x~
x xx TDDR (7 channels)1
~
1
o __
~~~~..L! ~_"
!---===-
=-=-~~j
o 1 2 3 4 wavelength (fA-m)Figure 1.:3: Spectral ranges or measurement wavelengths of the TSBR, FSBR, SSP, and TDDR illstruments.
Spectral and broadband flux datasets produced by these instruments during the ARESE lOP as well as derived albedo and absorption observations will be analyzed and compared to model simulations in this study.
1.4 Scientific Objectives
The first objective of this study is the development of a Monte Carlo model that can simulate broadband and high resolution spectral fluxes over the shortwave solar spec-trum for heterogeneous atmospheres. In the past, Monte Carlo broadband simulations, though accurate, were limited in the spectral information they provide largely due to the computational burden required for these simulations. In this study, modifications to the Equivahmce Theorem as introduced by Irvine (1964) overcome most of these problems when run in concert with a Monte Carlo model. Using this method, any spectral reso-lution of gas, cloud, and surface absorption can be used in a simulation that covers the entire shortwave solar spectrum. This is a new application of this theorem and a major development in expanding the power and utility of the Monte Carlo technique for solv-ing radiative transfer problems in complex heterogeneous atmospheres. Because this new
method is theoretically exact, it is proposed that a model using the same theory be used to perform benchmark line by line calculations for complex cloud situations.
Once formulated for use in this study, the model will be used to provide insight into the effect of cloud heterogeneity on radiative fluxes, absorption, and albedo. The first experiment involves the effect of the spatial distribution of cuboidal clouds in the form of cloud fraction and compares the results with those obtained from the plane-parallel parameterization. The second experiment compares results from a cloud field that is in-ternally heterogeneous but unbroken against those from the plane-parallel approximation. Hence, the notion of cloud fraction no longer applies. This is performed to show errors that might be incurred by a general circulation model that only accounts for heterogeneity in terms of cloud fraction.
The model is then used to try and reproduce observed flux, albedo, and absorption observed during the ARESE lOP. Because cloud macrophysical and microphysical proper-ties were not recorded during the lOP, this exercise is not a direct simulation of the state of the radiative fluxes that were present during the field observations. 'Using knowledge gained from the cloud heterogeneity experiments listed above, this exercise does, on the other hand, act as a consistency check between observations above and below cloud level and between comparable instruments measuring the same quantities.
1.5 Plan Of This Research
This thesis begins with a summary of the history of absorption and albedo obser-vations which have both supported and refuted the existence of anomalous absorption.
In addition, the possible errors that may produce the discrepancy as studied by previous
researchers is discussed.
Next, the development of the Monte Carlo model and the theory behind the extension of this technique to high resolution spectral simulations necessary for this study will be presented. This begins with a review of applicable radiative transfer parameters and theory.
Finally, the model will be used in simple experiments to determine the effect of cloud heterogeneity on cloud, gas, and total atmospheric absorption. The broadband and spec-tral results will be compared to those obtained when the plane-parallel approximation is invoked. It is discovered that although cloud heterogeneity affects atmospheric absorp-tion in ways that are explainable in terms of photon path lengths and cloud amount, the amount of absorption change is not sufficient to explain the differences between theory and observation.
Using what is learned about the effect of cloud heterogeneity from these experiments, model simulations are performed and results are compared to selected ARESE observa-tions. It is shown that the most probable source of the absorption discrepancy between theory and observations made during this field experiment is instrument error, a result which has implications on results published by other researchers.
A HISTORY OF MODEL AND OBSERVATION DISCREPANCY
2.1 Introduction
Since the turn of the century, experiments and simulations have been performed to try and improve our knowledge and understanding of the mechanisms governing the re-flection, transmission, and absorption of radiation by the Earth's atmosphere. However, controversy has hindered this process. For over forty years, scientists have been unable to precisely define the atmosphere's role in the absorption of solar radiation. Theoret-ical model simulations have been performed using the most current knowledge of cloud microphysics and gas absorption characteristics, yet comparisons of those simulations to atmospheric observations do not reveal whether or not that knowledge is correct. Compar-isons made between theoretical and observed absorption have shown results ranging from good agreement to a gross underestimate of absorption by atmospheric models. The dis-agreement has been termed anomalous absorption. The discrepancy between theory and measurements is not limited to absorption. Many studies which only compare simulated and observed albedo also show disagreement. This, however is to be expected because albedo, like absorption, is calculated using the upwelling and downwelling fluxes at the top of the atmospheric column in question.
This chapter gives a brief synopsis of past work in this arena. First, studies which show anomalous absorption or albedo discrepancy and studies which show good agreement between simulations and observations will be reviewed. Second, past results showing the theoretical affect of aerosol, gas, and cloud particles on absorption and albedo will be discussed. Finally, the results of the 19% ARESE lOP will be presented.
2.2 Observations of Anomalous Absorption
Anomalous absorption has been observed to varying degrees in past research. Herman and Curry (1984) report fair agreement for the total solar and NIR portions of the spec-trum, but terrible agreement in the VIS portion where the model underestimates visible ahsorption. This result appears even though the modeled and observed reflectances and transmissions agree to within 10%. Of course, a systematic trend in a particular direction for each flux measurement can result in too much or too little absorption. This study spec-ulates that several uncertainties may have played a large role in the results. It states that cloud inhomogeneity including temporal and spatial variations can lead to errors. Also, it mentions a caveat related to the technique of net flux differencing above and below cloud level. There exists a substantial amount of observational uncertainty resulting from this method because absorption is computed as the residual of four large fluxes which nearly cancel. Thus, Herman and Curry conclude that it does not appear possible to measure a,bsorptances in regions of the spectrum where absorption is small due to the uncertainties resulting from cloud inhomogeneity.
Foot (1988) observe twice as much absorption in the cloudy atmosphere as is obtained in model simulations. Attempts to force the model to match the observations failed. The model simulations show a lack of absorption change due to a ±25% change in cloud optical depth and cloud particle effective radius
(1'
e). Also, the aerosol absorption coefficientobserved is one order of magnitude smaller than that required to model the observed absorption. It is stated that cloud top structure plays a role in decreasing the vertical radiance reflected off the cloud. Shadows due to cloud top structure are shown to bring model and observed radiances into agreement, however reflected hemispheric flux shows little change. Therefore, cloud albedo and absorption are not functions of cloud top structure.
A study performed by Twomey and Cocks (1982) compares observed cloud albe-dos to modeled ones and finds that neither the absolute nor relative magnitudes of the reflectances agree very well. The measured cloud droplet effective radius was 8 J.Lm. In
01'-der to force the model to match the observations, an effective radius of .. 5 ,.1,7)[, and droplet
density of 2 million drops per cm3 must be used. These are clearly non-physical values
considering typical cloud droplet densities range from 72 to 440 drops / cm3 (Stephens, 1979). A physical absorpt.ion is ruled out because t.he difference bet.ween the observed bulk absorption coefficient and that needed to bring t.he model into agreement. wit.h t.he observations is smallest in opt.ically deep regions of the cloud and largest in optically thin regions. If the enhanced absorption was related to clouds, this should work in the opposite direction. Twomey and Cocks note that lateral inhomogeneity evident. in the observations and not accounted for in t.he model may pose a problem. However, introducing cloud heterogeneit.y seemed to work in the wrong direction as well.
Stephens et al. (1978) show an increase in solar absorption beyond theoret.ical pre-diction and, unlike Twomey and Cocks (1982), it is correlated with an increase in cloud thickness and density. However, it. is noted that these measurement.s are wit.hin t.he ex-pected error of experiment.al uncertaint.y so the existence of anomalous absorption cannot be concluded.
Reynolds et. al. (1975) conclude cloudy sky absorption is 2-3 t.imes higher than t.hat for clear air. This is compared t.o results obtained by London (1957) and Drummond and Hickey (1971) to show that observed absorptions vary from 12 to ;36%. However, there is no mention of the disagreement. bet.ween the upper end of this observed range and model calculations.
In a study of vertical radiance reflected off a stratocumulus cloud deck, Stephens and Platt (1987) show good agreement. in t.he VIS portion of the spect.rum between observations and model, but an overestimate of radiance by the model in the NIR. It is speculated that t.his may indicate more absorption in the NIR t.han t.heory can predict.. This is contrary to the study by Herman and Curry (1984) which suggested the anomaly occurs in the VIS portion of the spectrum. The results of Stephens and Platt (1987) are shown in Fig. 2.1. As noted by Foot (1988), cloud top heterogeneity plays a role in lowering reflected radiance. However, it does not appear this process is occurring here because the model and observed VIS radiances seem to agree. It may be possible that heterogeneity has a
1.00.---,---.---.---r---.,,.----, Flight 01 -Theory - Observation ~.---.,---~----~---.---.--, .15 °400 Flight 03
AI_
- ' o n Cloud top 2347m Measured ( Eppley) 0.39 0-08 Calculated 0.43 0.05 -Theory - Observation Wavelength (nm)Figure 2.1: Comparison of the calculated (heavy curves) and measured (light curves) spectral refl(~ctances for two Sc cases. The comparisons are shown for cloud top and some level approximately in the middle of the cloud. Also included in the lower panel are the measured and theoretically derived broadband albedos and shortwave absorption estimates. (from Stephens and Platt, 1987)
Rpectra.J signature and is more pronounced in the NIR. The lower observed radiances in Fig. 2.1 seem to support the results of others which conclude anomalous absorption is a NIR phenomenon. Stephens and Platt discount the effects of the absence of large cloud droplets which may have been missed by microphysical observations. Included in the Fig. the measured and calculated solar albedo and absorption which also show discrepancy. This paper also notes that the angular distribution of reflected energy is more anisotropic for cumulus clouds than for stratiform clouds, a property which may be important and will be discussed later in this chapter in terms of instrument error.
IIignett (1987) compares measured and simulated marine stratus cloud albedo and finds that model simulations tended to overestimate albedo in the NIR and underestimate the albedo in the VIS. This is similar to the results obtained by Stephens and Platt (1987) discussed above. However, Hignett states that better agreement between model and obser-vations is possible if more computational effort is put forth. When the optical properties of cloud droplets are obtained from Mie theory instead of a parameterization scheme, better agreement is obtained for all cases even though the issue is still not completely resolved.
A study by King et al. (1990) also shows evidence of anomalous absorption. However, the observational techniques employed differ from those of previous studies. The proce-dure involves obtaining the angular distribution of radiance deep within a cloud where the direct solar beam has been completely attenuated and the remaining radiation is com-pletely diffuse. Here, absorption properties can be inferred from the radiance information by way of a technique called the diffusion domain method (King, 1981). Fig. 2.2 shows their results for a flight through a stratocumulus cloud off the California coast. Plotted are the observed and simulated similarity parameter
(8)
as a function of wavelength. The similarity parameter is related to cloud absorption through the single scattering albedo. Absorption is zero for s=
0 and increases with increasing s. As seen in the plot, themea-sured values (dots) indicate a consistently larger absorption than theory predicts (dashed line). The authors note that this is the result of only one case study, but based on the bias conclude that this is evidence for anomalous absorption.
'iVithin the past several years, several studies have been published which unambigu-ously claim anomalous absorption is real and systematically measurable. Cess et al. (1995) compare model and observed absorptance for several locations around the globe using a surface pyranometer colocated with satellite observations of outgoing flux at the top of the atmosphere. Two indicators of absorption are used in this study. First, the ratio (is) of surface to TOA cloud radiative forcing (CRF) is computed from measured and simulated results for two regions: one surrounding the National Oceanic and Atmospheric Admin-istration (NOAA) Boulder Atmospheric Observatory (BAO) tower in Colorado, and the other located in the tropical western Pacific. The model atmospheres used in the study
1.0 0.0
CALCULATIONS FOR 10 JULY 1987
0.9 --DROPLETS 9:31 - 9:41 PDT - - - DROPLETS + VAPOR 0.8 ! MEASUREMENTS '" FROM CAR
~\
CJ)z
a: 0.7 C) w 1\ I - 0.9 r w I \ m ::i: 0.6 I I CJ) <C n a: I \ » <C ~ a.. 0.5 I ~, m>-~
i :
::D !:: Z a: 0.4~
C) <C I I I ....I » 3E , ·1 r \ I ,.... tD iii 0.3 m I, " I 0 I, " I 0.99 0 0.2 I, I \ I e '"~
\~.
J,
I I I 0.1 I~
" \ ' ' . r 0.999tij
f" ·
I 0.9999 0.0 1.0000 0.2 0.5 1.0 1.5 2.0 2.5 WAVELENGTH (101m)Figure 2.2: Calculations of the similarity parameter as a function of wavelength for water droplets alone (solid line) and drops plus vapor (dashed line) for a cloud droplet size distribution and water vapor conditions of the marine stratocumulus cloud of 10 July 1987. The single scattering albedo scale is valid at 0.7.54 {lm, where the cloud asymmetry factor 9
=
0.848. The measurements derived from the cloud absorption radiometer (solid circles with error bars) are averages of the similarity parameter derived by applying the diffusion domain method to a SO km section of the cloud. (from King et al., 1987)1.0
I
0Eli 0.8I
I 0.6-I
I
0.4 ~ 0.2 0.0 c: ~~E
IDa!ern
<
0I
i 0[!]I
i
I [!]i I G 08 I 0I
0I
III
ItI
I.
I • ObservedI
i
I 8 CCM2o
ECMWF.
! ! LocationFigure 2.:~: Comparison of values of /3 (determined from the ECMWF GCM and CCM2) with the observed values. The vertical bars denote the 95% confidence intervals of the observations. (from Cess et al., 1995)
produced
is
near 1..5 whereas model simulations produceis
closer to l.0. Second, the derivative of TOA albedo with respect to the cloud forcing ratio {3 was computed for five locations around the globe. Similarly, the theoretical {i calculated is around .8 as seen in Fig. 2.3, yet the observations at each location are clustered around .6. Both of these results are interpreted as the underestimation of atmospheric absorption by the model. The authors discount the effects of aerosol and note that increased water vapor associated with increased cloudiness is not the cause of the measured anomalous absorption. Error associated with the surface measurements was discussed and was limited to the typical mrors associated with commercial pyranometers. This error is within the linearity of the pyranometers (±0.5%). The measured absorption is significant and would reduce the globally averaged surface insolation by 25 VV/ m2.Atmospheric absorption measurements were made by Pilewski and Valero (1995) in the tropics during the Tropical Ocean Global Atmosphere - Couple Ocean Atmosphere Response Experiment (TOGA-COARE). Here, 20 flights were made above and below cloud layers with identical instrumentation to record net fluxes. The results presented are consistent with Cess et al. (1995), however the magnitude of the derived cloud forcings
were different. Pilewski and Valero did make an attempt to lessen the effects of cloud inhomogeneity by filtering the data. This did result in a reduced "cluster of lower albedo cases" but it is unclear whether or not this can be interpreted as the effect of cloud inhomogeneity on absorption. They conclude that the absorption characteristicR are water-like and that there is still a need to investigate its spectral characteristics, especially in the NTR.
ObRervations of anomalous absorption are not only linked to cloud effects. In a paper by Arking (1996), surface flux measurements from the Global Energy Balance Archive (GEBA) and satellite flux observations from the Earth Radiation Budget Experiment (ERBE) were used to calculate globally averaged atmospheric absorption for comparison with model results. It is concluded that the model underestimates the magnitude of atmo-spheric absorption by 2.5 to 30 W/m2. However, this increased absorption is attributed to clear sky effects rather than cloud effects. No correlation between atmospheric absorption and cloud amount is seen, whereas a correlation does exists with water vapor amount. These results are contrary to those quoted by Cess et al. (1995).
2.3 Observations of No Anomalous Absorption
Several studies have presented results of comparisons between observations and model simulations which did not result in any evidence of anomalous absorption. In an experi-ment performed over the Arabian Sea in 1979, Ackerman and Cox (1981) measured col-umn absorptance between stacked aircraft in a stratocumulus cloud field. Actually, the raw measurements show considerable absorption in both the NIR and VIS regions of the solar spectrum. However, because cloud absorption in the visible region is negligible, the apparent absorption measured is assumed to be a measure of the leakage of radiation out the sides of the clouds that the pyranometers cannot see. By subtracting this apparent absorption from the NIR measurement, the observations and model predictions agree very well. This correction method brought the observed absorption for the total broadband down to 9.3
%
from 17.8%.
This technique also decreased the averaging distance necessary from 24 to ;~ km to allow the measured net fluxes to converge.Slingo et al. (1982) present results from the .Joint Air-Sea Interaction (JASIN) ex-periment which show no evidence of anomalous absorption. This conclusion is made even though they recognize the difficulty in making absorption observations. Two models are used for comparison with the measurements. Even though the models disagree on the amount of absorption by 15
%,
both simulated results fall within the error of the mea-surements. Observed absorptance was 52±
20 W/m2.By employing the correction method described by Ackerman and Cox (1982), Rawlins (1989) measured absorptances over a 1..5 km flight track in the presence of cloud at 8 to 12 ±4
%.
In clear air, the values are 2 to 4 ±2%.
Because the measured cloudy sky absorptions are similar to measurements made by others who saw no evidence of anomalous absorption, the conclusion is made that excess absorption is not seen here either. However, these values are only compared to clear sky model simulations in this study.Hasayaka et al. (1995), using the Ackerman and Cox (1981) correction method, also report no evidence of anomalous absorption. Using this method, fluxes measured from broken cloud fields are corrected and the resulting absorptances ma,tch thcoretica1 predic-tions made using the plane-parallel approximation. Hasayaka et al. note the importance of water vapor and cloud LWC to atmospheric absorption and state that the cloud droplet size distribution is not as important.
Like the study performed by Cess et al. (1995), Li and Moreau (1996) obtain global values for the ratio of surface to TOA cloud forcing (is). Data used for the research consists of four years of ERBE satellite flux measurements and GEBA surface flux measurements similar to the dataset used by Arking (1996). This study performs an extensive sensitivity analysis for