MASTER
THESIS
Master's Programme in Mechanical Engineering, 60 credits
Foam Behavior Analysis Based On A Force
Measurement System
Abay Damte, Qikang He
Thesis in Mechanical Engineering, 15 credits
PREFACE
This Master‟s Thesis has been carried out during our period in „The Rydberg Laboratory for Applied Sciences‟ at the Halmstad University in Sweden.
The project was possible thanks to the help and supervision of our supervisor, Sabina Rebeggiani. We appreciate the fact that she is present any time we seek for her input and willing to answer all our questions. She gave us useful pointers on how to be systematical and carry out a plan for the experiment, which was very helpful.
ABSTRACT
In the world where every sector of industrial manufacturing is being converted to automated systems, surface finishing processes like sanding and polishing seem to lag. This phenomenon is not surprising as these processes are complex to optimize. There have been projects going on with the support of European Commission to find solutions under SYMPLEXITY (Symbiotic Human-Robot Solutions for Complex Surface Finishing Operations). One of the projects in under this include poliMATIC (Automated Polishing for the European Tooling Industry). Halmstad University is involved in doing projects.
This project took a portion of this study in aim to understand a foam material‟s behavior used for sanding tool at the tip of a robotic arm. This is studied using a force measurement system developed at Halmstad University. The project has two sections and starts with one; Understanding the force measurement system and upgrading in necessary ways. Two; studying how the foam material compressive hardness property is affected when the material is fit with sandpaper for sanding operation using the force measurement system. The study finally revealed how the combination of the foam with sandpaper affects the robustness of the material, and significantly improved the output of the system with by reducing the noise level with 40%.
CONTENTS
PREFACE ... i ABSTRACT ... ii CONTENTS ... iii 1 INTRODUCTION ... 1 1.1 Background ... 11.2 Aim of the study ... 1
1.3 Problem definition ... 1
1.4 Limitations ... 1
1.5 Individual responsibility and efforts during the project ... 2
1.6 Study environment ... 2
2 METHOD ... 3
2.1 Alternative methods ... 3
2.2 Chosen methodology for this project ... 3
3 THEORY ... 7
3.1 Force Measurement System ... 7
3.2 Introducing noise ... 12
3.2 Standards ... 13
3.3 Foam ... 16
4 RESULTS ... 18
4.1 System improvement ... 18
4.2 Foam analysis based on models ... 19
4.3 Discussion ... 22
5 CONCLUSIONS ... 25
5.1 Conclusions ... 25
5.2 Recommendation to future activities ... 25
6 CRITICAL REVIEW ... 27
Figures ... 28
Reference ... 29
Appendix ... 31
Appendix A Accuracy and precision ... 31
1 INTRODUCTION
1.1 Background
There are many companies who are interested in how to improve the sanding process on car surface treatments, for example, one goal is to extend the lifespan of the sandpaper so that the company can cut the cost and increase profit. However, it is not an easy task since many aspects will influence it, such as working temperature, type of polishing tools and coating material…
For this study, the polishing tool consists of three parts: support, foam and sandpaper. Since the tool will be used in a CNC-machine application, all the parts of the tool should be clearly defined. Even if the characteristics of each individual component of this sanding tool are given by the manufacturers, the function of the complete tool, i.e a composite, is still unknown. Therefore, the most important part, the foam, which plays the main role in the sanding process, has been studied in detail in this work. For this purpose, a Force Measuring System was developed. [1] This Measuring System is explained in chapter 3.
1.2 Aim of the study
The aim of this study is divided in two parts; 1. To improve the system, e.g. by shielding of cables to reduce electrical noise, and adding a stress-strain diagram output option to the system, 2. To compare the standardized VLRH to the force measurement system. Further, data collected by the system should be compared to the manufacturer‟s data in order to study the relations between these measured values with how they could affect the sanding process parameters.
1.3 Problem definition
Manufactures of foams specify the necessary mechanical properties for their products. For specific applications, like robotic sanding systems, properties of a combined material of foam and sand paper should be useful. Therefore, the purpose of this research is to find a parameter that could possibly define how a combined tool material behaves.
1.4 Limitations
This project focuses on improving the Force Measurement System, which has already been developed by previous students and to study foam behavior. Since the system has already been assembled and programmed, it was necessary and important to understand the whole structure before taking actions to update the system. Also, the foams to be measured have been specified and there is a data sheet from the company for comparison.
1.5 Individual responsibility and efforts during the project
It is fair to say that whole task of the study is evenly shared, for example we have done all the experiments together; Abay Damte did most practical work, and Qikang He recorded the data and took notes.
1.6 Study environment
The study was done on the premises of Halmstad University. The experimental setup was done in two mechanical labs, namely Rydberg measurement laboratory and Fab Lab. The measurement experiment of the foams was conducted in the Rydberg measurement laboratory, and we utilized equipment from Fab Lab to cut the foam samples to appropriate size.
2
METHOD
2.1 Alternativemethods
The methods chosen for this work were confined to exsisting resources. This implies to studying the behaviour of foams with the measurement system developed here at campus.
An alternative method would start by splitting the study into two. This way the force measuring system improvement would solely be focused towards a VLRH scale. And different approaches can be considered regarding measuring and comparing foam and combined foam material behaviour.
One ideal method is to consider using measuring device for flexible cellular polymeric materials that comply with DIN EN ISO 3386-2 standard. This way of studying the behaviour of foams could be managed with the same methodology of DoE and comparing results and understanding how it affects the sanding process.
2.2 Chosen methodology for this project
In this research, a quantitative method has been chosen and result and conclusions are based on the foam density, depth of penetration, and compression reaction force or pressure. The experimental setup for this work will be presented in section 3 Theory.
2.2.1Preparations and data collection
As the aim of the project solely depends on the force measurement system developed here in the research lab, the measured values are gathered from this. These values include a cross value of force sensor voltage output in mV/V to time period of the application. And this data is converted to force and depth of penetration. Both these outputs are displayed on the GUI made with MATLAB. The readings from these outputs will be our results while putting the foams to tests.
The foams under study are similar foams from the same manufacturer that are going to be used in another sanding process study here in campus. The reason for this is the results of the behaviour of the foams are aimed to aid the further study in sanding process already in action here.
Measurements are then taken on foams with different foam density and thickness. These values are then compared with the manufacturer data. Further measurements of combined foam with sand paper are taken as well.
2.2.2 Design of experiment (DOE)
changes in process elements and observations of their effects. In other words, it is used to find causal relationships. Statistical analysis of these results was used to determine the relationship between process variations to optimize production. The most commonly used terms in DOE methods include: hypothesis tests, blocking, replication and interactions.
•Controllable input factors, or x factors, are those input parameters that can be modified in an experiment or process. For example, when cooking rice, these factors include the quantity and quality of the rice and the quantity of water used for boiling.
•Uncontrollable input factors are those parameters that cannot be changed. In the rice-cooking example, this may be the temperature in the kitchen. These factors need to be recognized to understand how they may affect the response.
•Responses, or output measures, are the elements of the process outcome that gage the desired effect. In the cooking example, the taste and texture of the rice are the responses. [2]
Figure 2-1 : process factors and responses
2.2.3 Data analyze
The data collected through the experiment is the relationship between force and depth of indentation, while the company data sheet provides the relationship between pressure and depth of indentation. Therefore, the test data must be converted into corresponding values for comparison. To convert force into pressure, you need to know what the contact area is, according to the article Spherical indentation of elastic-plastic solids [3] and Material characterization by indentation [4], the equation determined to simplify the contact area between the indenter and the material to the area of the largest circle of the probe.
In addition, the data should be collected after the foam and sandpaper was put together, which is expected to be the characteristics need to better understand
sanding processes. 2.2.4 Regression analysis
Statistical modeling, when focusing on the relationship between the dependent variable and one or more independent variables (or "predictors"), contains many techniques for modeling and analyzing multiple variables. More specifically, regression analysis helps to understand how the typical value of the dependent variable (or “standard variable”) changes when any one of the independent variables changes, while other independent variables remain fixed. [5]
In general, regression analysis estimates the conditional expectation of the dependent variable for a given independent variable - that is, the average of the dependent variable when the independent variable is fixed. Less common is that the emphasis is on the quintile or other positional parameters of the conditional distribution of the dependent variable for a given independent variable. In all cases, a function called an independent variable of the regression function is to be estimated. In regression analysis, it also make sense to use a probability distribution to characterize the change in the dependent variable around the predictive regression function. A related but different method is the necessary conditional analysis [6], which estimates the maximum (rather than mean) value of the dependent variable for a given value of the independent variable (ceiling line rather than the center line) in order to identify the independent variable. The value is necessary but insufficient for the given value of the dependent variable. Regression analysis is widely used for forecasting, and its use has significant overlap with machine learning. Regression analysis is also used to understand which independent variable is related to the dependent variable and explore the form of these relationships. In limited circumstances, regression analysis can be used to infer causal relationships between independent variables and dependent variables. However, this may lead to illusions or wrong relationships, so caution is desirable; for example, correlation cannot prove causation.
Also, R-squared value is an indicator of the degree of fit of the trend line. Its magnitude can reflect the degree of fit between the estimated value of the trend line and the corresponding actual data. This means the higher the degree of fit, the higher the reliability of the trend line.
2.2.5 Accuracy and Precision
The experimental error is the difference between the measured value and the true value or between the two measured values. The experimental error itself is measured by its accuracy and precision. Accuracy measures the closeness of a measured value to a true or acceptable value. Since the actual or acceptable value of the physical quantity may not be known, it is sometimes impossible to determine
the accuracy of the measurement. Precision measures the degree of agreement of two or more measurements with other measurements. Precision is sometimes referred to as "repeatability" or "reproducibility." Highly repeatable measurements tend to give very close values.
The figure2.2 defines accuracy and precision by analogy to the grouping of arrows in a target.
3
THEORY
3.1 Force Measurement System
The force measurement system was developed by previous students. [8] Figure 3.1 shows the composition of the entire system, which is divided into three parts, all described below.
Figure 3.1: the composition of the entire system [8]
Mechanical setup
The mechanical setup can be seen in Figure 3.2 and consists of:
• Granite table with an arch in granite, screwed together
• Axis „SHT-12-AWM-PL‟ made by IGUS [9]
• Stepper motor „ES-M32320‟ from the company Leadshine [10]
• Adapter plate for the connection between the arch and the axis
Figure 3.2: Granit table with axis and motor, 473 mm x 630 mm x 520 mm (h x w x d) done by Hugo Bonnet
Figure 3.3 shows a sketch of the mechanical parts of force measurement system. [8]
The Mechanical parameters
•Measuring specimen height up to 800mm •Get a measured force reading of every ten
thousand of a millimeter.
•Equipped with S-shaped S2M Load cell
•Output signal 2mV/V
•HBM accuracy class 0.02
•Nominal rated force up to 100N.
Figure3.3: Sketched force measurement setup by Lea Kraft [8]
The whole system is controlled by the
software MATLAB, which was
programmed by Viktor Fres, one of the previous students working with the system. The main buttons are Calibration and Measurement; one is used to adjust the sensor into zero point, for instance the axis will be moved in the direction of the starting point by the motor; the other is used to get the data between the relationship of how deep it goes into the foam and the force will be. It is also possible to adjust the speed of the motor and how far the axis shall move.
Figure3.4: CAD drawing of the sensor part by Viktor Fres [1]
Electronic setup
Figure 3.5: Electronical elements built up by Lea Kraft [8]
Power supplyThe force measurement setup is given by four different supplies.
5V are supplied for the NI9474 module, 12V for the cDAQ-9174, 24V for the limit switch and 48V for the easy servo drive. All of them are from company Omron. [11]
Residual current breaker with overcurrent protectionBy considering the
system safeness, a residual current circuit breaker with over-current protection manufactured by Siemens was installed to prevent short-circuit and overload conditions. [12]
Servo drive
The easy servo drive ES-D508 is connected to the module NI 9474 and commands the motor. In addition, with the according software called „Leadshine ProTuner‟, options for motor settings like micro step resolution, error limit and encoder resolution can be set.
There are four ports [13]: • Communication port (RJ11)
• Control Signal Connector, eight pins, two pins each provide o Pulse signal
o Direction signal o Enable signal o Fault signal
• Encoder feedback connector • Power and motor connector
Data acquisition modules
For the data acquisitions, there are two modules (NI 9474 and NI 9237) are installed in the cDAQ-9174 chassis which has 4 slots. The chassis is connected with an USB cable to the computer and allows configuration of all devices by software (e.g. MATLAB or LabVIEW) [14].
NI 9474 is a digital output module with 8 pins for CompactDAQ system. Three cables serve to control the motor and connected with the easy servo drive ES-D508 (pulse, direction, enable). This module is the first slot of the cDAQ-9174 chassis [15]
NI 9237 is a 4 analogue input channels simultaneous bridge module and is connected with RJ50 to the force sensor. It supplies the sensor and measures bridge-based sensor. This module is in the fourth slot of the cDAQ-9174 chassis [16]
All in all, NI CompactDAQ is a portable, rugged DAQ platform that integrates connectivity and signal conditioning into modular I/O for directly interfacing to any sensor or signal. From in-vehicle data logging to benchtop research, the breadth of bus, chassis, controller, and I/O conditioning options combined with the customizable nature of LabVIEW software provide the best solution to meet the needs of any medium-channel-count application.
Software
MATLAB was used to build up the user interface shown in figure 3.6. It integrates many powerful functions such as numerical analysis, matrix calculations, visualization of scientific data, and modeling and simulation of nonlinear dynamic systems into an easy-to-use window environment for scientific research, engineering design. The field provides a comprehensive solution in many science fields, which need to be efficiently numerically calculated. Furthermore, MATLAB has an extensive library of pre-assembled toolbox, which can be used to execute the motor, force sensor and limit switch. [17] [18]
In order to communicate with National Instruments hardware, the Toolbox 'Data Acquisition Toolkit Support Package' for NI-DAQmx devices was installed. MATLAB utilizes this toolbox to acquire and generate data.
After taking a measurement of the foam, a force-depth graph is given. To analyze the data in the graph it should be saved in Excel given different smoothing ranges. Figure 3.6 shows an example of such a graph; the experiment data are from the 12mm Vibration 190Plus foam; the function of buttons and the meaning of graph
is explained below.
Figure3.6: One experiment on 12mm Vibration 190Plus & user’s interface
(1) The left live screen shows the measured voltage difference [mV / V] per unit of time[s].
(2) On the right live screen, the force-depth measurement data are displayed in millimeters per penetration depth. The blue line is the force reading when the indenter presses into the foam, and the red line is the force reading as the indenter reaches the desired position and depresses.
(3) Here are the buttons for calibration and to start the measurement
(4) There is a "smoothing range" to smooth the curves and a button for saving Data in Excel
(5) Here are axis buttons for Parameter selection and moving.
(6) This is the display for the current position and processing status of the device.
Explanation of the measurement
In order to obtain reliable data, a calibration work is first required. Calibrating the system will actuate the motor to move the sensor up to the reference point. This way the software will learn the sensor‟s position. After calibration, any movement of the sensor will be noted in the software in accordance to the reference point.
After calibration, the sensor shall be moved down to the test specimen (material to be measured) before the measurement starts. The up and down buttons are shown in Figure3.6 control the movement of the sensor to go in the required direction. This
movement is also guided by the inputs fed in speed and distance feed in boxes shown by number 5 in the same figure.
For stable movement of the system the maximum speed is set to 2 millimeters per second (mm/sec). The distance can be set up to a maximum of 10millimeters at a time in either direction from its current position. Using these guidelines as a rule, the sensor is moved down until the indenter has touched the surface of the material to be measured. Before starting the measurement, the measurement speed and how much depth we desire to go down inside the foam are set in the distance and speed boxes again. The system is now ready to start the measurement.
3.2 Introducing noise
Noise refers to random fluctuations in the output signal when the measured value is unchanged. [19] The reason may be inside or outside the sensor. Mechanical vibration, electromagnetic signals (such as electromagnetic waves of radio waves and power supplies) and ambient temperature are examples of external noise. Internal noise is very different and may include:
1. Electronic noise, caused by a random change in current or voltage. These changes are due to thermal energy, which leads to random movement of charge carriers. This is unavoidable and exists in all electronic circuits.
2. Shot noise, manifested as random fluctuations in the measurement signal, caused by the random arrival time of the signal carrier. These signal carriers can be electrons, holes, photons, etc.
3. Generate recombination noise or g-r noise, which is caused by the generation and recombination of electrons and holes in a semiconductor.
4. Pink noise, also known as 1/f noise, is associated with the spectrum of the signal and has equal power per octave. The noise component of the spectrum is inversely proportional to the frequency. Pink noise is associated with self-organizing, bottom-up systems that occur in many physics (such as weather: thunderstorms, earthquakes), biology (statistical distribution of DNA sequences, heartbeat rhythms), and economic systems (stock markets). [20] Noise is a form of electromagnetic energy picked up by the emitting conductor. The noise is usually at a very high frequency (transmission signal) or low supply voltage.
For sensors with amplifiers, noise may propagate along the cable, causing regulator to malfunction. Standard methods to reduce noise include:
Ground shielding of cables
Avoiding ground loops
Using conduit to shield signal leads
Moving wires away from sources of interference
Avoiding sensors with zero-volt output
Figure 3.7: Sensor cables [19]
Coming to the force measurement system, how much noise the system is inspected by taking an idle measurement (taking a reading while there is no material i.e. measuring while the sensor is in the air). This reading is shown in Figure 3.7 and clearly depicts the noise range of varying force from +0.4N to -0.4N.
Figure3. 8: Noise range [1]
It is apparent for the noise to influence the test result of the foam sample measurements to be taken.
Very low robber hardness test (VLRH)
The German company Bareiss Prüfgerätebau GmbH developed the VLRH. In 2009 it became a Standard, DIN ISO 27588 (Rubber, vulcanized or thermoplastic –Determination of dead-load hardness using the very low rubber hardness (VLRH) scale). [21]
The hardness test refers to the different depths of indentation caused by steel balls on the silicone rubber vulcanization under low contact force and high total external force. The low contact force is 8.3mN and acts for 5s, while the total external force is 100mN and remains for 30 s. From these different indentation depths, the hardness is expressed by the degree of "very low rubber hardness (VLRH)" and the total external force can be obtained. [21]
Figure3.9: Hardness testing device for the VLRH method [21]
Figure3.10: Force-time-pattern of (right: measuring head) the VLRH test method [21]
Between VLRH and the depth of penetration, a linear relationship is laid down as follows:
, (3-1) Where, D is the depth of penetration in m.
Figure3.11: Relationship between hardness VLRH and depth of penetration [21]
Shore hardness
Shore hardness corresponds to the Shore hardness tester, and is divided into three categories: A type, C type and D type. The measurement principle is exactly the same. The difference is that the size of the stylus, especially the diameter of the tip, is different. The C type is the largest and the D type is the smallest.
Type A; is suitable for general rubber, synthetic rubber, soft rubber, grease, leather, wax, etc.
Type C; is suitable for use in rubber and plastics, micro porous
Materials made from foaming agent in plastics
Figure3.12: Shore A Durometer
Type D; is suitable for general hard rubber, resin, acrylic, glass, thermoplastic rubber, printing plate, fiber and so on.
Insert the test material with Shore hardness tester. The pointer on the dial is connected with a needle through the spring, and the needle is inserted into the surface of the measured object. The value displayed on the dial is the hardness value.
VLRH vs. Shore hardness
Elastomers have different standardized indentation hardness test procedures. Especially for silicones, there are two main methods used, Shore A (DIN 53505) and Shore OO (ASTM D 2240), which are hardness (shore) test procedures [22]. However, in order to measure super soft silicones, the hardness difference between the two methods is insufficient.
In order to investigate the relationship between VLRH and the commonly used silicone rubber hardness test of the Shore A and Shore 00 methods, the VLRH, Shore A, and Shore 00 hardness of 30 silicone rubbers were measured separately for each sample. 10 times, based on this, calculate its regression function. It shows
a better differentiation of the VLRH measuring results.
Figure3.13: The connections between the hardness scale VLRH and shore A, shore OO [21]
From the picture, it means that Shore A and Shore OO cannot distinguish the lower hardness of the softer silicone. Contrary to this shortage of hardness, VLRH is more suitable for measuring the hardness of softer materials. Also, the advantage of VLRH is that compared to the hardness values of the existing Shore A and Shore 00 measurement methods, the hardness of soft silicone rubber specimens is expanded, and the hardness of the rubber can be better differentiated.
3.3 Foam
Polymer foams are made by the controlled expansion and solidification of a blowing agent liquid or a melting tank; physical, chemical, or mechanical blowing agents are possible. The resulting cytoplasmic material has a lower density, stiffness, and strength than the parent material, depending on its relative density. It can be divided by two types: Flexible Polymer foam (Density from 16-115 kg/m3) and Rigid Polymer foam (Density 36-470kg/m^3) [23]
The foam for the test are from the company BSW (Berleburger Schaumstoffwerk GmbH), they are called Regufoam. It was developed as high-quality mixed-foam polyurethane foam for vibration damping and structural noise decoupling; besides it is made in a variety of densities with precisely defined physical properties. Also, Regufoam is suitable for foundation separation, protecting buildings from vibrations near rail systems, vibration isolation in railway buildings, and passive and active isolation of facility engineering equipment and machinery.
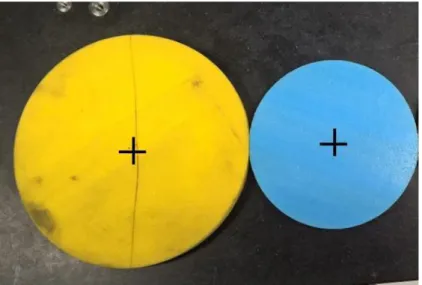
Figure3.14: Test foam samples
The main advantage of Regufoam is its excellent long-term elasticity even under many ton loads, as well as precisely defined load ranges, and it can be used for highly specific applications in complex construction situations. Its versatility and rated load far exceed the insulation properties of other materials. [24]
Table 1 shows the basic Mechanical properties test foams.
Official Name Regufoam® vibration
190 plus
Regufoam® vibration 270 plus
Color yellow blue
Thickness [mm] 12&25 12&25
Dynamic modulus of elasticity [N/mm2] (Depending on frequency, load and thickness, see
figure “dynamic stiffness”) 0.25-0.55 0.60-1.05 Compression hardness [kPa] (Compressive stress at 25 % de-formation test specimen h = 25 mm) 22 63
Permanent static load (N/ mm² h=25mm)
0.018 0.042
4
RESULTS
4.1 System improvement
4.1.1 Noise reduction
After getting an understanding of how the system was built up, the work is to improve it started in order to get the desirable noise-free (acceptable noise) result. First solution was to shield the cables; both cable from the sensor and AD converter manufacturer came with a shielding option. It could also be noticed that the shielding cover was not grounded, which was important for the shielding to work.
The second step was to check electronic parts‟ qualities. To do this support and critical comments where improvised from staff of electrical department within the campus. One critical comment is that the NI CompactDAQ system quality is low and is of different manufacturer compared to the sensor, which makes it possible for the two devices not syncing well. However, this change was not done due to the expense to by new parts.
Figure 4.1 shows the results before and after step one, i.e. after the cable was grounded. Previously, the noise ranged from -0.4 N to 0.4 N, which is not precise enough for the experiment, after the noise range decreased to -0.1N to 0.1N.
Also, as the measurement being taken in the experiment, measuring with low speed gives a smoother graph, i.e. a graph with less disturbance or noise. Figure 4.2 shows an experiment done with 1, 0.5 and 0.1 all in mm/sec speed.
4.1.2 Data collection improvement
After the measurement has been taken, a suitable regression line that can describe the result data has been selected out of three models of regression lines. The regression line will define the data into an exponential, linear or polynomial way for the given set of boundary.
Figure4.2: Different regression model
As figure 4.2 shows, the polynomial representation for the measured data fit better than the exponential and linear regression lines. This can also be seen from the coefficient of determination or R-square.
Having a regression graph will make it easier and suitable to compare the experiment data with the data provided by the foam manufacturer (BSW).
4.2 Foam analysis based on models
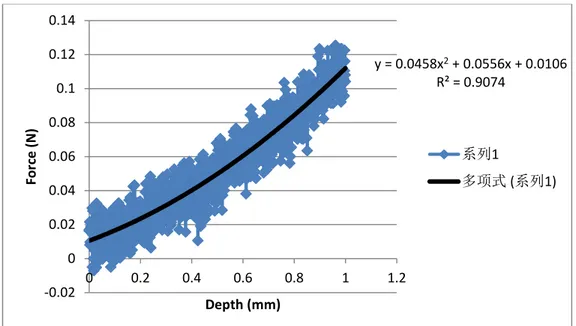
Measuring a 12mm thickness V190plus foam sample for 1mm depth at 0.1mm/sec speed a force depth graph has been obtained.
Sequentially following the graph a regression line that best fits the graph is generated using a polynomial trend line in Excel. The regression line‟s graph has the following formula that can describe the relation as shown is the Figure4.3; (others can be seen in Appendix E)
Figure 4.3 Force-depth regression model of 12mm test foam
y = 0,0458x2 + 0,0556x + 0, 0106 (4.1) Where, Y represents the force and x represents the depth. The pressure-depth relation is generated from equation 4.1
Area of the pressing indenter tip is [26];
A=1/4*π*D2 (4.2)
Where D is the radius of the indenter tip, which is 2.5mm, hence the area is 4.91mm2.
Figure4.4: Sketch shows the indenter of the company Bareiss [27]
Used Pressure is Force per unit Area as a starting point and substituting the Force with equation 4.1 and Area with the result found (4,91mm2) give the Pressure (Y‟) via the equation as;
Y – Force, A – Area and Y’ – Pressure
y = 0,0458x2 + 0,0556x + 0,0106 (4.1) y = 0.0458x2 + 0.0556x + 0.0106 R² = 0.9074 -0.02 0 0.02 0.04 0.06 0.08 0.1 0.12 0.14 0 0.2 0.4 0.6 0.8 1 1.2 For ce (N) Depth (mm) 系列1 多项式 (系列1)
A = 4,91mm2 Y’ = Y/A =0,00933x2
+0,01132x+0,00216 (4.3)
This represents the pressure-depth relation and is further plotted as shown in figure 4.4 below to compare with the manufacturers data.
Figure4.5: pressure-depth regression model of test foam
4.2.2 12mm foam with and without sandpaper
Here the result of measuring V190plus foam is plotted in comparison to combined V190plus foam with sandpaper in Figure4.6, and V270plus in comparison to combination of V270plus and sandpaper in figure4.7. The comparison is hoped to figure out how the foam behavior will change to pressure when combined with sandpaper, and so how might affect the sanding procedure.
The measurements taken over the combined samples were limited to values read at 1mm depth. Readings made beyond this depth were discarded as the sandpaper attached on the foam was detaching. This lead our data limited to the readings mentioned. -0.0050 0.0000 0.0050 0.0100 0.0150 0.0200 0.0250 0 0.2 0.4 0.6 0.8 1 1.2 Pr e ssur e ( N /m m 2) Depth (mm) 12mm V190P
Figure4.6: V190P foam VS V190P foam with sandpaper
Figure4.7: V270P foam VS V270P foam with sandpaper 4.3 Discussion
System Improvement
Improving the force measurement system was focused on decreasing the electromechanical interference (noise) in the output data. Initially we had a total
range of 0,8N noise in the output force reading, which was then decreased to a range of 0.2N. i.e. a total of 75% reduction in noise. This accomplished by shielding of the cable, but further majors like changing the sensor and its supporting electrical parts could very likely decrease the noise down to less than 1mN. And this could be further reduced if noise filtering software is applied. Towards VLRH
The intention of developing a VLRH force measurement system seems to have several problems.
In order to have a VLRH system there are certain things you need to achieve hardware wise, which include:
1) The force sensor should be able to measure forces down to 8.3mN and for that an ideal force sensor in the market would be the LNP® nano touch with a rated measuring value 0.6mN to 1.4N. [28] 2) The noise should be further decreased to a maximum rated noise at
0.2mN in order to pass the DIN ISO 27588 standard for VLRH systems.
3) Currently, the force measurement system is taking an input of indentation depth and will give an output of force reading in Newton. For VLRH, the system should be able to put in a contact force of 8.3mN and an increased force until it reaches 100mN. Then after a reading of the depth of penetration, the VLRH scale can be used to read out the hardness of the foam.
This concluded the physical improvement as it required further budget in the project to further achieve a more definite force measurement system.
Foam
Measurements were conducted in different variations of conditions on foam density and thickness, pressing the indenter inside to different depth, and in different points throughout the surface area of the foam. (Appendix A)
For variation of thickness and density the foams reacted accordingly; higher density higher reaction force, higher thickness lower reaction force. This was expected as the compressive hardness test data based on DIN EN ISO 3386-2 provided by the foam manufacturer.
Force measurements taken in 1mm, 1.5mm, 3mm and 5mm depth showed a slight difference while generating an overall regression graph and formula. The formulas generated to define how the foam reacts while the indenter presses had a variation of max 0.009N. This leads to claiming a reasonable formula to define the relation between the penetration depth mentioned and the reaction force achieved.
Foam VS manufacturer data
shows how different thickness of the V190Plus material reacts to compressive forces. As seen in figure 4.8 the optimum load range for this material will lay until the foam is pressured down to 1mm. Figure4.5 shows the reaction of similar foam recorded by our measurement system. The foam reaction seems to show higher pressure reaction compared to the manufacturer data. One stipulation for this is the force measurement system used has a small indenter ball whereas the manufacturer data is recorded using a flat surface based on DIN EN ISO 3386-2.
Figure4.8: load deflection of V190P foam
Foam VS Foam with sandpaper
Compared to the corresponding measurements taken on the „foams only‟ the values showed an increase in the reaction force by 1.8N for V190 plus and 2.8N for V270 plus at 1mm depth reading. This led to conclude attachment of a more rigid material like the sand paper will increase the overall rigidity of the combined material.
Attaching the rigid material (the sand paper) on the softer of the two foams i.e the V190Plus created less increase in reaction force. In other words the V270Plus (harder of the two foams) showed a significant increase in reaction force when the sand paper is attached on it even though the same type of sand paper was attached on both foams.
5 CONCLUSIONS
5.1 Conclusions
V270Plus (the harder of the two foams) showed a significant increase in reaction force when the sand paper was attached on it compared to the V190Plus under the same conditions.
With the current equipment and its parts quality the noise problem is reduced with 40%.
Measurements were better read, and understood by introducing regression lines.
Comparison of the force measurement system to VLRH system showed
adequate information on what aspects of the force measurement system should be improved. These include; force sensor‟s measuring range should include 8,3mN and noise should further be decreased.
Comparison of measurements on foams with manufacturer data showed a significant difference, probably due to the sandpaper material is significantly robust material than the foam and the foam material has less resistance to penetration.
Creating stress strain diagram output system in the software was not achieved due to time.
5.2 Recommendation to future activities
Future activities can be categorized into three parts;
Activities regarding the improvement of the force measurement system to get more accurate measurement values;
The NI CompactDAQ system – should be changed with a more quality one, possibly from the same company that manufactures the S2M force sensor used (HBM). This is hoped to help in electrical parts syncing better.
Setting up Stress strain diagram output system
Activities in regards to the upgrading of the force measurement system towards VLRH Standard;
The force sensor should have the following specifications; the following micro indenter from LNP manufacturer is ideal for this purpose. [28]
And all other electrical devices should comply to the new sensor
After the physical part of the system, comply with the VLRH requirement, the overall force measurement system should have an output of measured depth for a given input of force.
Activities in regards to the studying of foam behavior,
Include studies of the reaction of the foams in the period where the indenter is pulling up.
Foam behavior could further be studied by changing the 2.5mm diameter indenter to a flat 30mm diameter or other size.
Studying the foam behavior can better be achieved by using standardized measurement devices.
6 CRITICAL REVIEW
In general, the ultimate goal of our experiment is to predict how the sanding be affected. The tools used, and how different forces acting on the foamed sandpaper can prolong the lifespan of the sandpaper. As a result, the use of sandpaper can be reduced, the company will economically benefit, and together, the environment can be protected. Therefore, we have adopted points for sponges and studied the stress conditions at these points. Although we have improved the accuracy of existing force measuring systems and performed corresponding mathematical analysis, the resulting errors are still not small.
Since we came from different countries with different background, we managed to communicate, understand and deliver the work. Besides, even after this program we are masters in mechanical engineering, our knowledge is still limited to the electronic part and software (code programming), we need to learn more.
If we do the research again, we believe that the test equipment needs to be changed a little. The needle detector should be replaced with a disc type, so that the relationship between the pressure and the test depth can be directly obtained, and no complicated mathematical conversion is needed.
Finally, we believe that the lifespan of sandpaper is not only to study the force on the foam, but also to comprehensively study the temperature of the environment, the rotational speed of the equipment, the material being ground, and establish a corresponding model, or even simulation software, to scientifically predict and evaluate the life of sandpaper.
Figures
Figure 2-1 : process factors and responses ... 4
Figure2.2 Accuracy and Precision ... 6
Figure 3.1: the composition of the entire system ... 7
Figure 3.2: Granit table with axis and motor, 473 mm x 630 mm x 520 mm (h x w x d) done by Hugo Bonnet ... 7
Figure3.3: Sketched force measurement setup by Lea Kraft ... 8
Figure3.4: CAD drawing of the sensor part by Viktor Fres ... 8
Figure 3.5: Electronical elements built up by Lea Kraft ... 9
Figure3.6: One experiment on 12mm Vibration 190Plus & user‟s interface ... 11
Figure 3.7: Sensor cables ... 13
Figure3. 8: Noise range ... 13
Figure3.9: Hardness testing device for the VLRH method ... 14
Figure3.10: Force-time-pattern of (right: measuring head) the VLRH test method ... 14
Figure3.11: Relationship between hardness VLRH and depth of penetration ... 15
Figure3.12: Shore A Durometer ... 15
Figure3.13: The connections between the hardness scale VLRH and shore A, shore OO... 16
Figure3.14: Test foam samples ... 17
Table 1: basic mechanical properties test foams ... 17
Figure 4.1: Previous measurement noise(blue) VS improved range (red) ... 18
Figure4.2: Different regression model ... 19
Figure 4.3 Force-depth regression model of 12mm test foam ... 20
Figure4.4: Sketch shows the indenter of the company Bareiss ... 20
Figure4.5: pressure-depth regression model of test foam ... 21
Figure4.6: V190P foam VS V190P foam with sandpaper ... 22
Figure4.7: V270P foam VS V270P foam with sandpaper ... 22
Reference
[1] V.Fres, "Commissioning of a force measurement system," Halmastad University, Halmstad, 2017.
[2] K. Sundararajan, "iSixSigma," [Online]. Available: https://www.isixsigma.com/tools-templates/design-of-experiments-doe/desig n-experiments-%E2%90%93-primer/. [Accessed 5 April 2018].
[3] D. M. &. N. A. Fleck, "Spherical indentation of elastic-plastic solids," Department of Engineering, University of Cambridge, Cambridge, 1998. [4] E. Nordin, "Material characterization by indentation," 2013.
[5] P. Dizikes, "MIT News," 16 March 2010. [Online]. Available: http://news.mit.edu/2010/explained-reg-analysis-0316. [Accessed 8 April 2018].
[6] NCA, "Necessary condition analysis," Necessary condition analysis, [Online]. Available: http://www.erim.eur.nl/necessary-condition-analysis/. [Accessed 4 April 2018].
[7] G. Crlson, "Experimental Errors and Uncertainty," [Online]. Available: http://www2.ece.rochester.edu/courses/ECE111/error_uncertainty.pdf . [Accessed 06 April 2018].
[8] L.Kraft, "Development of robot-based polishing tools and of a force measurement system," Halmstad University, Halmstad, 2017.
[9] "drylin SHT-PL Preload," IGUS, [Online]. Available: www.igus.eu/wpck/3368/DryLin_SHT_PL_Preload. [Accessed 10 April 2018].
[10] Leadshine, "NTS electronic and components GmbH," Leadshine, [Online]. Available: https://mecheltron.com/en/product/es-m32320. [Accessed 6 April 2018].
[11] Omron, "S8VK Power Supplies," [Online]. Available: www.ia.omron.com/data_pdf/cat/s8vk_t057-e1_2_3_csm1012220.pdf.
[Accessed 12 April 2018].
[12] SIEMENS, "FI/LS-Protector," SIEMENS, [Online]. Available: http://www.produktinfo.conrad.com/datenblaetter/600000-624999/612746-da -01-en-FI__LEITUNGSSCHUTZ_TYP_A_1POL__C_10A.pdf. [Accessed 12 April 2018].
[13] "ES-D508," Leadshine, [Online]. Available: http://www.leadshine.com/productdetail.aspx?type=products&category=easy-servo-products&productype=easy-servo-drives&series=ES-D&model=ES-D 508. [Accessed 13 April 2018].
[14] NI CompactDAQ, "NATIONAL INSTRUMENTS," [Online]. Available: http://www.ni.com/sv-se/shop/select/compactdaq-chassis?modelId=125698. [Accessed 15 April 2018].
[15] NI9474, "DATASHEET NI9474," [Online]. Available: http://www.ni.com/pdf/manuals/373974c_02.pdf. [Accessed 15 April 2018].
[16] N. 9237, "NATINAL INSTRUMENT," [Online]. Available: http://www.ni.com/pdf/manuals/374186a_02.pdf. [Accessed 15 April 2018].
[17] "MathWorks," [Online]. Available:
https://www.mathworks.com/products/matlab.html..html. [Accessed 16 April 2018].
[18] MATLAB, "Why MATLAB," [Online]. Available: https://www.mathworks.com/products/matlab/why-matlab.html. . [Accessed 16 April 2018].
[19] "How do you avoid noise in sensor cables," Applied measurements limited,
[Online]. Available:
https://appmeas.co.uk/resources/pressure-measurement-notes/how-do-you-av oid-noise-in-sensor-cables/. [Accessed 20 April 2018].
[20] K. F. B. Kalantar-zadeh, Nanotechnology- Enabled Sensors, 2008.
[21] P. a. K.Herrmann, "Very low rubber hardness- A new hardness testing method for supersoft elastomers," KGK rubberpoint, 2006.
[22] PSM, "Shore Hardness," [Online]. Available: https://www.polymerservice-merseburg.de/en/plastics-testing/mechanical-test s/hardness-testing/shore-haerte.html. [Accessed 14 April 2018].
[23] CES Edupack, "Foams," 2018.
[24] BSW, "Vibration Isolation of Machine Foundations," BSW, [Online]. Available: https://www.berleburger.com/en/vibration-machinery/. [Accessed 25 May 2018].
[25] BSW, "Regufoam," BSW, [Online]. Available: https://www.berleburger.com/en/materials/regufoam/. [Accessed 23 April 2018].
[26] S. Tokmak, Examining foam behaviour with a Force Measurement System, Halmstad, 2018.
[27] Anwendungsbereiche, [Online]. Available:
http://www.bareiss.de/en/anwendungsbereiche/haertepruefung/Anwendung_ Ranges_of_Application.pdf. . [Accessed 04 April 2018].
[28] LNP, "LNP nano touch," LNP, [Online]. Available: https://lnp-northeim.de/en/products/lnp-nano-touch-en/. [Accessed 31 05 2018].
[29] H.Bonnet, "Evaluation and improvement of stainless steel polishing operations," Halmstad University, Halmstad, 2017.
Appendix
Appendix A Accuracy and precision
The first thing is to confirm what kind of data changes are caused by electromagnetic interference and whether the foam will have the same force when the measurement is take in different points but with the same 5mm depth and 1mm/s speed, we took the Vibration 270 Plus as an example, from the center to the edge, we made 10 different points, the distance between each of them is 1cm, besides, every point we measured for three times and take the average force (5mm depth point). The average force for the point 0 to 8 is 3.1046N, the tolerance is ±0.04. The data for point 9 was 2.4783, since it is on the edge of the foam, we didn‟t use data into our report.
Ten different measurement point with three repeat measurements at the same point
Later we found that when we took the same measurement with different speed, the graph will be more smooth, but it won‟t influence the final result
Same measurement with 1mm/speed (left) and 0.1mm/speed (right) Appendix B Regression model
1mm depth 0.1mm/s v190p onlyy 458𝑥2+ 556𝑥 + 6 , 2 9 74
5mm depth 0.1mm/s v190p only y 34𝑥2+ 632𝑥 + 379 , 2 9958
1mm depth 0.1mm/s v270p only y 9 9𝑥2 + 2388𝑥 + 73 , 2 9458
5mm depth 0.1mm/s v270 only y 686𝑥2+ 2768𝑥 + 92 , 2 9993
1mm depth 0.1mm/s v190p with sandpaper y 2 79𝑥2+ 6772𝑥 + 483, 2 9984
1mmdepth 0.1mm/s v270p with sandpaper y 2 58𝑥2+ 2332𝑥 + 527, 2 9994
V190s foam with sandpaper VS v270P foam with sandpaper 1mm depth
E-mail abaydamtedotet@gamil.com Phone no. +46 765740874 E-mail qikanghe2017@gmail.com Phone no. +86 18621700895

![Figure 3.1: the composition of the entire system [8]](https://thumb-eu.123doks.com/thumbv2/5dokorg/4270506.94727/11.892.206.687.310.599/figure-composition-entire.webp)
![Figure 3.5: Electronical elements built up by Lea Kraft [8]](https://thumb-eu.123doks.com/thumbv2/5dokorg/4270506.94727/13.892.173.721.124.663/figure-electronical-elements-built-lea-kraft.webp)
![Figure 3.7: Sensor cables [19]](https://thumb-eu.123doks.com/thumbv2/5dokorg/4270506.94727/17.892.145.766.179.313/figure-sensor-cables.webp)