Teknik och samhälle Datavetenskap
Examensarbete
15 högskolepoäng, grundnivå
Performance impacts of profiling multi-threaded
applications with flexible analysis tools
Prestandapåverkan av profilering på flertrådade applikationer vid användning av flexibla analysverktyg
Alexander Hardwicke
Examen: Kandidatexamen 180 hp Huvudområde: Datavetenskap Program: Data- Telekom
Datum för slutseminarium: 2014-06-02
Handledare: Bengt J. Nilsson
Abstract
The aim of this study was to investigate how the use of profilers impacted the performance of multi-threaded applications. This study was undertaken in the framework of a project for Edument AB, creators of one of the profilers investigated in this study. Specifically, the study aimed to find out what additional overhead can result in profiling multi-threaded applications, with regards to CPU use, memory use, and additional time taken to complete execution. The paper hypothesised that the selection of data that each profiler recorded would impact the performance, with those that recorded a very large amount of detail about the application being profiled would introduce a higher overhead.
A selection of five profilers was made, each profiler offering a range of features and functionality, and a test application was written to simulate a multi-threaded application. A very lightweight application, referred to as the monitoring application, was also writ-ten which recorded the overhead each profiler used, along with the overhead of the test application and the time taken to run. Essentially, each profiler was itself profiled by the monitoring application, ensuring consistent overhead data was gathered for each profiler.
The results of the study showed that the choice of profiler can have a substantial impact on the performance of the application being profiled. One profiler resulted in execution of the test application taking 513% as much time to run, and adding an overhead of 1400% memory use. After analysing this data, there appeared to be a correlation between what features the profilers recorded and the overhead, consistent with the hypothesis put forward at the beginning of the study.
Sammanfattning
Syftet med denna studie var att undersöka hur användningen av profilers påverkade pre-standan hos flertrådade applikationer. Studien genomfördes inom ramen för ett projekt med Edument AB som skapat en av de profilers som undersökts i studien. Mer specifikt så syftade studien till att ta reda på vilken ytterligare CPU-tid och RAM som användes och hur mycket längre tid det tog att exekvera en flertrådad applikation vid användningen av profilers. Uppsatsens hypotes var att valet av data som varje profiler registrerade skulle påverka prestanda, och att de som registrerade fler detaljer om applikationen skulle ha störst påverkan.
Fem profilers valdes ut med olika egenskaper och funktioner och en testapplikation skrevs för att simulera en flertrådad applikation. En minimalistiskl applikation skrevs också och användes för att registrera varje profilers påverkan på RAM och CPU, samt hur testapplikationen påverkades av profilern. Alltså, varje profiler har var för sig blivit profilerad för att försäkra att samma data konsekvent samlats in.
Resultaten visade att valet av profiler kan ha stor påverkan på den profilerade app-likationens prestanda. Användningen av en av profilerna ledde till att testapplikationen tog 513% så lång tid att exekvera och lade också till 1400% ytterligare RAM-användning. Efter en analys av insamlade data verkade det finnas ett samband mellan de funktioner som varje profiler erbjöd och påverkan på applikationens prestanda vilket stämmer överens med uppsatsens hypotes.
Acknowledgements
I should like to thank Bengt J. Nilsson for all of the help and assistance he has given me when writing this dissertation, as well as Tore Nestenius for the inspiration to perform this study.
On a more personal note, my thanks go out to my wife for all the support and help, and for not entering labour before I finished writing my dissertation.
Contents
1 Introduction 1
1.1 Background . . . 1
1.2 Previous Research . . . 2
1.3 Definition of the Problem . . . 2
1.4 Aim . . . 3 1.5 Hypothesis . . . 3 1.6 Limitations . . . 3 1.7 Competing Interests . . . 4 2 Method 5 2.1 Description . . . 5 2.2 Selection of Profilers . . . 6 2.3 Analysis . . . 8 2.4 Reliability . . . 9 3 Results 10 4 Discussion 14 4.1 Time Taken . . . 14 4.2 CPU Usage . . . 14 4.3 Memory Usage . . . 16 4.4 Conclusion . . . 17 4.5 Limitations . . . 18 5 Conclusions 19 5.1 Future Work . . . 19 A Appendix: Tables 23
1
Introduction
1.1 Background
Software is becoming more and more common in society across an ever growing range of devices, most recently handheld devices like smartphones and tablets. Much of this software is exposed to laymen users and is typically expected to be easy to use, powerful, and to always have a responsive user interface.
The ever-growing capabilities and user experiences in software requires more and more processing power. Developers have traditionally relied on the fact that the central pro-cessing units (CPUs) in these devices have, with great regularity, increased in propro-cessing power, for decades following the predictions made by Moore [13], known as Moore’s Law. However, this trend is slowing and the clock speed of CPUs is no longer increasing as rapidly, as CPUs are hitting what is described by Hennessy and Patterson [6] as the Power Wall and performance is improving less and less each year [1].
Manufacturers of CPUs have moved their production model to having multiple cores in each CPU, as described by Asanovic, Bodik, Catanzar et al. [1], allowing the CPU to execute multiple commands in parallel, rather than concurrent tasks having to run serially as on a single core CPU [6]. However, traditionally written software (software that executes code in serial and does not take advantage of multiple cores) does not gain any increase in performance; to take advantage of the multiple cores, developers need to write their applications to run in parallel via the use of multi-threading techniques [6].
Multi-threaded software is simply defined as software in which different parts of the application are executed concurrently instead of all code being run serially. Many com-puters and devices run multiple pieces of software concurrently, as users expect multiple applications to be running simultaneously and each application should be able to perform multiple tasks in parallel. If the CPU has multiple cores, these different applications and threads can run these commands in parallel, which means that the commands can be exe-cuted simultaneously. This can provide an increase in performance and an improved user experience [6]. According to Asanovic, Bodik, Catanzar et al. [1], a feasible future could involve what they call manycore devices, with hundreds or even thousands of cores on a CPU. Taking advantage of this will become something future developers will have to do if they wish to program efficiently.
Many developers find that writing multi-threaded applications is much more difficult than single-threaded and it introduces a large variety of problems [7, 6]. Barberis, Cuva and Malnati [2] as well as Larson and Palting [8] have documented the development of multi-threaded profiling tools to help teach students about the problems of threading due to this difficulty. This is because as soon as an application becomes multi-threaded, the developer can not guarantee the order in which code executes, which can cause severe problems in badly written multi-threaded software, such as deadlocks and race conditions [7, 8, 15]. Various techniques have been developed to help write more efficient multi-threaded code, and to avoid the pitfalls. However, monitoring what multi-multi-threaded code does, how it performs, and observing the potential improvements to performance can still be difficult and requires specialised tools, referred to in this paper as profilers.
Profilers are tools that can monitor and record various data about software running on
a computer. They can profile applications in different ways (described by Diep and Elbaum [5] as Full Profiling, Targeted Profiling and Profiling with Sampling), but what they all have in common is that they record data about the profiled application. This typically means recording numerical data such as how much of the processor or memory the application is using, or recording what method calls the application takes, often visualising them in UML [2, 3]. Larson and Palting [8] describe the problems with many profilers and the lack of support for multi-threading, and that others have been deprecated and are no longer supported.
1.2 Previous Research
Investigations into alternative methods of profiling that record a narrower set of data have been undertaken. Kazi, Jose, Ben-Hamida et al [3] describe the creation of the JaViz profiler, which displays graphical representations of the application’s execution tree and highlights potential problems such as threading deadlocks. Barberis, Cuva and Malnati [2] document the creation of a similar tool, JThreadSpy, which has a particular focus on multi-threading and visualising the problems that can occur, such as deadlocks. They also discuss the potential overhead of profiling, and conclude that using an external library in the application to be profiled adds the lowest amount of overhead.
Chen and Tsao [4] investigated profiling embedded systems and discuss in depth the im-portance of a low overhead when profiling, particularly on embedded devices. As software overhead increases, the power consumption increases, and if the overhead grows too much, embedded devices will not be capable of running the profiling tools. Their conclusion is that, particularly for embedded devices, keeping overhead low is of such importance that they recommend combining hardware and software profiling so that as little software as possible is needed, while still keeping the advantages software brings.
Diep and Elbaum [5] discuss in detail the problems of profiling tools and the cost of overhead. Their presentation of different types of profilers (Full Profiling, Targeted Pro-filing, Profiling with Sampling and Triggered Profiling) shows that each way of profiling presents a tradeoff in terms of overhead and features. They conclude that using targeted and sampling profiling techniques can reduce the number of probes by an order of magni-tude, which greatly increases profiling’s viability.
Krintz, Mousa, Nagpurkar et al [7] come to similar conclusions, finding that sample-based profiling is the most effective as it achieves the highest accuracy with the least over-head. They discuss how profiling software that uses sampling offers flexibility, portability and great accuracy, but that significant sampling introduces large overheads which can affect the software’s behaviour and reduce the accuracy of the gathered information. They conclude that selective sampling provides accurate data while introducing significantly less overhead. Thain and Wheeler [15] come to similar conclusions.
1.3 Definition of the Problem
As mentioned, previous studies regarding profilers have typically been focused on writing a profiler for a specific language or problem [2, 3, 8]. However, these tools are becoming more and more required, due to the increase in devices with multiple cores [6] and software
with multiple threads to take advantage of the hardware. The choice of profiler is a key decision in the development process, as a wrong choice could hinder the developer. There is also little research comparing different profilers and how the profilers themselves can affect the application they are profiling.
The degree to which the profiler affects the software it is profiling can lead to a variety of impacts and potential problems. If the profiler uses too much processing power, the software being profiled may use a differing number of cores or cache more data than it would without the profiler. Especially when dealing with multiple threads, issues like these can change the behaviour of the threads and the order they execute because thread execution is non-deterministic [2], and potentially conceal problems that a less invasive profiler would reveal. As such, awareness of the impact of the profiling software is key to efficient profiling of multi-threaded software.
Being able to investigate and discover performance problems quickly is, as described by Krintz, Mousa, Nagpurkar et al [7], becoming a requirement of many developers, even profiling software that is actually deployed and not in development [5]. This is especially true with embedded systems and mobile devices [4, 7].
A study investigating this impact should help lead to better profiling and help use the tools in a more efficient way, leading to software that is improved with regards to perfor-mance and the way it uses threading. As described by Diep and Elbaum [5], evaluating the benefit and applicability of profiling techniques is a significant challenge and research into this field can help to reveal new techniques and knowledge about profiling.
1.4 Aim
This dissertation investigated the difference between various profilers, with the aim of finding out how large profiler overhead is and whether it affects the profiled software. The overhead was measured by how much the use of the CPU (which, if high, can change the way the application?s threads are handled and severely affect results) increased, how much RAM overhead was added and how much more time it took to execute a test application.
1.5 Hypothesis
The hypothesis of the paper is that the profilers that offer more features and more detailed data results will have the largest impact on the overhead and running time of the profiled software.
This hypothesis will be tested by attempting to answer how much impact –in terms of CPU time, memory overhead and additional time is taken –the use of pro-filing software introduces.
1.6 Limitations
The research undertaken in this dissertation is aimed at the use of profiling applications. Other profiling methods, such as probing the CPU directly and monitoring what happens at a hardware level are not in the scope of the dissertation and will not be examined.
1.7 Competing Interests
This study was performed within the framework of a project for Edument AB, creators of one of the profilers investigated in the application.
2
Method
2.1 Description
This dissertation involved an investigation of the impact of various profiling tools in terms of the additional memory and processor overhead their use resulted in.
One possibile way to investigate the impact of profilers is to analyse the source code of the software itself. As described by McQuaid [9], the more interesting and complex parts of source code typically give more qualitative results and do not have precise meanings that can be described mathematically. This would make direct comparisons between pro-filers more complex and introduce bias, particularly if the propro-filers are written in different programming languages. This would also be difficult as a lot of profilers are professional software and the source code to the applications is not available to be investigated.
Another way to investigate, and one that would be independent of the profiler’s pro-gramming language, would be to perform a statistical survey amongst programmers that have used a selection of profilers. Surveys are, as stated by Oates [14], common and useful for empirical research. Pertinent information, such as the overhead each profiler adds, could be gathered via surveys and the data investigated. However, there are a large amount of factors that the survey would struggle to take into account, such as user bias, the users’ ex-periences with profilers involving different applications being profiled or different hardware being used for different profilers.
The very nature of this sort of investigation leads one to attempt to gather empirical evidence, by experimentating on and observing each profiler being tested, which can then be used to compare the profilers in a clear, unbiased and verifiable way [14]. Once this became clear and an experiment had been chosen as the method, a selection of profilers was made, with a range of capabilities and from a range of manufacturers. The choice of profilers is further discussed in the following section of this paper.
A test application, written in C# and using .NET, was written as an example of a multi-threaded application, which will hereafter be referred to as the test application.
This test application creates and starts a certain number of thread groups serially, starting each group when the previous group finishes. Each thread group contains three threads that execute simultaneously. Each thread group reads data (a set of 1,000,000 integers) from a data file on disk, processes the data and sorts it into an ascending list. Each thread then executes some high-intensity CPU work by running a ?crunch? method, which performs 10,000 loops of several high-complexity mathematical operations. The final result of each mathematical operation is synchronised with the rest of the thread group.
Once all of the thread groups complete, the synchronised data is output by the main application thread, which then repeats the process with a different number of thread groups. The number of thread groups is written in the application and averages around ten thread groups (resulting in 30 threads) running simultaneously, with peaks as high as 32 thread groups and as low as 3 thread groups. Once all of these thread groups have completed, the test application exits.
A second application, referred to as the monitoring application, was written to monitor both the test application and the profiler being used at the time. This application, when launched, ceases further execution until both the current profiler and test application are
open.
When both the test application and profiler have opened, the monitoring application records the memory usage and CPU usage of the profiler and the test application, sepa-rately. It also records the exact time the test application starts and finishes, and calculates the average, minimum and maximum values for both CPU usage and memory usage, sep-arately for the profiler and test application.
A final set of tests were run, using the monitoring and test applications but with no profiler running. This meant that there was a set of baseline data of the testing application with which to compare to the results of each profiler test.
Two of the profilers (Profiler 1 & Profiler 3) only record data when the user requests that the profiler do so. In the case of Profiler 1, a snapshot of memory is taken and stored, and in the case of Profiler 3, the data sampling is programmed in the application’s code and is gathered by the profiling client on user request. These profilers are what Diep and Elbaum [5] refer to as Profiling with Sampling. The other three profilers fit the pattern of Full Profiling.
In the case of Profiler 3, unlike all of the other profilers, the application being profiled is expected to expose the data to the profiler, rather than the profiler using .NET to get the information it requires. This means that the test application included the library that Profiler 3 provides when being used for Profiler 3. It also had a few extra lines of code used to tell the library to record the application’s CPU and memory use, and to record when each method in the test application started and finished execution. This data is exposed to Profiler 3 by a small HTTP Web Service that the Profiler 3?s library automatically starts when it is used.
For both of these profilers, a snapshot was taken when every fourth thread group completed.
2.2 Selection of Profilers
Choosing a good selection of profilers was a vital part of this experiment. As the hypothesis of the paper supposes that the capabilities of the profiler affect the overhead, the selection of profilers needed to contain several different profilers, each with different capabilities and methods of working.
As this paper focused on the impact of the choice of profiler, as many other variables as possible needed to be kept constant. As such, the choice was made to have only one test application written in one language. Multiple test applications could have been written, but the differences this would have introduced (e.g. the different implementations of threading, the difference between compiled and interpreted languages, whether interpreted languages use features like JIT) would have introduced an unacceptable amount of varying data that would have modified the results and made them much less accurate. Therefore, to ensure that the only varying source of data was the profilers, each profiler would have to work with the same test application, which means the profilers all needed to work with one programming language or framework. As such, a popular language or framework needed to be chosen; languages that are used less frequently amongst developers are less likely to have a selection of profilers to choose from.
The best candidate was C#: it provides modern, easy to use threading APIs that permit an efficient, quick testing application to be written. C# is one of several languages that support .NET and all use the Common Language Infrastructure (CLI), and there are a large range of profilers that support any CLI application, as described by Microsoft [10]. This broad selection of profilers and the capability to write a good testing app meant that the concluded choice was C#. The selection of profilers contains commercial products as well as free alternatives, to ensure a broad spectrum of data sources.
The profilers that were chosen, along with the numbers that will be used to refer to them throughout this paper, were:
1. ANTS Memory Profiler 2. ANTS Performance Profiler 3. Edument CodeProbe
4. Microsoft Concurrency Visualiser Tools as a part of Visual Studio 5. YourKit .NET Profiler
These five profilers provided a good sample of the different features that profilers can offer. Profilers 1 and 2 are profilers from the same source, but each with a different focus: one focuses on the memory usage of the profiled app, looking to find memory leaks and how efficiently the memory is used, while the other looks at processer performance, looking for inefficient code or threading problems. Both share a common code base and functionality, and as such comparing both profilers can show the difference between two very similar profilers, purely based on what type of data.
This selection of profilers cover both Full Profiling and Profiling with Sampling as de-scribed by Diep and Elbaum [5]. Profilers 1 and 3 are profilers that use sampling techniques, while Profilers 2, 4 and 5 use full profiling and record all data at all times.
The following table provides the pertinent details about each profiler:
Profiler Data Gathered Real-Time Visualisa-tion/Recording?
Profiler 1 Number of and size of objects in memory, Number of and size of used assemblies,
Difference in memory usage between snapshots
No. Only records and dis-plays when the user elects to take a snapshot
Profiler 2 Call tree, File I/O,
Processor use over time
Yes
Profiler 3 When programmer-defined events begin & end Memory use over time
Processor use over time
Recording is in real-time, but visualisation is only when the user has elected to connect and receive data Profiler 4 Number of cores used over time,
Number of threads used over time, What each thread is doing at any time, Processor use over time
Application is also a full programming IDE, with full debugging functionality
No. Profiling gathers data until either the profiled ap-plication ends or the pro-filer stops, after which the data is processed and ren-dered.
Profiler 5 Call tree, Method list,
Number of threads over time, Processor use over time, Memory use over time, Garbage collection over time
Yes
Table 1: Description of Selected Profilers
2.3 Analysis
The nature of the experiments performed resulted in data on a ratio scale, which permitted direct comparisons to be made between the different profilers.
The baseline tests performed on the test application showed the memory and processor use that the application, the threads and the .NET Framework required. Each profiler was then compared to the baseline data, giving the amount of overhead each profiler added. The data was collated and presented in various graphs. As described by Oates [14], graphs and charts enable the researcher and the reader to quickly see patterns amongst the data, and notice extreme values, which was ideal. The data was then analysed mathematically, calculating percentage overheads and total CPU usage by combining the per-second CPU values with the time the test took to run.
This data was then further analysed to find out what the ultimate overhead costs were of each profiler, and the results were compared to the paper’s hypothesis.
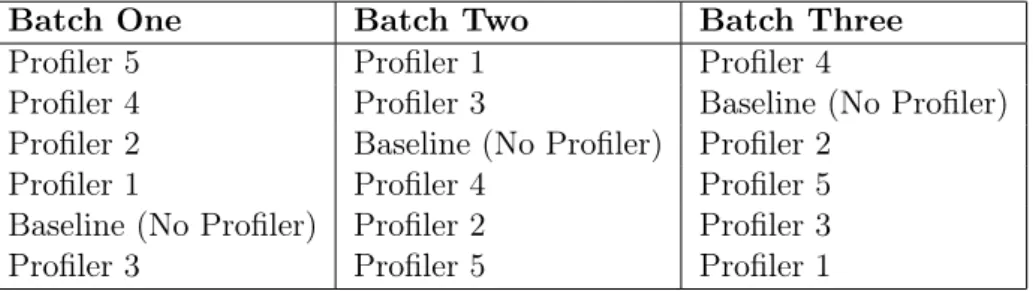
Batch One Batch Two Batch Three Profiler 5 Profiler 1 Profiler 4
Profiler 4 Profiler 3 Baseline (No Profiler) Profiler 2 Baseline (No Profiler) Profiler 2
Profiler 1 Profiler 4 Profiler 5 Baseline (No Profiler) Profiler 2 Profiler 3 Profiler 3 Profiler 5 Profiler 1
Table 2: Order of Test Groups
2.4 Reliability
Each test on each profiler was performed three times and the data sets were averaged, to diminish the effect of minor inconsistencies or outliers. Any result set with a large inconsistency of data was discarded and performed again. This helps ensure that the data is reliable and consistent.
All of the profilers run on the .NET Framework. To reduce unpredictable behaviour, the .NET optimization features were all disabled via the .NET Framework Debugging Context options, as described by Microsoft [12]. This disables features such as caching and other optimizations and guarantees that each time the tests were run, they ran in the same way, and that no data could be cached and used by other profilers.
Rather than running the test of each profiler three times consecutively, each profiler was tested in turn, three times, in a unique order each time, with each profiler being closed after each test. This ensures that the profilers themselves cannot cache data or otherwise affect the results.
3
Results
For each profiler, the following data was gathered: • Time taken to run test application (seconds) • RAM use of the test application
• CPU use of the test application • RAM use of the profiler
• CPU use of the profiler
Throughout the results section, CPU usage is displayed as the percentage used per core. The computer the tests were run on has a dual core Intel processor with HyperThreading, which means that the operating system reports that the computer has four CPU cores. As such, the maximum percentage that could be reported is 400%, if all four cores were fully utilized.
Each chart contains baseline data. This is the recorded data for the test application without any profiler running.
All of the data in the charts has been averaged between the three times each test was performed. All of the data (except for total time taken to run) was then averaged out (each group of fifteen data points were averaged into one data point). This was done because some of the profilers resulted in over 1000 data points, which was far too high a degree of accuracy for the charts.
0 100 200 300 400 500 600
Baseline Profiler 1 Profiler 2 Profiler 3 Profiler 4 Profiler 5
T i m e ( s e c o n d s )
Figure 1: Time Taken to Complete Tests for Each Profiler
0.0 50.0 100.0 150.0 200.0 250.0 300.0 350.0 400.0
Baseline Profiler 1 Profiler 2 Profiler 3 Profiler 4 Profiler 5
Percentage
of
One
Core
Used
Average Used CPU: Test App Average Used CPU: Profiler
Figure 2: Average CPU Usage by Test and Profiler
The darker colour shows the CPU usage of the test application, and the lighter colour shows the additional CPU used by the profiler itself.
0 100 200 300 400 500 600
Baseline Profiler 1 Profiler 2 Profiler 3 Profiler 4 Profiler 5
RA
M
(M
B)
Average Used RAM: Test App Average Used RAM: Profiler
Figure 3: Average Memory (RAM) Usage by Test and Profiler
The darker colour shows the RAM usage of the test application, and the lighter colour shows the additional RAM used by the profiler itself.
100 150 200 250 300 350 400 1 5 9 13 17 21 25 29 33 37 41 45 49 53 57 61 65 Percentage of One Core Used Time (seconds)
Baseline Profiler 1 Profiler 2 Profiler 3 Profiler 4 Profiler 5
Figure 4: CPU Usage over Time This chart shows the CPU usage of each profiler over time.
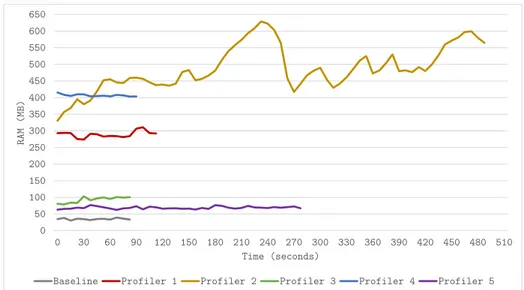
0 50 100 150 200 250 300 350 400 450 500 550 600 650 0 30 60 90 120 150 180 210 240 270 300 330 360 390 420 450 480 510 R A M ( M B ) Time (seconds)
Baseline Profiler 1 Profiler 2 Profiler 3 Profiler 4 Profiler 5
Figure 5: Memory (RAM) Usage over Time This chart shows the RAM usage of each profiler over time.
4
Discussion
In this section, the results of the experiment will be analysed to find out the answers to the posed questions. The section is divided into several sub-sections, separating the time, CPU and memory data for a more detailed analysis, and combining the data points at the end for a conclusion.
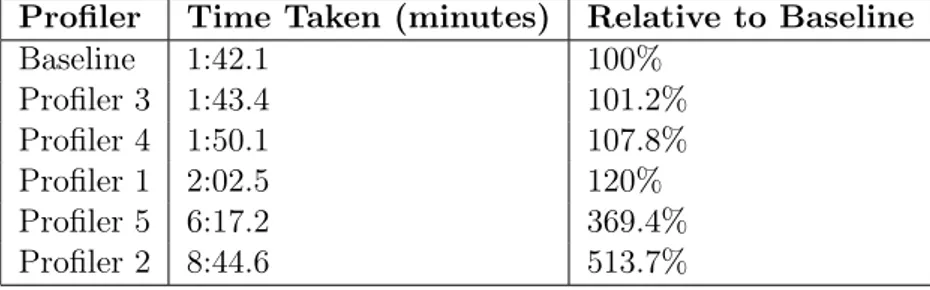
4.1 Time Taken
Figure 1 shows that the choice of profiler can have a large impact on the time it takes the test application to run. The following table shows the profilers ordered by time taken.
Profiler Time Taken (minutes) Relative to Baseline Baseline 1:42.1 100% Profiler 3 1:43.4 101.2% Profiler 4 1:50.1 107.8% Profiler 1 2:02.5 120% Profiler 5 6:17.2 369.4% Profiler 2 8:44.6 513.7%
Table 3: Time Taken, Ordered
From this data, we can see that the additional time taken ranges from 1.2% longer (Profiler 3) to 413.7% longer (Profiler 2). This suggests that there is a correlation between the number of features offered by the profiler and time taken, as Profilers 2 and 5, which are the profilers with the widest range of features (such as real-time visualisation and code stack recording) are those that have by far the largest impact.
4.2 CPU Usage
Figure 2 shows that the average CPU Core Usage for the most part is not affected by the choice of profiler. In the following table, the relative percentage has been calculated and put in ascending order.
Profiler Average CPU Core Usage /s Relative to Baseline
Profiler 2 169.8 70.5% Baseline 240.8 100.0% Profiler 1 241.3 100.2% Profiler 3 241.6 100.4% Profiler 4 244.9 101.7% Profiler 5 344.5 143.1%
Table 4: CPU Core Usage, Ordered
Again, Profilers 2 and 5 are those that deviate most from the baseline. Profiler 5 uses the most amount of CPU usage per second and takes longer to execute the test application than any other profiler, which means that the total CPU usage is very high. Interestingly, Profiler 2 uses the lowest amount of CPU time per second, actually using a significant amount less CPU per second than the test application did in the baseline tests. This implies that a non-CPU intensive task is occuring while the test application executes, which is delaying how quickly the test application can execute further code.
All of the other profilers use within 2% as much CPU as the test application on its own, with Profilers 1 and 3 using 0.2% and 0.4% more CPU per second respectively. The figure also shows that the CPU use of the profilers, even for Profiler 2 and Profiler 5 is minimal and that they affect the amount of CPU that the test application itself uses.
Figure 4 shows that Profilers 2 and 5, which have stuck out before are clearly those that have the most impact. The other profilers appear to have very similar CPU use and time scales as the test application itself.
Profiler 2 uses roughly 70% of the CPU per second that the test application itself takes, but it takes over 500% as long to complete the test run as without the profilers. Profiler 5 uses roughly 140% of the CPU per second that the test application takes and takes 370% more time to complete.
If we multiply the Core CPU Usage per second of each Profiler with the time each profiler takes to run, the results will let us compare how much CPU each profiler used in total over the entire run. This data is presented in the following table. The Additional CPU Time column’s data is calculated via how much more CPU time in seconds is used relative to the Baseline, i.e. (time taken - baseline time) / baseline time * 100, and baseline time taken is 102.1.
Profiler Average CPU Use Time Taken (s) Additional CPU Time Baseline 240.8% 102.1 0.0% Profiler 1 241.3% 122.5 20.2% Profiler 2 169.8% 524.6 262.3% Profiler 3 241.6% 103.4 1.6% Profiler 4 244.9% 110.1 9.7% Profiler 5 344.5% 377.2 428.5%
Table 5: Additional CPU Usage Over Time
Profilers 2 and 5 are again the largest values by far, and here we can see that although Profiler 1 is the closest in CPU use to the test application, using only 0.5% more, the additional time it takes means that Profiler 3 has the least CPU impact of all of the profilers. This also shows that despite Profiler 2 using the least amount of CPU time per second, the additional CPU time it consumes during test execution is substantial.
4.3 Memory Usage
Figure 3 shows that the memory overhead is dramatically affected by the choice of profiler. This data has been collated and the overhead calculated and is shown in the table below.
Profiler Average Memory Usage (MB) Relative to Baseline
Baseline 34.8 100.0% Profiler 5 68.7 197.6% Profiler 3 92.7 266.8% Profiler 1 289.4 832.6% Profiler 4 406.7 1170.2% Profiler 2 487.4 1402.4%
Table 6: Memory Usage, Ordered
Yet again, Profiler 2’s usage is significant, using 1402.4% as much RAM as the test ap-plication. However, the profiler that uses the least amount of additional RAM is Profiler 5, using 97.6% more. Profiler 3 again has a lower overhead, second only to Profiler 5.
None of the profilers except for Profiler 2 affect the RAM use of the test application itself to any large degree, using between 0% and 560.9% more RAM. The RAM overhead mostly comes from the profiler itself. Profiler 5 has a very low overhead here, taking only 12.8 MB more RAM. Profilers 1, 2 and 4 have very large overheads, at 245.5 MB, 257.5 MB and 372.0 MB additional RAM on top of what the test application already uses with each profiler attached.
That Profiler 2 has a very excessive memory overhead suggests that it is using large amounts of memory to profile and record what the test application is doing. This recording is likely what is delaying the execution of the test application substantially, which in turn causes the CPU usage per second to be so low.
Figure 5 shows that although Profiler 5 doesn’t add much memory overhead, the ad-ditional time it takes to run means that much more RAM is consumed by the profiler and test application than would be otherwise. It also shows that the memory usage of all of the profilers over time, except for Profiler 2, is fairly level and constant. Profiler 2’s use of memory appears to grow and grow, dropping substantially halfway through the execution before beginning to grow again.
Microsoft [11] discuss how memory consumption can affect the performance of applica-tions. As more RAM is used, the operating system will store less data in the CPU’s cache, and will instead store it in the RAM, or even a virtual memory page file on the computer’s internal storage. Each of these stages adds delays to reading memory, particularly internal storage which is 10,000 times slower than RAM. This could explain why Profilers 2 and 5 take a significant amount of extra time to execute the test. This also agrees with the previous research taken by C. Krintz, H. Mousa, P. Nagpurkar et al [7], who further discuss the problems of additional memory overhead.
Lastly, it also appears to show that again, Profiler 3 has the least impact on the execution of the test application and is the closest in memory usage to the baseline data.
Overall, the large impacts in overhead are caused by Profilers 2 and 5, and Profiler 3 seems to have the least impact.
4.4 Conclusion
The following table lists the profilers, first ordered by their CPU impact (Additional CPU Time Consumed) and then by their memory impact (Average Additional RAM Used).
Profiler CPU Impact Memory Impact Profiler Profiler 3 1.6% Profiler 5 97.6% Profiler 4 9.7% Profiler 3 166.8% Profiler 1 20.2% Profiler 1 732.6% Profiler 2 262.3% Profiler 4 1070.2% Profiler 5 428.5% Profiler 2 1302.4%
Table 7: Impact of Profilers
From all of the gathered data, we can see that Profiler 3 has the lowest CPU impact taking time into account (and the impact is almost negligible) and has the second lowest memory overhead. As such, it appears to be the most light-weight profiler. This agrees with the original hypothesis, as Profiler 3 provides the least number of features, and the profiling is done by the application itself, rather than an external profiler: the external client simply retrieves the data from the application. This agrees with the research taken by Barberis, Cuva and Malnati [2], who find that using an external library introduces the least overhead.
However, Profiler 3 requires substantial work on the part of the developer, as an external library has to be used and the developer must state in the application’s code exactly what data should be gathered and where. In a larger application, particularly one that is already established with a lot of source code, Profiler 3’s low overhead may not be worth the additional time and developer hours it would take to implement the library.
At the other end, Profiler 2 uses the second highest amount of CPU during execution, and has by quite a bit the largest memory overhead. As such, it appears to be the profiler with the largest impact.
Both Profiler 2 and Profiler 5 substantially increase the time it takes to execute the application being profiled. This can have drastic effects on the way the applications run, particularly with multi-threading: in a non-profiled context, a thread could complete ex-ecution before an I/O operation completes, but the large exex-ecution delays these profilers introduce could cause the thread to complete afterwards. This could conceal bugs in the application or give misleading performance data, which defeats the purpose of using a profiler.
However, one limitation of this experiment is that the test application was run with a rather large number of threads, substantially more than one might expect in small consumer applications. This high number of threads may have affected the performance of Profilers 2 and 5 that record extensive threading data. For applications that frequently run many
threads (such as web applications), however, this data is extremely relevant.
Additionally, the large overhead added by Profilers 2 and 5 would, particularly for remote profiling and embedded devices, likely make them unusable, as both Chen and Tsao [4] and Krintz, Mousa, Nagpurkar et al [7] found in their previous research.
As Profiler 1 and Profiler 2 share a common core code base, but provide different fea-tures and record in different ways, the difference between the two profilers is interesting. The substantial differences show that Profiler 1, which profiles via sampling, has a sub-stantially smaller overhead than Profiler 2, which uses full profiling. That Profiler 3 has the lowest overhead of all of the tested profilers also reinforces this conclusion, as it is also a sampling profiler. This agrees with the research by Diep and Elbaum [5], Krintz, Mousa, Nagpurkar et al [7] and Thain and Wheeler [15], who all found that profiling through sampling was a method that could substantially decrease the overhead of profiling.
Profiler 4 has the second lowest impact on CPU, but has the second highest impact on memory use. A large portion of the memory overhead is likely due to the fact that Profiler 4 is a fully functional IDE and provides a mass of features far beyond any of the other profilers. Being built in to the IDE also makes it much easier to use the profiled data, as the application can be written and profiled in the same tool, sharing performance data between different areas of the tool. Profiler 4 had no memory impact on the test application at all, with all of the memory overhead coming from the profiler itself. As such, for development purposes appears to be the best choice for low-overhead alongside Profiler 3, as a static memory overhead coming from the development tools used to write the application is something that can be taken into account and is not likely to affect the application being profiled. In particular it doesn’t have the disadvantages of Profiler 3 and can be used at any point in development without any additional work by the developer.
4.5 Limitations
This study only investigated one testing application. The application used a very small amount of memory, a large number of short-life threads, and a high amount of CPU. The high number of short-lived threads and CPU usage can have been problematic for the profilers that track thread life and the call stack, as many threads running at the same time means a very complicated and deep call stack was made. As such, the analysed data may not be representative of common real-world applications.
5
Conclusions
This dissertation aimed to investigate and find out how much profilers impact the perfor-mance of the software they are profiling and how much overhead they add, with a focus on multi-threaded applications. This was due to the increasing popularity of multi-core devices and that software is expected to be more responsive, which requires threading.
The hypothesis was that the profilers that offer the largest amount of data about the software they profile would add the largest overhead. To test this, a test application was written that used varying amounts of CPU and threads to provide a range of data for the profilers to gather. A selection of profilers, both commercial and free, were chosen to profile this test application. These profilers had a varied degree of functionality, ranging from minimal profiling to extensive tracking. The way they recorded data was also different, some fully profiling all data, some taking samples [5]. The test application was then run while profiled by each profiler.
The tests showed that the profilers do add overhead, the degree to which they do ap-pearing to depend upon the features they offer. All of the profilers added a substantial memory overhead, with the profiler with the lowest RAM usage still doubling what’s re-quired. The CPU usage per second for each profiler was not dramatically affected by the choice of profiler, but the time the test application took to complete was substantially increased for certain profilers, resulting in a much larger amount of CPU usage over the duration of the test application’s execution. Two of the profilers, use the same code base but record different data and in different ways: the one that recorded more data was a full profiler, while the other was a sampling profiler. The full profiler’s footprint was sub-stantially larger than the sampling profiler in every metric, which is what the hypothesis predicted.
5.1 Future Work
The data presented in this dissertation reveals that certain profilers and techniques they use can have substantial impact on the applications they are profiling. However, more questions have been raised than answered and further research is needed.
The test application can be expanded and improved so that it provides a better repre-sentation of a real-world multi-threaded application. There could be more file I/O, memory management and simulated reactions to incoming data. Interactions with databases and other systems would also add additional realism to the test application. A larger test application with a more realistic memory footprint could show that the profilers memory overhead is static and independent of the size of the test application, in which case on larger test applications, with at least some of the profilers it would become insignificant.
Additionally, the test application could also be run multiple times using a varying number of threads, to see to what degree each additional thread impacts each profiler. This could reveal what profiling features cause the largest amount of increased overhead, which could assist with profiling massively-multi-threaded software.
Alternatively, one or several test applications could be written in different programming languages, particularly languages of a different paradigm such as an application written using a functional programming language. This could use the same profilers and use F#, a
functional programming language that uses the .NET Framework, or could use an entirely different set of profilers. Using a different language or framework would reveal whether the choice of .NET had a particular impact on the profiler performance and overhead.
Lastly, a wider range of profilers could be tested. Open source profilers would add not only provide extra information, but also permit a code review to examine what specific parts of the profiler are causing the overhead. Additionally, comparing multiple profilers that provide very similar or identical features would reveal to what degree the choice of profiler is important, as it is possible that the profilers that had the highest overhead were not as well written as those that used less.
References
[1] K. Asanovic, R. Bodik, B. C. Catanzaro, J. J. Gebis, P. Husbands, K. Keutzer, D. A. Patterson, W. L. Plishker, J. Shalf, S. W. Williams, K. A. Yelick. The Landscape of Parallel Computing Research: A View from Berkeley EECS Department, University of California, Berkeley (2006)
[2] C. Barberis, C. M. Cuva, G. Malnati, JThreadSpy: Teaching Multithreading Pro-gramming by Analyzing Execution Traces, PADTAD ‘07 Proceedings of the 2007 ACM workshop on Parallel and distributed systems: testing and debugging (2007) 3–13
[3] B. Ben-Hamida, C.J. Hescott, D.P. Jose, J. A. Konstan, I. H. Kazi, C. Kwok, D. J. Lilja, P.C. Yew, JaViz: A client/server Java profiling tool, IBM Systems Joruanl, Vol. 39, No. 1 (2000) 96-117
[4] J. J. Chen, S. Tsao, SEProf: A high-level software energy profiling tool for an em-bedded processor enabling power management functions, Journal of Systems and Software, Vol. 85, No. 8 (2012) 1757–1769
[5] M. Diep, S. Elbaum, Profiling Deployed Software: Assessing Strategies and Testing Opportunities, IEEE Transactions on Software Engineering, Vol. 31, No. 4 (2005) 312–327
[6] J. L. Hennessy, D. A. Patterson. Computer Organization and Design, 5th ed. Oxford: Elsevier Inc. (2003).
[7] C. Krintz, H. Mousa, P. Nagpurkar, T. Sherwood, Efficient remote profiling for resource-constrained devices, ACM Transactions on Architecture and Code Optimiza-tion, Vol 3, No. 1 (2006) 35–66
[8] E. Larson, R. Palting, MDAT: A Multithreaded Debugging and Testing Tool, SIGCSE ‘13 Proceeding of the 44th ACM technical symposium on Computer science education (2013) 403–408
[9] A. McQuaid, Profiling Software Complexity, ProQuest Dissertations and Theses (1996)
[10] Microsoft, C# Language Specification, Microsoft Press (2006)
[11] Microsoft [ Internet ], Memory Usage Auditing For .NET Applications. [ cited 2014-04-20 ]. Available from: http://msdn.microsoft.com/en-us/magazine/dd882521.aspx [12] Microsoft [ Internet ], Making an Image Easier to Debug. [
cited 2014-04-20 ]. Available from: http://msdn.microsoft.com/en-us/library/9dd8z24x%28v=vs.110%29.aspx
[13] G. E. Moore, Cramming More Components onto Integrated Circuits, Proceed-ings of the IEEE, Vol. 86, No. 1 (1998) 82–85
[14] B. J. Oates, Researching Information Systems and Computing. London: Sage Publi-cations Ltd (2003).
[15] D. Thain, K. B. Wheeler, Visualizing massively multithreaded applications with ThreadScope Concurrency Computation: Practice and Experience (2010) 45–67
A
Appendix: Tables
Profiler Time Taken (minutes) Baseline 1:42.1 Profiler 1 2:02.5 Profiler 2 8:44.6 Profiler 3 1:43.4 Profiler 4 1:50.1 Profiler 5 6:17.2
Table 8: Time Taken to Run Tests
Profiler Average CPU Core Usage /s Baseline 240.8% Profiler 1 241.3% Profiler 2 169.8% Profiler 3 241.6% Profiler 4 244.9% Profiler 5 344.5%
Table 9: CPU Core Usage per Second
Profiler Test Application (MB) Profiler (MB) Total (MB)
Baseline 34.8 0 34.8 Profiler 1 43.9 245.5 289.4 Profiler 2 230.0 257.5 487.4 Profiler 3 47.9 44.8 92.7 Profiler 4 34.7 372.0 406.7 Profiler 5 55.9 12.8 68.7
Table 10: Memory Usage
Profiler Minimum CPU Core Usage Maximum CPU Core Usage Baseline 218.0% 251.3% Profiler 1 227.8% 263.6% Profiler 2 166.2% 175.3% Profiler 3 229.8% 252.2% Profiler 4 229.4% 255.5% Profiler 5 318.9% 360.4%
Table 11: Minimum and Maximum CPU Core Usage per Second
Profiler Minimum Memory Usage (MB) Maximum Memory Usage (MB)
Baseline 30.3 39.2 Profiler 1 273.8 310.8 Profiler 2 330.6 628.9 Profiler 3 78.8 103.1 Profiler 4 403.1 415.3 Profiler 5 62.3 76.9
Table 12: Minimum and Maximum Memory Usage per Second