Postadress: Besöksadress: Telefon:
OPTIMIZATION OF THE CHEMICAL
ANALYSIS OF SS-EN-GJL-250 USING
CASTING SIMULATION SOFTWARE
Yücel KASAP
THESIS WORK 2011
This thesis work has been carried out at the School of Engineering in Jönköping in the subject area of materials engineering. The work is a part of the Master of Science programme.
The author takes full responsibility for opinions, conclusions and findings presented.
Examiner: Ingvar SVENSSON Supervisor: Lennart ELMQUIST Scope: 30 credits (second cycle) Date: 2011-06-03
Abstract
The main purpose of the thesis work is based on achieving same mechanical properties on the three different sized bearing housings. The key mechanical property that had to be focused on was the hardness of the parts.
In order to achieve this goal, chemical compositions of the parts have studied. However there were some limitations on the composition variants. Allowed variables of the compositions are silicon, nickel and copper. Due to necessity another element, Molybdenum (Mo), was also introduced. After many simulations three different compositions are proposed. Then the feasibility of results of casting simulation software investigated. And finally an optimization guideline has proposed.
Chemical composition researches have carried on casting simulation software, which is called Magma5. Following the completion of the simulations phase, proposed compositions trial casted at the company. Subsequent to trial castings cast parts had tested for their hardness values. In order to bring the thesis to completion simulation outputs and trial test results had compared.
With the help of a casting simulation software composition optimisation of different sized parts could be easily optimised in order to achieve same results.
Many simulations are executed with different composition for the silicon, nickel, copper and molybdenum variants. It was seen that Mo additions significantly increase the mechanical properties of the parts. Nickel and copper acts similarly on the hardness values, however nickel addition reduce undercooling tendency at a greater rate.
Good inoculation is vital for the parts with thin sections. Decent inoculation helps to improve the microstructure and helps to get closer results to the simulated values. However software represents key information about undercooled zones on the part.
Contents
1
Introduction ... 1
1.1 BACKGROUND ... 1
1.2 PURPOSE AND RESEARCH QUESTIONS ... 1
1.3 DELIMITATIONS ... 2
1.4 OUTLINE ... 2
2
Theoretical background ... 3
2.1 RELATIONSHIP BETWEEN COMPOSITION AND STRENGTH OF GREY CAST IRON ... 5
2.2 GREY IRON METALLURGY ... 7
2.3 EFFECTS OF SILICON, NICKEL, COPPER AND MOLYBDENUM ON GREY IRON PROPERTIES ... 12
2.4 EFFECT OF INOCULATION ... 13
2.5 EFFECT OF POURING TEMPERATURE ... 15
2.6 PREVIOUS STUDIES ... 15
3
Method and implementation ... 17
3.1 MAGMA5 ... 17
3.2 BRINELL HARDNESS TEST ... 17
3.3 TRIAL CASTINGS ... 18
3.3.1 Pouring process ... 21
3.3.1.1 Automated production line ... 22
3.4 CAD MODELS ... 22
3.4.1 Small sized casting ... 23
3.4.2 Medium sized casting ... 24
3.4.3 Large sized casting ... 24
3.4.4 Simulation values ... 25
3.4.4.1 FB-SNL 511-609 ... 25
3.4.4.2 FB-SNL 517 ... 26
3.4.4.3 FB-SNLN 3056 ... 26
3.4.4.4 Chemical Composition ... 26
4
Findings and analysis ... 27
4.1 SIMULATION RESULTS ... 27
4.1.1 Effect of inoculation ... 27
4.1.2 Effect of pouring temperature ... 28
4.1.3 Effect of filling simulation ... 32
4.1.4 Effect of composition ... 33
4.2 FINDINGS ... 49
4.2.1 Composition ... 49
4.2.2 Tensile test specimens ... 50
4.2.3 Parts ... 50
4.2.3.1 Hardness ... 50
4.2.3.2 Simulations with exact trial compositions ... 51
4.2.3.3 Findings on the parts ... 59
4.2.3.4 Micro-structures ... 59
4.3 ANALYSIS ... 65
5
Discussion and conclusions ... 68
5.1 DISCUSSION OF METHOD ... 68
5.1.1 Positive and negative aspects of method of action ... 68
5.1.2 What could have done better ... 69
5.1.3 Validity and reliability of results ... 69
Content of Figures
FIGURE 1 IRON-CARBON PHASE DIAGRAM AT 2,5%SI.SOURCE:REF 2 P33 ... 5
FIGURE 2 GENERAL INFLUENCE OF CARBON EQUIVALENT ON THE TENSILE STRENGTH OF GREY CAST IRON.SOURCE:REF. 2 P9 6 FIGURE 3 STANDARD GRAPHITE FORMS IN CAST IRONS ACCORDING TO THE ASTMA247.SOURCE:REF 6 ... 7
FIGURE 4 GRAPHITE DISTRIBUTION IN GREY CAST IRON ACCORDING TO THE ASTMA247 AND SAMPLE PICTURES OF THE MICROSTRUCTURES.SOURCE:REF 6 ... 8
FIGURE 5 SCHEMATIC DESCRIPTION OF DEVELOPMENT OF THE EUTECTIC CELL AND SEM PICTURE OF THE EUTECTIC CELL. SOURCE:REF 7 ... 10
FIGURE 6 EFFECT OF SULPHUR ON CHILLING TENDENCY OF CAST IRONS.SOURCE REF:2 ... 14
FIGURE 7 ILLUSTRATION OF TEST PROCEDURE AND RESULTING DEFORMATION ON THE PART.SOURCE:REF 34 ... 18
FIGURE 8 TEST SPECIMEN MOULDS. ... 19
FIGURE 9 SNL-511 PATTERN, MARKED FOR TRIAL ALLOY 1. ... 19
FIGURE 10 SNL-517 PATTERN, MARKED FOR TRIAL ALLOY 2. ... 20
FIGURE 11 SNLN-3056 PATTERN. ... 20
FIGURE 12 COPES AND DRAGS IN THE PRODUCTION LINE. ... 21
FIGURE 13 DISAMATIC SAND MOULDING PRINCIPLE.SOURCE:REF 38 ... 22
FIGURE 14 MOULD FILLING PROCESS.SOURCE:REF 39 ... 22
FIGURE 15 PICTURE AND EXPLODED VIEW OF A BEARING HOUSING SYSTEM.SOURCE:REF 41 ... 23
FIGURE 16 SIZE COMPARISON OF THE PARTS, WHICH ARE USED FOR THE SIMULATIONS. ... 23
FIGURE 17 SMALL SIZED CASTING. ... 24
FIGURE 18 MEDIUM SIZED CASTING... 24
FIGURE 19 LARGE SIZED CASTING. ... 25
FIGURE 20 HARDNESS RESULTS OF PARTS WITH A) GOOD INOCULATION,B) FAIR INOCULATION. ... 27
FIGURE 21 HARDNESS RESULTS OF PARTS WITH A) GOOD INOCULATION,B) FAIR INOCULATION. ... 28
FIGURE 22 HARDNESS RESULTS OF 1450°C POURING TEMPERATURE. ... 29
FIGURE 23 HARDNESS RESULTS OF 1400°C POURING TEMPERATURE. ... 30
FIGURE 24 HARDNESS RESULTS OF 1375°C POURING TEMPERATURE. ... 31
FIGURE 25 A) HARDNESS RESULTS WITHOUT FILLING B) HARDNESS RESULTS WITH FILLING ... 32
FIGURE 26 HARDNESS RESULTS FOR SNLN-3056. ... 33
FIGURE 27 HARDNESS RESULTS FOR SNL-517. ... 34
FIGURE 28 HARDNESS RESULTS FOR SNL-511. ... 34
FIGURE 29 HARDNESS RESULTS OF SNL-511 FOR 0,3%CU. ... 35
FIGURE 30 HARDNESS RESULTS OF SNL-511 FOR 3,3%C AND PROBLEMATIC REGION. ... 36
FIGURE 31 HARDNESS RESULTS OF SNL-517 FOR 3,3%C AND PROBLEMATIC REGIONS. ... 36
FIGURE 32 HARDNESS RESULTS OF SNL-511 FOR 0,75%MN. ... 37
FIGURE 33 HARDNESS RESULTS OF SNL-517 FOR 2,1%SI;0,4%CU;0,35%NI. ... 38
FIGURE 34 HARDNESS RESULTS OF SNL-511 FOR 2,1%SI;0,3%CU;0,35%NI. ... 38
FIGURE 35 HARDNESS RESULTS OF SNL-511 FOR 1,9%SI;0,15%CU;0,2%NI. ... 39
FIGURE 36 HARDNESS RESULTS OF SNL-511 FOR 1,75%SI;0,1%CU;0,1%NI. ... 39
FIGURE 37 HARDNESS RESULTS OF SNL-511 FOR 1,7%SI;0,1%CU;0,15%NI. ... 40
FIGURE 38 HARDNESS RESULTS OF SNLN-3056 FOR 2,1%SI;1,0%CU;0,4%MO. ... 40
FIGURE 39 HARDNESS RESULTS OF SNLN-3056 FOR 2,0%SI;1,0%CU;0,5%MO. ... 41
FIGURE 40 TENSILE STRENGTH RESULTS OF SNLN-3056 FOR 2,0%SI;1,0%CU;0,5%MO. ... 42
FIGURE 41 HARDNESS RESULTS OF SNL-517 FOR 2,1%SI;0,3%CU;0,3%NI. ... 42
FIGURE 42 HARDNESS RESULTS OF SNL-517 FOR 1,8%SI;0,4%CU;0,3%NI. ... 43
FIGURE 43 HARDNESS RESULTS OF SNL-517 FOR 1,8%SI;0,1%CU;0,15%NI. ... 43
FIGURE 44 MINIMUM TENSILE STRESS RESULTS OF SNL-517 FOR 1,8%SI;0,1%CU;0,15%NI COMPOSITION.RED AREA SHOWS REGIONS LOWER THAN 250MPA. ... 44
FIGURE 45 HARDNESS RESULTS OF SNL-517 FOR 1,8%SI;0,25%CU;0,2%NI. ... 44
FIGURE 46 MINIMUM TENSILE STRESS RESULTS OF SNL-517 FOR 1,8%SI;0,1%CU;0,15%NI. ... 45
FIGURE 47 HARDNESS RESULTS OF SNL-511 FOR 1,8%SI;0,1%CU;0,15%NI. ... 45
FIGURE 48 HARDNESS RESULTS OF SNL-511 FOR 1,6%SI;0%CU;0,1%NI. ... 46
FIGURE 63 A)EUTECTIC CELL SIZE B)LAMELLAR SPACING FOR SNL-511ALLOY-2 ... 58
FIGURE 64 CHILLED AREA MARKED ON TOP OF THE PART ... 59
FIGURE 65 CHILLED AREAS MARKED IN A) RIGHT SIDE BOTTOM B) BOTTOM. ... 59
FIGURE 66 UNETCHED ALLOY 1 FOR A)SNL-511;B)SNL-517. ... 60
FIGURE 67 UNETCHED ALLOY 2 FOR A)SNL-511;B)SNL-517. ... 60
FIGURE 68 UNETCHED MICROSTRUCTURE OF SNLN-3056. ... 60
FIGURE 69 GRAPHITE FLAKE MEASUREMENTS FOR SNL-511A)ALLOY-1,B)ALLOY-2 ... 61
FIGURE 70 GRAPHITE FLAKE MEASUREMENTS FOR SNL-517A)ALLOY-1,B)ALLOY-2 ... 61
FIGURE 71 GRAPHITE FLAKE MEASUREMENTS FOR SNLN-3056 ... 61
FIGURE 72 MICROSTRUCTURE OF ALLOY-1 IN A)SNL-511,B)SNL-517 ETCHED WITH 2%NITAL. ... 62
FIGURE 73 MICROSTRUCTURE OF ALLOY-1 IN A)SNL-511,B)SNL-517 ETCHED WITH 2%NITAL. ... 62
FIGURE 74 MICROSTRUCTURE OF ALLOY-3 IN SNLN-3056 ETCHED WITH 2%NITAL... 62
FIGURE 75 ALLOY-1 ETCHED WITH 4%NITAL FOR A)SNL-511,B)SNL-517. ... 63
FIGURE 76 ALLOY-2 ETCHED WITH 4%NITAL FOR A)SNL-511,B)SNL-517. ... 63
FIGURE 77 SNLN-3056 WITH ALLOY 3 AFTER 4%NITAL ETCHING. ... 63
FIGURE 78 SNL511 WITH COLOUR ETCHING FOR A)ALLOY-1,B)ALLOY-2. ... 64
FIGURE 79 SNL517 WITH COLOUR ETCHING FOR A)ALLOY-1,B)ALLOY-2. ... 64
Content of Tables
TABLE 1 NATIONAL STANDARDS.SOURCE:REF 4 P31. ... 4
TABLE 2 BASE COMPOSITION AND VARIABLES FOR THE RESEARCH. ... 26
TABLE 3 STARTING COMPOSITION FOR THE SIMULATIONS. ... 33
TABLE 4 COMPOSITIONS OF TRIAL CASTING ALLOYS ... 49
TABLE 5 TENSILE STRENGTH AND HARDNESS VALUES OF THE TEST SPECIMENS OF Ø20 MM. ... 50
TABLE 6 HARDNESS RESULTS OF THE PARTS AND MEASURING POSITIONS. ... 50
TABLE 7 EUTECTIC CELL SIZE AND LAMELLAR SPACING RESULTS OF THE SIMULATIONS. ... 58
TABLE 8 FINDINGS FROM THE MICROSTRUCTURES ... 65
TABLE 9 AVERAGE DIFFERENCES FOR HARDNESS VALUES OF SIMULATION RESULTS AND REAL CASE RESULTS. ... 65
TABLE 10 DIFFERENCES OF AVERAGE LAMELLAR SPACING AND AVERAGE EUTECTIC CELL SIZE ... 67
TABLE 11 BASE COMPOSITION AND VARIABLES OF THE RESEARCH. ... 70
trial-casted in the company and subsequent mechanical tests are executed in the laboratory.
1.1 Background
Casting process is used by many companies due to its ease of production, freedom of design modification and material choice. Casting is a fast process from starting material to the final product. Because of these simplicities many researches and extensive work had been done in order to find complete understanding of this process. Huge amount of researches and knowledge of the effects of variants on casting and solidification processes resulted in the development of the simulation softwares. [1]
Nowadays many foundries are using softwares in order make more controllable products during the casting process. With the help of the simulation softwares, designers and foundry men have the chance of testing improvement options and affectivity of variants. Instead of making time consuming and expensive trial castings, simulations could be executed in order to find the results. In that manner potential problems could be found and eliminated already in the design phase. Also many variants of the products could be optimized without the need of the trials. [1]
Through all these benefits of the software, engineering department of SKF Mekan encountered the problem of realisation of the simulation results. Working with many different parts, patterns and models, seeing the effects of variants is vital for the department. However it would become very expensive and time consuming for making trial castings for each modification. On the conclusion they would like to search the possibility for the ease of chemical analysis optimisation and its reliability for reaching similar results for different products.
1.2 Purpose and research questions
The main purpose of the thesis work is based on achieving same mechanical properties on the three different sized bearing housings. The key mechanical property that is going to be focused on is the hardness of the parts. However the envisaged chemical composition must fulfil the tensile stress values of EN-GJL-250 specification also. The research questions could be defined as:
How should the chemical composition of the parts be arranged so that each part will have same mechanical properties?
Is it possible to optimize an analysis in casting simulation software such that the results could be trustworthy for direct use?
In order to optimize the chemical composition of a certain product how should be the guidelines created?
1.3 Delimitations
In order to find a suitable alloying composition main interest is given on the effects of silicon, nickel and copper, as it is requested by the company. Also in order to achieve the goal, introduction of another element (Molybdenum) became necessitated.
In this work filling or filling related simulations of the parts are not investigated deeply as the matrix or graphite structure is mostly affected by cooling ratio, chemical composition and the hot spots. However in order to obtain good and feasible results, simulations are executed with the filling simulations.
Most efficient way to eliminate hot spots or heat affected zones is a design change but it won't be investigated due to the limitations of the thesis proposal. Also by the request of the SKF Mekan AB, runner and gating systems of the moulds are not shown in the figures of this thesis work.
Beside those, main study of thesis work focused on achieving demanded hardness values. Yet the tensile strength values are also mentioned. Hardness values are measured from surface of the parts and tensile strength values are measured from separately casted test samples.
1.4 Outline
Firstly theoretical background of relation between the hardness and composition of grey cast iron will be introduced. Then metallurgy of the grey cast iron and alloying elements will be explained. Subsequently the inoculation will be explained and the theoretical background will be finished.
On the method section casting simulation software will be introduced briefly, Brinell hardness test will be explained and CAD models of the parts and initial values of the simulations are going to be presented.
Furthermore results of the simulations and proposed compositions for the trial castings will be described. Then the findings of trial castings are going to be exposed.
Finally the results will be analysed and discussed and the report is going to be concluded.
“The metallic matrix is tough and gives the cast iron its strength, while the graphite particles are brittle and lower the strength properties. (Diószegi, A., 2004, p1)” [2-4]
The matrix structure and graphite shape effects the material properties. As a result of this, classification of cast iron could be made according to these features: [2,4]
According to the graphite shape: o Lamellar (flake) graphite (FG); o Spheroidal (nodular) graphite (SG); o Compacted (vermicular) graphite (CG); o Temper graphite (TG);
According to the matrix:
o Ferritic: Soft with relatively low strength;
o Pearlitic: Hard and mechanical properties could be changed with cooling rate;
o Bainitic: Usually formed by austempering that results in high tensile stress, toughness and fatigue resistance;
o Austenitic: Retained when high alloying content cools. Good heat and corrosion resistance;
o Martensitic: Hard but brittle;
Common basic classification:
o White iron: Matrix structure has white appearance. The carbon precipitates as cementite in relatively large particles. That increases the bulk hardness of the part. Contrary have low toughness;
o Grey iron: Matrix structure has grey appearance. Carbon precipitates as graphite which gives better tensile strength values. Also it has higher compressive strength values comparable to steel; o Ductile iron: As a result of magnesium or cerium addition the
o Malleable iron: Cast as white iron and then heat treated for better mechanical properties.
Beside those classifications some irons with specific forms also exist and have special names. [2]
In 1997 a European Standard EN 1561:1997 was approved [4]. According to this standard EN-GJL-250, refers to grey cast iron with 250N/mm2 minimum tensile strength measured on the test piece. Table-1 shows information regarding the similarities in the national standards (Note that the values given below are not necessarily identical). In the SKF Mekan AB this specification is called as V10 and the required specifications of hardness and tensile strength are 180-230 HB and 250-350 N/mm2 respectively. (Appendix I)
Table 1 National Standards. Source: Ref 4 p31.
Country Specification Designation Minimum tensile strength (N/mm2) 100 150 180 200 250 275 300 350 400 Europe EN 1561:1997 EN-GJL 100 150 200 250 300 350 Japan JIS G5501 1995 FC 100 150 200 250 300 350 Class 1 2 3 4 5 6 Russia GOST 1412 1979 Sch 10 15 18 20 25 30 35 40 USA
ASTM A48-94a Grade 20 25 30 35 40 45 50 60
ASTM
A48M-94 Grade 150 175 200 225 250 275 300 325 350 400
Inter-national ISO 185-1988 Grade 100 150 200 250 300 350
Equivalent tonf/in2
diagram) to 3,5%C.
Figure 1 Iron-carbon phase diagram at 2,5% Si. Source: Ref 2 p33
“The addition of silicon to binary Iron-Carbon alloy decreases the stability of iron-carbide and increases the stability of ferrite (the α field is enlarged, and the γ is constricted).”( Davis, J.R., 1996 p5) As the amount of silicon content in this tertiary system increases, amount of carbon content in the eutectic decreases. [2,4]
An index was introduced, in order to define a relationship between carbon and silicon amount for their combined effect on the alloy system, which is named as “Carbon Equivalent (CE)”. Binary system of Fe-C alloy has an eutectic at 4,3%
C content. When the alloying elements are introduced amount of carbon in eutectic is decreased [2-4]. We can define that with an equation [2]:
%C + 1/3%Si = 4,3 (Eq. 1)
According to that we could simply define CE as how close is a given composition to its eutectic composition. We could simply define CE with following equation [2]:
CE = %C + 1/3%Si (Eq. 2)
In addition some alloying elements are also altering the amount of carbon in eutectic composition. However phosphorous have unignorable effects if it is used in large amounts. Phosphorous have a limited solubility in the austenite and it tends to decrease with the increasing amounts carbon. As a result during the solidification it segregates into the melt [2,5]. In order to make a more rational calculation on CE following formula should be introduced [2,4]:
CE= %C + ((%Si + %P)/3) (Eq. 3)
CE ratio of a cast iron could be useful to have an approximate value of expected strength in a section, as the composition of matrix and graphite flakes are related to alloy composition. Although different alloys with same CE may have different properties, since the same CE ratio can be obtained with different compositions. [2,4]
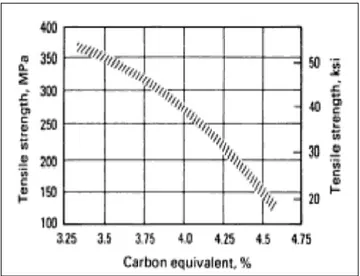
The strength of cast iron is adversely related to increasing ratio of CE. While the increasing amount of carbon and silicon promotes the graphitization ratio and decrease the tendency of chilling, the strength will be decreased because of the promotion of ferrite and coarsening of the pearlite lamellas. Figure 2 shows the relation between tensile strength and CE. [2]
Figure 2 General influence of carbon equivalent on the tensile strength of grey
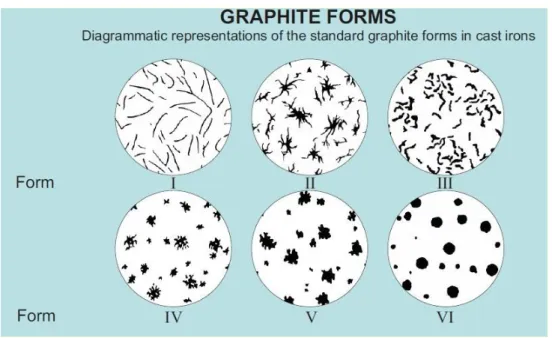
Figure 3 Standard graphite forms in cast irons according to the ASTM A247. Source: Ref 6
In grey cast irons carbon is precipitated in Type I graphite forms. ASTM A247 also defines the graphite distributions. Figure 4 shows these distributions.
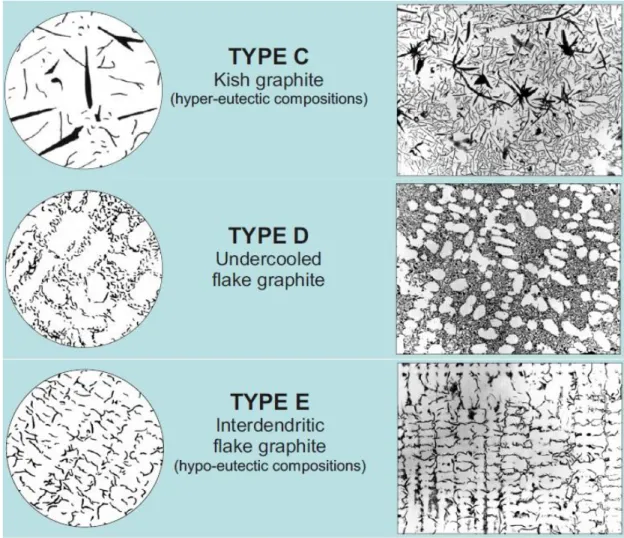
Figure 4 Graphite distribution in grey cast iron according to the ASTM A247 and sample pictures of the microstructures. Source: Ref 6
By the means of different graphite formations, resulting parts also show different properties. Properties of these formations are described below [2,4]:
Type A: Graphite flakes are distributed randomly and they have uniform flake size. This type of graphite structure forms when there is a high degree of nucleation in the liquid melt, because the solidification occurs close to equilibrium graphite eutectic. In other word, melt is solidified with minimum amount of undercooling. Thus causing to have high amount of pearlitic structure. Type A formation gives optimum mechanical results and preferred for engineering applications. Due to its higher pearlite content it will have uniform mechanical properties all along the part and will give better surface finish.
Type B: In melts with near eutectic composition if the melt solidified at higher undercooling rates than those occur at Type A, graphites are distributed in rosette pattern. During the solidification phase nucleation occurs at low levels and causes the eutectic cell to grow. At the centre of the rosette finer flakes formed due to undercooling, but as the structure grows flakes became coarser and shows Type A distribution.
types have fine undercooled graphites. Type D flakes are randomly orientated while Type E have preferable orientation. Fine flakes in both types could increase the iron matrix hardness. However this type of morphologies are not desired for engineering applications, because they are preventing fully pearlitic formations. Moreover as the ferrite have lower tensile strength than pearlite resulting tensile strength of the part would be reduced.
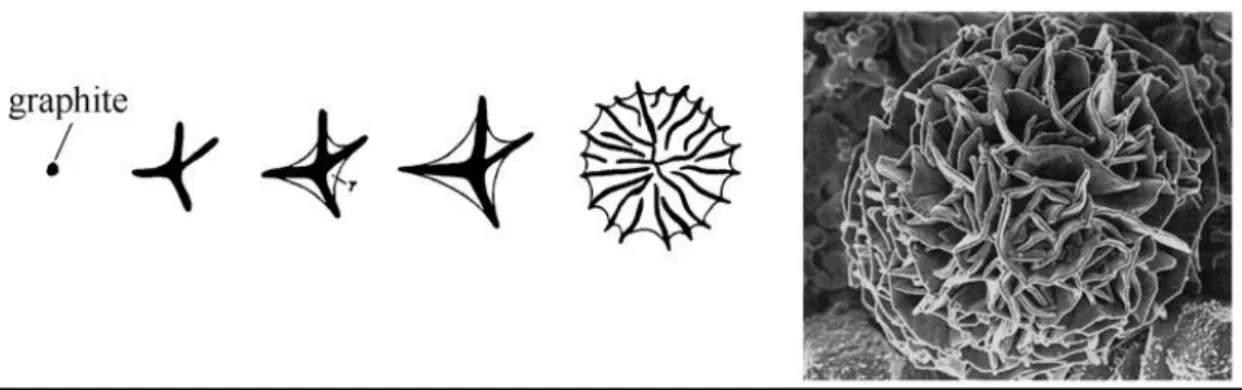
Without going into detailed information, basically it could be said that liquid melt of cast iron is a suspension of carbon, which is dispersed as various sizes of graphite particles. During the solidification each of these graphite particles are theoretically expected to become crystallization centres and form single eutectic cells. Then these cells continue to grow and forms the graphite structure of the part. [2,6,7]
In grey (Lamellar / Flake graphite) cast iron eutectic cells develop more or less spherical shape. Formation phases of the eutectic cell is shown in Figure 5. Each of these cells consist of interconnected graphite flakes and austenite. Later on the solidification, randomly distributed eutectic cells initiate the precipitation of graphite and austenite. This process is called nucleation. During the precipitation graphite lamellae start growing from the nucleation centre and keep the contact with the melt. The spaces between the lamellae are filled by the austenite. [2,6,7]
Sum of all a relation between the eutectic cell count and mechanical properties could be established. For example, the strength of the cast iron would be improved by increasing the amount of eutectic cells. Because higher amount of eutectic cells will precipitate more ferrite and increase the amount of Type A graphites. Also the tendency for chill would be decreased with the higher count graphite flakes. On the conclusion, it can be said that anticipated mechanical properties could be altered by modifying the cell counts. [7]
Figure 5 Schematic description of development of the eutectic cell and SEM picture of the eutectic cell. Source: Ref 7
In order to define an adequate composition, effects of the alloying elements should be considered. In most of the cases alloying elements are used for promoting the pearlite formation. Having higher pearlite content leads to have higher strength values in the part. In this section effects of the elements will be explained briefly. Nevertheless effects of silicon, nickel, copper and molybdenum will be explained further on the next section, as they are the domain of the thesis.
Carbon (C) is one of the major element of cast irons. By having highest addition to CE, it strongly influences the strength and hardness of the cast iron. Also C have an effect on the castability of the part, because of the liquid shrinkage and feeding ability [4]. Correspondingly increasing CE causes thermal conductivity to increase. [9]
Silicon (Si) is the other element of the ternary alloy system, which is already mentioned in section 2.1. It is a strong graphitizing element and decreases the tendency of chilling. Mostly used around 2%. [2,4,10]
Phosphorous (P) is a minor alloying element with two other interacting elements, manganese and sulphur. Control of these elements has crucial importance on the product consistency. Although it is not added intentionally, in the general case P increases the fluidity of the molten metal. Source of the P is scrap metals or pig irons, those added into the melt. It creates a phosphide phase on last solidifying zones of cast irons, thus reduces the shock resistance of part. Additions of higher content could promote shrinkage porosity. P maybe used for thin section and low strength castings, in order to improve castability by the means of increasing fluidity. Should be kept below 0,1% in order to avoid phosphide phase. [2,4,5]
Sulphur (S) is a harmful element for grey cast irons and should be kept as low as possible. Its effects are omitted with the addition of the manganese and mostly removed as a slag. However if the slag remained under the casting skin, could cause blowhole defects. Contrary it strongly effects the nucleation of the graphite. It is best to keep S content below 0,12%. [2,4] The reason of this content and nucleation effect of the sulphur is further explained in Section 2.4.
formation of pearlitic structure. On the other hand Cr also endorses carbides and could cause chill formation at the edges of casting when there are thin sections or high Cr addition rates. Generally used up to 0,5%. [2,4]
Molybdenum (Mo) additions of 0,25% to 0,75% have a great influence on the strength and hardness of the grey iron. Mo strengthens the matrix structure and refines the graphite flakes. Also stabilizes the structure at high temperatures. If the Mo extent goes beyond the 0,95%, it could promote molybdenum carbides. [2,4,10,11]
Copper (Cu) also increase the strength and hardness by promoting the pearlitic structure. This action is implemented by reducing the free ferrite. Due to its mild graphitizing effect, reduces the risk of chill in thin sections. Must be added in high purity in order to avoid tramp materials. Mostly used up to 0,5%. [2,4,10,11]
Nickel (Ni) does not have big effect on tensile strength of grey cast iron and does not promote carbides. Ni have minor graphitizing effect. [2,10]
Tin (Sn) is a strong pearlite stabilizer however only small amounts are effective. Addition in higher amounts would increase embrittlement. Used up to 0,1%. It may arise from addition of steel scraps. [2,4]
Lead (Pb) is a harmful element on the structure of flake graphite. Even in very small inclusions, such as 0,004%, could cause serious loss in the tensile strength. Might arise from steel scraps or copper alloys. [2,4]
Aluminium (Al) is promoting hydrogen pinhole defects. This phenomena is performed by increasing the tendency for hydrogen pick-up from the sand moulds. It could arise from the automotive steel scraps. [2,4]
Nitrogen (N) above 0,01% causes blowhole or fissure defects. However compacts graphite and promotes pearlite, consequently increases the strength. Existence of N could arise from the high steel charges. These steel charges are used during the cupola melting (Cupola furnace have a big cylindrical shape and positioned vertically. It is used for melting raw materials and prepare the casting melt). N can be treated with the addition of the Al or titanium (Ti). [2,4]
2.3 Effects of silicon, nickel, copper and molybdenum
on grey iron properties
As it is mentioned above silicon is a strong graphitizer and reduces risk of chilling. Conversely its effect on the ultimate tensile stress (UTS) is not changing linear with the added amount. Bates, C.E. [10] made a research with the varying amounts of Si content from 1,59% to 2,42%. Findings show that additions of up to 2% Si decreased UTS, because it caused more graphite to precipitate. Nonetheless, additions of 2% to 2,4% caused UTS to slightly increase. Plausible reason on this case could be a substitutional strengthening of matrix which is caused by the addition of Si. Higher Si additions have hardening and strengthening effect on the matrix structure, at the same time produces longer flakes those lowering the UTS.
In literature there are many researches regarding the effect of nickel on grey iron properties [10,12-14]. Researches are made for investigating the effects of Ni either alone or with other elements. One of the main result of all is that Ni promotes fine pearlite but decrease strength. In a research [10] tests are made with varying amounts of Ni from 0,06% up to 1,62%. According to the research with the increasing amounts of Ni chill depth of the cast sample decreased and bulk hardness increased. However on the additions of over 0,64% matrix hardness did not changed. Although the higher additions of Ni strengthened the matrix, the graphitizing effect of the element leads to larger flakes, which decreased the effect on the matrix strength.
Another researcher [13] vary amount of Ni with the introduction of cerium inoculation in order to develop a cheaper composition for an existing product. According to research crack propagation length reduced, thermal fatigue developed, graphite dispersed in refined grains and the number of the graphite count in a microstructure improved. Although the cerium inoculation improves the effect of Ni on graphite count, they act independently.
In the event of copper addition, researchers [10-12,15-17] explained that Cu promote finer pearlite and that way increase the stability of pearlitic structure. In his research Bates, C. E. [10] varied the amount of copper from 0,06% till 0,85%. Conferring to his findings Cu addition increase strength up to 0,35%. However the effect on higher amount of additions is much less and higher Cu additions have graphitizing effect. When the amount of Cu is increased, density, bulk and matrix hardness slightly increased. Contrary graphite surface area slightly decreased with the elongation of flake length.
According to researches [10,11,16] molybdenum have a thriving effect on the strength of cast iron. Researchers made tests with varying amounts of Mo addition in order to find its effect on strength and microstructure. Bates, C.E. [10] showed that increasing amount of Mo, raises bulk and matrix hardness, slightly reduce C volume fraction and tends to refine maximum graphite flake length. Xu, W. et.al. [11] and Hayrynen, K.L. et.al. [116] worked on grey iron in order to reach
2.4 Effect of inoculation
Inoculation could be defined as late addition of small quantities of alloy mixture into the molten iron in order to affect eutectic cell size and graphite distribution [19-21]. By the means of altering graphite size, shape or distribution, mechanical properties and machinability of the cast can be changed. Although the alloying elements might have same inoculation effects, alloying and inoculation should not be confused. The effects of the inoculants depend on the inoculant composition and amount used, temperature and time used for addition. [2,4,19]
Inoculation could be added into ladle or after the melt left the ladle (called Late inoculation). In late inoculation, it can be added either while entering the mould stream inoculation) or in the mould with the help of an insert (in-mould inoculation). As they have a short effectiveness time they should be added as late as possible. [2,4,19,20]
Materials those used as inoculant lose their affectivity after 10 to 20 minutes, this occurring called fading. Inoculants have highest efficiency just after the addition. The rate of fading depends on the composition of the inoculant and the condition of the melt iron. It should be emphasized that inoculants are intentionally arranged to have fading. Further on from a certain point, higher amount of nucleation sites would lead to non-uniform graphite distribution. [2,18] By means of inoculant many elements or alloys are used [2,20,21]. Silicon based alloys are most common used ones [2,4,19-22]. Beside those rare earth metals [23,24] and misch metals [25] are also used. Additionally some inclusions could act like nucleation site [26].
Edalati, K. et.al. [22] worked on effects of silicon carbide (SiC) and ferrosilicon (FeSi) with different pouring temperatures. It appeared that SiC addition lead to achieve finer microstructure because of higher liquidus and eutectic temperature, increased fluidity and decreased chill depth. Also increasing pouring temperature leads to increased liquidus temperature and decreased eutectic temperature.
Da, S. et.al. [23] researched the effects of rare earth (RE) metals inoculation to grey cast iron. It showed that proper amount of RE addition decreased eutectic cell size and purified the molten iron (reduced oxygen and sulphur content). In addition, when added in small amounts decreased the chill tendency though the higher amounts have opposite effect. Beside those effects the quality of grey iron could be significantly altered with RE inoculation, as a result of existence of RE in both graphite and matrix. Fengzhang, R. et.al. [24] worked on the effects of FeSi75+RE and FeSi75+Sr inoculation. During the experiments varying amounts of RE and strontium (Sr) had been investigated. It appeared that RE inoculation caused to have higher strength, hardness and better matrix homogeneity.
Vadiraj, A. et.al. [25] made experiments with misch metal inoculations. According to the research misch metal inoculations could affect the graphite morphology and matrix structure depending on the alloying elements of misch metals.
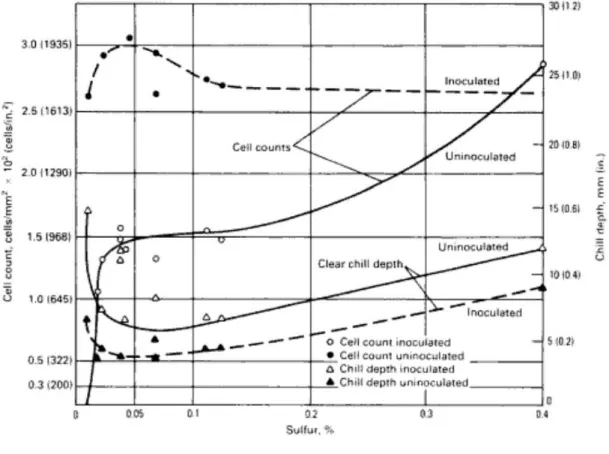
Sulphur content of the cast irons are generally kept under certain content. In most cases free S is controlled with Mn addition. However as a free element it has very strong effect on nucleation. Because it forms iron carbides (FeS) on solidification phase and prevents graphite cell growth and cause serious chilling. Effect of S content is shown in Figure 6. As it seen from the figure S has lowest effect on microstructure between 0,05 to 0,12% contents. As a result it is advised to keep S levels below 0,12%. However due to undercooling effect S content strongly affects cell counts. [2,27]
Increased pouring temperature could result in higher risk of gas entrapment, inclusions, poor metal structure, shrinkage, interrupted metal walls, mould penetration. Due to higher temperature the liquid melt will interact with air or mould surface for a longer time. During these interactions higher amount of air is taken into the melt. Later on the solidification phase this entrapped gases could lead to porosity or other problems. On the other hand the sand could start to corrode from surface, burn or release vapour or other gases because of the longer interaction time. This longer interaction could cause other forenamed problems. [2]
On the other hand lower pouring temperatures would lead to partially filled cavities, misruns, blow-holes and chill. Main cause of this case is lower fluidity or already solidified melt. [2]
According to the Edalati, K. et.al. [22] higher pouring temperatures resulted in lower amount of Type A graphite formation, increased chill depth and decreased eutectic cell count. Higher pouring temperatures resulted in to have higher liquidus temperature and lower eutectic temperature. Increasing difference between these temperatures resulted in higher undercooling ratios. Due to the undercooling higher quantity of graphite lamellae are formed other than Type A distribution.
2.6 Previous studies
In order to find a suitable base for arranging the outline of the thesis study, many sources are investigated during the literature study. Although there are many studies [3,28-31] which are carried on with the help of casting simulation softwares, none of them are focused on chemical composition optimization. However there are some existing researches which a relation could be specified. Especially research of Kumruoğlu, L.C. [30] could be easily optimized for this thesis work. Research is focuses on evaluation of the mechanical and microstructure properties of a chilled cast iron part.
On the other hand there are some researches [10,11,13,32] that are focused on composition optimisation by the means of trial castings. Even so the amounts of the researches that were studied on chemical optimization of grey cast irons are less than other casting types.
Despite the few amount of researches some are closely related to thesis work. For example in their research Xu, W., et.al. [11] used ASTM Class 35 alloy composition as a base starting point for further investigations. On the end of their research they proposed a feasible composition with good mechanical properties. As it could be seen from Table 1 also, Class 35 and GJL-250 are the same standards.
Combining the works of Kumruoğlu, L.C. and Xu, W., et.al. became helpful for the understanding and development of thesis work.
simulating the filling and solidification processes of casting. With the aim of reaching these goals the software uses finite differences method. In this method whole part is divided in finite elements, and the numerical analyses are carried on for each finite element in order. [1]
Magma5 software package consist of many modules and this study is carried on MAGMAiron module. The MAGMAiron module was developed for the solidification and feeding simulation of the grey, ductile and compacted graphite irons. The exact composition of the melt is used for calculating the nucleation, liquid fraction and solidification behaviour with empirical relations [3]. In this way user is provided with quantitative information about the solidification morphology of cast iron alloys as well as the distribution of the mechanical properties after solidification. [1]
3.2 Brinell hardness test
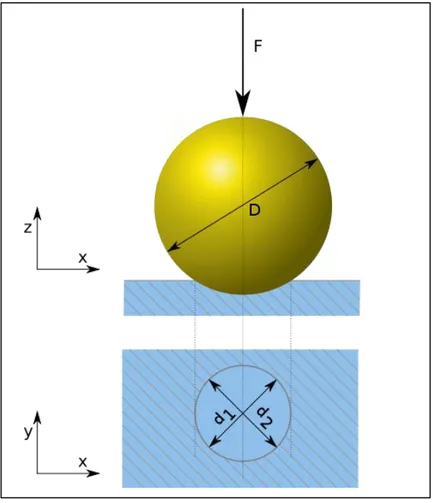
The hardness’s of the parts are measured by Brinell test. In test procedure a hardened steel ball with 10mm diameter is pressed into the surface with a load of 3000 kgf. For different materials applied force, diameter and material of the ball is arranged according to the tested part. For softer materials applied force is reduced, on the other hand for harder materials steel ball is replaced with tungsten carbide ball. When the load is removed after a specified amount of time, damaged area is measured. An illustration is shown in Figure 7. According to the involved area, surface hardness of the part could be calculated with equation 5. [33]
√ (Eq.5)
P= Applied force (kgf) D= Diameter of the ball
Figure 7 Illustration of test procedure and resulting deformation on the part. Source: Ref 34
3.3 Trial castings
The trial castings are carried out at SKF Mekan AB. During the trials 3 different alloy composition have been prepared. Alloy 1 and 2 are used for casting SNL-511 and SNL-517 and alloy 3 is used for casting SNLN-3056.
In order to arrange proposed alloy compositions a base melt is prepared in the induction furnace. Base melt is then poured into the pots in order to arrange suitable alloy compositions. During the trial castings, pots of 500 Kg capacity are used. Once the base melt is poured to the pots, slag layer is removed from the surface of the melt. After that alloying elements with calculated amounts are added into the pots. Then the base melt is stirred for decent mixture of alloy composition.
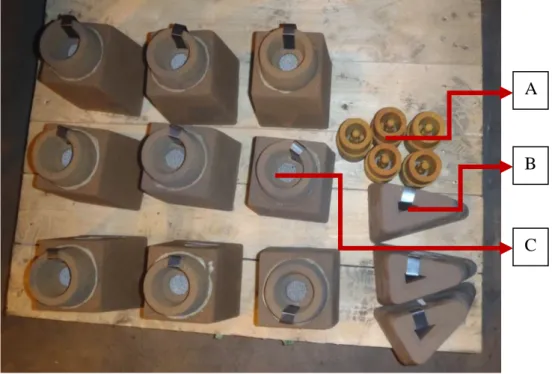
Before pouring the prepared alloyed melt into the sand moulds, some of the melt is poured into the test moulds. During the trials three different test moulds (Figure 8) are used: A: Composition test specimen; B: Chill test specimen; C: Tensile test specimen. The acquired specimens are then used for testing the chemical composition, carbide formation tendency and tensile strength.
Figure 8 Test specimen moulds.
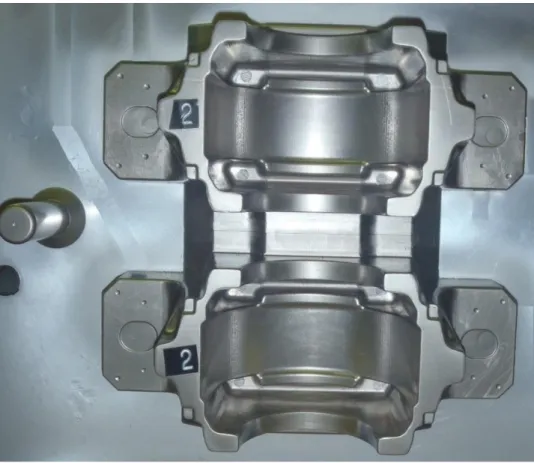
SNL-511 and SNL-517 are manufactured in the automated production line (further explained in section 3.3.1.1), which is used for mass preparation of sand moulds, and casted from the same alloys. Before preparing the sand moulds, the patterns are marked with “1”and “2” and “HB” in order to define the trial casted parts regarding their alloy compositions (Figure 9,10).
Figure 9 SNL-511 pattern, marked for trial alloy 1.
Figure 10 SNL-517 pattern, marked for trial alloy 2.
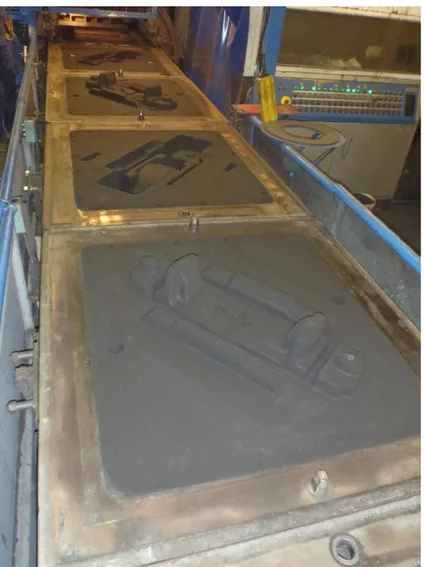
SNLN-3056 is manufactured in horizontal casting production line because of its big size (Figure 11,12).
Figure 12 Copes and drags in the production line.
3.3.1 Pouring process
Once the alloyed pots are placed for pouring process, inoculant is added into pots. Company is using Foundrysil from Elkem [35]as a ladle inoculant. The trial castings are carried out on a busy continuing production line with breaks for the trials. Therefore some compromises are given during the trial castings. These compromises are:
The casting temperature of the molten alloys didn’t check during the pouring procedure. On the regular castings before the pouring process, final alloyed melt is given special preparation (i.e. further heating, melt treatment, etc.). However this preparation requires decent amount of time and further heating. On the other hand trial pots are rather small in size and require less preparation. In order to prevent the cooling of the pots they are poured without checking the melt temperature and making the preparation.
Ladle inoculation is used instead of in-stream inoculation.
After the parts are solidified they are removed from sand mould and delivered to sand-blasting machines.
3.3.1.1 Automated production line
DISAMATIC is an automatic production line used for mass preparation of flaskless sand moulds. It basically consists of mould preparation unit and mould conveyor. This system developed by Danish Technical University professor Vagn Aage Jeppesen in the late 50’s. [36,37] A diagram and picture of this line can be seen on Figure 13 and 14.
Figure 13 DISAMATIC sand moulding principle. Source: Ref 38
Figure 14 Mould filling process. Source: Ref 39
3.4 CAD models
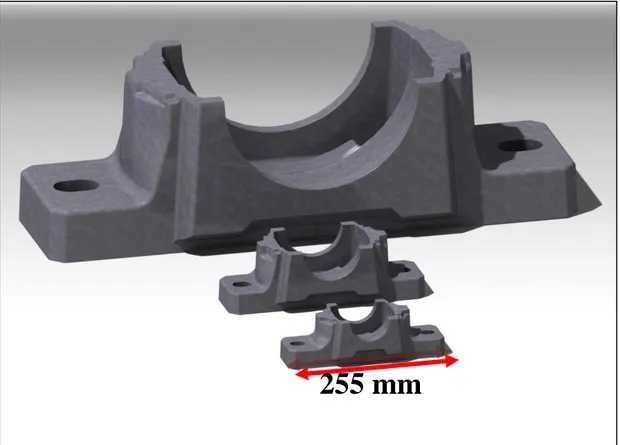
The cad models of the project parts are given by the company (Annotation: Runner systems are not shown in the figures of the thesis). The parts are used for ensuring housing for bearings. Three different sized models are chosen for analysing the suitable chemical composition, because hardness of the part is subjected to the cooling rate during solidification [40]. Cooling rate is directly affected by composition, inoculation, mould type and part size. [2] Figure 15 shows placement of the bearing and its respective parts onto housings. In Figure 16 the size comparison of the parts could be seen.
Figure 15 Picture and exploded view of a bearing housing system. Source: Ref 41
Figure 16 Size comparison of the parts, which are used for the simulations.
3.4.1 Small sized casting
FB-SNL 511-609: Small sized casting with rather thin sections. Filled in vertical position with four casting parts. Placement of the parts can be seen in Figure 17.
Figure 17 Small sized casting.
3.4.2 Medium sized casting
FB-SNL 517: Rather bigger size and slower cooling rates than the small. Horizontal filling and two casting parts. Can be seen in Figure 18.
Figure 18 Medium sized casting.
3.4.3 Large sized casting
FB-SNLN 3056: Being large sized casting, cause to have slow cooling rates. The casting is fitted with filters. Casting is shown in the Figure 19.
Figure 19 Large sized casting.
3.4.4 Simulation values
All of the moulds are filled in manner of gravity filling [42]. Pouring rate of the melt is defined by time. Because in the real case the pouring process is started with smaller rates, increased to a specified rate and end by decreasing the rate. Time specified setting suits more to the real case.
o Mesh size: ~20 million mesh cells ◦ SNL-511: ~1,6 million metal cells ◦ SNL-517: ~1,9 million metal cells ◦ SNLN-3056: ~1,5 million metal cells
o Heat Transfer Coefficient: Temperature dependant HTC o Sand: Green sand
o All pouring temperatures are selected at 1400°C at the beginning as it is the default setting of Magma. However later on the pouring temperatures are adjusted to their real case values.
3.4.4.1 FB-SNL 511-609 Pouring time: 12s
3.4.4.2 FB-SNL 517
Pouring time: 12s
Pouring temperature: 1350-1380ºC ; selected value: 1365ºC
3.4.4.3 FB-SNLN 3056
Pouring time: 20s
Pouring temperature: 1350-1380ºC ; selected value: 1365ºC
3.4.4.4 Chemical Composition
The basic composition of the castings could be given as follow. All percentages are weight ratios of system. “w,x,y,z” are variables of the composition. Other composition values are selected from the SKF Mekan AB’s requirement specifications (Appendix I). Base composition is shown in Table 2.
Table 2 Base composition and variables for the research.
C Si Cr Cu Mn Mo Ni P S
% 3,3 w 0,1 x 0,75 y z 0,05 0,075
Si, Cu and Ni are proposed variables of company. However Mo is also incorporated into the variables in order to reach demanded hardness values. The reason for the selection of Mo could be explained with following motives. Firstly the Xu, W. et.al. [11] worked on its effect and made some suggestions regarding suitable compositions. Secondly documentation of MAGMA suggesting not to use more than 2,0% Ni. However Ni does not have strong effect on hardness that means the necessity of higher amounts of Ni. Finally material price is more or less same for Ni and Mo. Beside that the hardness could be arranged in other ways (i.e. decreasing carbon equivalent, decreasing Mn, etc.) but the only variables of the work are Si, Cu and Ni. In that manner replacing Ni with similar costing material is a reasonable choice.
tiny variations.
4.1.1 Effect of inoculation
The difference between “Good (In Stream)” and “Fair (Ladle)” inoculation for the same composition is shown in the Figure 20 for the top side of the parts and 21 for the bottom side of the parts.
A)
B)
A)
B)
Figure 21 Hardness results of parts with A) good inoculation, B) fair inoculation.
It is clearly seen that fair inoculation will have problematic areas on thin sections or the edges of the part because of rapid cooling of mentioned areas. Those regions are marked with green, however only some of the areas marked. Nevertheless other areas have same properties. It can be seen that inoculation helps to prevent the carbides on thin sections or edges.
4.1.2 Effect of pouring temperature
The effect of the pouring temperature is shown in the following figures. The pouring temperatures are 1450°C, 1400°C and 1375°C respectively. Some parts are sectioned for better reflection of the results.
Figure 24 Hardness results of 1375°C pouring temperature.
Analysing the Figure 22 to 24 shows that changing the pouring temperature directly affects the hardness of the parts. It is evident that higher pouring temperatures will cause to have lower hardness values, due to longer cooling period gives more time for complete micro-structure formation.
4.1.3 Effect of filling simulation
As this thesis is focused on finding the correct alloy composition for different sized parts, primary stages are done without the contribution of filling simulations. Running the simulations without a filling option helps to find correct composition faster. For example a simulation with same mesh number finish in 3-4 hours without filling, however running the same simulation with filling will end in 17-18 hours. Below are the results for simulations with and without filling for the same composition (Figure 25).
A)
B)
Figure 25 A) hardness results without filling B) hardness results with filling
As seen above the results between two simulations are not that different. However without filling the simulation gives less realistic results on heat related problems. Sum of all it can be said that simulations without filling will help to reach the goal faster.
Table 3 Starting composition for the simulations.
C Si Cr Cu Mn Mo Ni P S
% 3,2 2,0 0,1 1,0 0,55 0,3 0,0 0,05 0,075
Figure 29 Hardness results of SNL-511 for 0,3% Cu.
Although the hardness value is decreased, results are still higher than the standard regulations. Then carbon content is set to the SKF values; 3,3%. Figure 30 and 31 show results for new composition.
Figure 30 Hardness results of SNL-511 for 3,3% C and problematic region.
Figure 32 Hardness results of SNL-511 for 0,75% Mn.
A number of simulations had been run with differing %Si contents. It had seen that a change on silicon content have a higher influence on the hardness values of SNL-511 than SNL-517. On SNL-517 varying amounts of Si content change the amount of undercooled areas, but it was not enough to overcome the problem totally. As a result effects of nickel addition and varying copper contents had started to investigate. Some results are shown in Figure 33 and 34.
Figure 35 Hardness results of SNL-511 for 1,9% Si; 0,15% Cu; 0,2% Ni.
Figure 37 Hardness results of SNL-511 for 1,7% Si; 0,1% Cu; 0,15% Ni.
Reasonable result is obtained for SNL-511 with alloy composition of 1,7% Si, 0,1% Cu, 0,15% Ni. In order to arrange same base composition for all the parts further simulations are run for the SNLN-3056. Feasible result is found for 2,1% Si, 1,0% Cu, 0,4% Mo (Figure 38).
Figure 40 Tensile strength results of SNLN-3056 for 2,0% Si; 1,0% Cu; 0,5% Mo.
For the case of SNL-517 further simulations are continued with varying Si, Cu and Ni values. Selecting criteria for the SNL-517 became finding a less problematic composition with sufficient minimum tensile stress values. Results are shown Figure 41 to 44.
Figure 42 Hardness results of SNL-517 for 1,8% Si; 0,4% Cu; 0,3% Ni.
Figure 44 Minimum tensile stress results of SNL-517 for 1,8% Si; 0,1% Cu; 0,15% Ni composition. Red area shows regions lower than 250 MPa.
Trial casting composition is selected for 1,8% Si, 0,25% Cu, 0,2% Ni alloying contents. Figure 45-46 shows the selection results.
Figure 46 Minimum tensile stress results of SNL-517 for 1,8% Si; 0,1% Cu; 0,15% Ni.
Many simulations had been executed for finding a suitable composition for SNL-511. Like SNL-517 main target of simulations became finding a composition that leads to fewer undercooled areas. Hardness or minimum tensile stress results were not a problem due to its rather small size. Also during the simulations it appeared that Ni and Cu have similar effects on the hardness results. However Ni addition helps to prevent heat related issues. Some results are shown in Figure 47 to 51.
Figure 48 Hardness results of SNL-511 for 1,6% Si; 0% Cu; 0,1% Ni.
Figure 49 Hardness results of SNL-511 for 1,6% Si; 0,3% Cu; 0% Ni.
Figure 51 Hardness results of SNL-511 for 1,75% Si; 0,1% Cu; 0,15% Ni.
For the trials a composition with 1,7% Si, 0,1% Cu and 0,15% Ni content is selected. Although the hardness values are little bit higher than the targeted values, problematic are less than the many other versions. Moreover in the trials of the suggested alloy compositions for SNL-511 and SNL-517, parts are casted in the same line and both compositions (Alloy-1 and 2) are tried for each two part. Results of SNL-511 are shown in Figure 52-53.
Figure 53 Minimum tensile stress results of SNL-511 for 1,7% Si; 0,1% Cu; 0,15% Ni.
C Si Mn P S Cr Ni Mo Al Cu % 3,26 1,70 0,76 0,041 0,078 0,027 0,021 0,006 0,002 0,101 Co Ti Nb V W Pb Mg B Sb Sn % 0,005 0,009 0,005 0,004 <0,007 <0,001 <0,000 0,003 <0,001 0,004 Zn As Bi Ce Zr La Se N % <0,001 0,024 <0,002 <0,002 0,002 <0,001 0,036 ~0,0107 C Si Mn P S Cr Ni Mo Al Cu % 3,22 1,74 0,74 0,039 0,078 0,027 0,165 0,005 0,002 0,102 Co Ti Nb V W Pb Mg B Sb Sn % 0,005 0,009 0,004 0,005 <0,007 <0,001 <0,000 0,002 <0,001 0,004 Zn As Bi Ce Zr La Se N % <0,001 0,024 <0,002 <0,002 0,003 <0,001 0,044 ~0,0101 C Si Mn P S Cr Ni Mo Al Cu % 3,22 1,87 0,78 0,038 0,078 0,027 0,203 0,005 0,003 0,265 Co Ti Nb V W Pb Mg B Sb Sn % 0,005 0,010 0,004 0,007 <0,007 <0,001 <0,000 0,002 0,002 0,004 Zn As Bi Ce Zr La Se N % <0,001 0,027 <0,002 <0,002 0,003 <0,001 0,046 >0,012 C Si Mn P S Cr Ni Mo Al Cu % 3,16 1,98 0,76 0,044 0,080 0,046 0,021 0,408 0,004 0,899 Co Ti Nb V W Pb Mg B Sb Sn % 0,005 0,010 0,004 0,008 <0,007 <0,001 <0,000 0,003 0,005 0,004 Zn As Bi Ce Zr La Se N % <0,001 0,028 <0,002 <0,002 0,003 <0,001 0,052 0,0097 Fe Cekv 93,90 3,71 ALLOY 1
Alloy 1 = Base Melt + Materials
Target composition % Ni: 0,15 Cu: 0,1 Si: 1,7 Mo: 0,0
Added materials Ni - -
-Fe Cekv
93,77 3,68
ALLOY 2
Alloy 2 = Base Melt + Materials
Target composition % Ni: 0,2 Cu: 0,25 Si: 1,8 Mo: 0,0
Added materials Ni Cu Si
-Fe Cekv
93,39 3,70
ALLOY 3
Alloy 3 = Base Melt + Materials
Target composition % Ni: 0,0 Cu: 1,0 Si: 2,0 Mo: 0,5
3,68
Added materials - Cu Si Mo
Fe Cekv
4.2.2 Tensile test specimens
Tensile test specimens are machined according to the EN 1561:1997 standard, and tested for the tensile strength and hardness results. The hardness results measured here are just informative values, because company is using the values which are obtained directly from the parts. More information about the test sample preparation is explained at Appendix II. Tensile strength and hardness values of separate cast test samples are given at Table 5.
Table 5 Tensile strength and hardness values of the test specimens of Ø20 mm.
Tensile strength Hardness
Alloy 1 231 MPa 215 HB
Alloy 2 291 MPa 218 HB
Alloy 3 350 MPa 255 HB
4.2.3 Parts
4.2.3.1 Hardness
Measurements are carried out at SKF Mekan AB’s quality department. Hardness tests are carried out after parts are sand-blasted. Test regions and derived results are shown in Table 6.
Table 6 Hardness results of the parts and measuring positions.
Place 1 2 3 1 2 3 1 2
Hardness Results [HB] (average of samples)
SNL-511 SNL-517 SNLN-3056 208,2 203,4 Alloy 1 227 215,3 209,6 Alloy 2 218,4 Position of the hardness measurements
Place 1 Place 3 Place 2
205,8 204,1
216,9 202,7
208,2 219,9
Figure 58 Hardness results of SNLN-3056 for Alloy-3. In figure B part is sectioned for showing inside of the body.
Accordingly with the lower %C content (or we can say lower CE value) of compositions, hardness results are slightly higher than suggested compositions. Also as a consequent of fair inoculation the parts are very likely to have more undercooled areas. Especially on the SNL-511 with Alloy-1 effects of the fair inoculation is very clear. Furthermore SNL-517 with Alloy-1 is also suffering from undercooling.
Simulation results of microstructural properties are shown in Figure 59 to 63. Table 7 shows the values those are read from hardness measurement position.
A) B)
Figure 60 A) Eutectic cell size B) Lamellar spacing for SNL-517 Alloy-1
A) B)
Figure 61 A) Eutectic cell size B) Lamellar spacing for SNL-517 Alloy-2
A) B)
A) B)
Figure 63 A) Eutectic cell size B) Lamellar spacing for SNL-511 Alloy-2
Table 7 Eutectic cell size and lamellar spacing results of the simulations.
Eutectic Cell Size [mm] Lamellar Spacing [µm]
SNL-511 Alloy-1 0,85 12,8
SNL-511 Alloy-2 0,87 12,9
SNL-517 Alloy-1 1,05 14,8
SNL-517 Alloy-2 1,06 14,9
Figure 64 Chilled area marked on top of the part
a) b)
Figure 65 Chilled areas marked in a) right side bottom b) bottom.
4.2.3.4 Micro-structures
For each alloy, samples are prepared from the areas where the hardness measurements are applied. In order to investigate the formations of the alloys, samples are grinded and polished. In Figure 66 to 68 pictures of the flake distributions are shown.
A) B)
Figure 66 Unetched Alloy 1 for A) SNL-511; B) SNL-517.
A) B)
Figure 67 Unetched Alloy 2 for A) SNL-511; B) SNL-517.
Figure 68 Unetched microstructure of SNLN-3056.
For both of the alloys SNL-517 shows Type A graphite flake distribution (Figure 66-B and 67-B). On the other hand graphite formation of SNL-511 has different distributions (Figure 66-A and 67-A). For alloy 1 graphites distribute in Type E formation and for alloy 2 the distribution is in Type D. Alloy 3 for SNLN-3056 also shows Type A distribution with longer graphite flakes (Figure 68). Further on graphite flake length of the structures are measured (Figure 69 to 71). Findings are shown in Table 8.
A) B)
Figure 69 Graphite flake measurements for SNL-511 A) Alloy-1, B) Alloy-2
A) B)
Figure 70 Graphite flake measurements for SNL-517 A) Alloy-1, B) Alloy-2
Figure 71 Graphite flake measurements for SNLN-3056
For the next step samples are etched with 2% Nital. This step is focused on investigating the lamellar spacing of the pearlites. In figures 72 to 74 microstructures after 2% Nital etching are shown. Measurement of the lamellar spacing is shown in Table 8.
A) B)
Figure 72 Microstructure of Alloy-1 in A) SNL-511, B) SNL-517 etched with
2%Nital.
A) B)
Figure 73 Microstructure of Alloy-1 in A) SNL-511, B) SNL-517 etched with
2%Nital.
Figure 74 Microstructure of Alloy-3 in SNLN-3056 etched with 2%Nital.
Further on parts polished again and etched with 4% Nital. This step is focused on investigating the formation of the microstructure. In the Figures 75 to 77 microstructures after 4% Nital etching are shown.
A) B)
Figure 75 Alloy-1 etched with 4% Nital for A) SNL-511, B) SNL-517.
A) B)
Figure 76 Alloy-2 etched with 4% Nital for A) SNL-511, B) SNL-517.
Figure 77 SNLN-3056 with Alloy 3 after 4% Nital etching.
Investigation of the microstructures revealed that in SNL-511 for both alloys formation of the pearlitic microstructures are not completed due to the undercooling. Cementite is still dispersed all along the coarser pearlite lamellas. Conversely the structures of the SNL-517 have completed pearlitic transformation for both alloys. Free cementite precipitated outside the eutectic cells. On the case of SNLN-3056, the structure also shows fully pearlitic formation.
Finally samples are polished again and this time colour etched with picric acid. The purpose of this etching is to relieve the eutectic cells and count them. Figure 78 to 80 shows the microstructures after colour etching. Eutectic cell count measurements are shown in Table-8.
A) B)
Figure 78 SNL 511 with colour etching for A) Alloy-1, B) Alloy-2.
A) B)
Figure 79 SNL 517 with colour etching for A) Alloy-1, B) Alloy-2.
SNL-511 Alloy-2 62 10,4 0,97 0,18 10 509,1 90,5 SNL-517 Alloy-1 65 14,1 0,8 0,29 7 640,8 35,4 SNL-517 Alloy-2 71,5 18,2 0,74 0,27 7 682,9 76,3 SNLN 3056 168 39 0,45 0,19 5 888,5 134,2
4.3 Analysis
Differences of hardness values between simulation outputs and trial casting are shown in Table 9.
Table 9 Average differences for hardness values of simulation results and real
case results.
Part and alloy average of three Trial casting hardness points Simulation averages Difference between simulation and trial cast values
SNL-511 Alloy-1 217,3 HB 223 2,62%
SNL-511 Alloy-2 212,6 HB 225 5,83%
SNL-517 Alloy-1 206,9 HB 217 4,88%
SNL-517 Alloy-2 212,17 HB 218 2,74%
While interpreting results from Table 9 these issues should be kept in mind:
Simulation values are interpreted individual, and could differ for each person.
Simulations are executed with exact temperature. Contrary trial castings could have different pouring temperatures than the simulated, because the melt temperatures didn’t checked during the pouring process. As the pots are filled directly from induction furnace and didn’t wait for the preparations, we could expect the temperature to be higher at the beginning and lower at the finish. It will be expected that different parts could have different results. Also all the casted samples didn’t checked for their hardness. Last but not least the tested samples could be casted hotter than the supposed simulation value. Sum of all simulation values may be evaluated for 3-4 HB lesser.
Differences of hardness values between real case and simulation outputs are between 2,6% to 7,3%. In case of evaluating the simulation values few HB lesser due to higher pouring temperature, differences could be decreased. Then the resulting variation would become 1% to 5%. There is no relation between the deviations of the findings.
Secondly the hardness results of SNL-511 are decreased for Alloy-2 unlike the simulation projections. This phenomenon could be explained with the microstructure of the parts. MAGMA gives the hardness results for a fully pearlitic formation assumption. However the parts have Type D graphite distribution. Although these are fine graphite forms, they are unformed pearlite structures. Existence of these graphites would lead to differences on the expected results of mechanical properties.
Type E graphite formation of the SNL-511 Alloy-1 is an oriented undercooled formation with finer graphites and expected to have rather similar mechanical properties along the investigated region. However Type D of the SNL-511 Alloy-2 is an unoriented formation and it is very likely to have varying mechanical properties across the part. Fine graphite flakes would cause an increase in the hardness values.
Subsequently on the case of SNL-517 the difference of the results within the alloys are different also. It can be explained with the graphite flakes of the microstructure are longer for the Alloy-1 than the Alloy-2. Shorter and increased amount of graphite flakes improve the hardness at higher ratio. Also the pouring temperatures of the samples might be the case again.
According to the data obtained from the microstructure we can analyse effect of size and chemical composition. Increasing size of the parts helps to
Average Lamellar Spacing [µm] [µm]
Real Simulation Difference Real Simulation Difference
SNL-511 Alloy-1 1,05 12,8 1119% 489,7 850 73% SNL-511 Alloy-2 0,97 12,9 1229% 509,1 870 70% SNL-517 Alloy-1 0,8 14,8 1750% 640,8 1050 63% SNL-517 Alloy-2 0,74 14,9 1913% 682,9 1060 53% SNLN 3056 0,45 24 5233% 888,5 1600 80%
Inspection of Table-10 will show big differences between simulations and real case. Especially on the average lamellar spacing case, there are serious differences. For SNL-511 and SNL-517 simulation values are 10 to 20 times bigger than real case. In case of SNLN-3056 it became 50 times. If we put the numerical values aside, the trend of values are also going in reverse directions. In real case average lamellar spacing values are getting smaller with the increasing size of the parts. However simulation results show an increase in values.
In case of average eutectic cell diameter simulation outputs are still higher than trial cast results, yet the trend is in the same direction. Although the measurements of real case are subjective to the individual, the difference of the individuals still won’t be very different than each other.