JÖNKÖPING UNIVERSITY
Master Thesis within Economics Author: Stela Male
Tutor: Prof. Andreas Stephan Jönköping July 2009
REMITTANCES AND FINANCIAL DEVELOPMENT
i
Master Thesis within Economics
Title: Remittances and financial development. A study of the South-Eastern and Eastern-European countries.
Authors: Stela Male
Tutor: Prof. Andreas Stephan
Date: Jönköping, June 2009
Subject terms: Remittances, financial development, Eastern-European coun-tries
Abstract
Remittances were calculated to be approximately $318 billion in 2007, which is an increase of three times the amount of $102 billion in 1995, having these funds to become the sec-ond largest type of flows after foreign direct investment. The South-Eastern and Eastern-European countries welcomed 12% of the world’s remittances inflows in 2007, totalling $37 billion.
The impact of remittances on financial development of the South-Eastern and Eastern-European countries for the period 1994 – 2007 is studied and it is examined whether these funds contribute to increasing the aggregate level of deposits and credits intermediated by the local banking sector. Financial development is measured in two ways, either as bank deposits or as bank credits to private investors.
In order to analyze this effect panel data analysis is performed. Fixed effect regressions are performed to test for the effect of remittances on bank deposits and bank credits to private investors. The findings indicate that remittances have a robust positive effect on promoting financial development in South-Eastern and Eastern-European countries. It is observed that the effect on bank deposits is less robust than the effect on bank credits to private in-vestors.
ii
Table of Contents
1 Introduction ... 1
2
Theoritical framework ... 4
2.1 Previous studies ... 4
2.2 The South-Eastern and Eastern-European countries ... 7
2.3 Summary ... 8
3
Empirical Analysis ... 9
3.1 Empirial methodology ... 9 3.2 Data ... 124
Empirical Results ... 15
4.1 Descriptive Statistics ... 154.2 Financial development measured as bank deposits ... 18
4.3 Financial development measured as bank credits ... 19
5
Conclusions ... 21
6 References ... 22
Appendix ... 25
Data for remittances, bank deposits and bank credits ... Table 1 Data for Albania ... 25
Table 2 Data for Belarus ... 25
Table 3 Data for Bosnia and Herzegovina ... 26
Table 4 Data for Bulgaria ... 26
Table 5 Data for Croatia ... 27
Table 6 Data for Czech Republic ... 27
Table 7 Data for Estonia ... 28
Table 8 Data for Hungary ... 28
Table 9 Data for Latvia ... 29
Table 10 Data for Lithuania ... 29
Table 11 Data for Macedonia ... 30
Table 12 Data for Moldova ... 30
Table 13 Data for Poland ... 31
Table 14 Data for Romania ... 31
Table 15 Data for Russian Federation ... 32
Table 16 Data for Serbia ... 32
iii
1
1
Introduction
Does finance make a difference . . .? Raymond Goldsmith (1969, p. 408)
Remittances (money transfers sent from migrants working abroad to their home country) were calculated to be approximately $318 billion in 2007, which is an increase of three times the amount of $102 billion in 1995 (World Bank, 2008). In 2007, the developing countries welcomed the $240 billion, which was twice the amount of foreign aid and two-thirds the amount of the foreign direct investments into developing countries (World Bank, 2008). The South-Eastern and Eastern-European countries welcomed 12% of the world’s remittances inflows in 2007, totalling $37 billion.
The high and increasing volume of remittances has caused researchers to analyze the effect on growth (Giuliano and Ruiz-Arranz, 2005), development (Chami et al, 2003), education (Cox and Ureta, 2003; Yang 2005; Hanson and Woodruff,2003), promoting entrepreneurship (Maimbo and Ratha, 2005; Yang, 2005), poverty reduction (Maibo and Ratha, 2005; Adams, 2004; Lopez-Cordova, 2005), infant mortality (Kanaiaupuni and Donato, 1999; Lopez-Lopez-Cordova,2005), trans-action costs (Freud and Spatafora, 2005), but few studies have been conducted on the effect of remittances on financial development of receiving countries. Aggarwal et.al (2006) concluded in their study that remittances have a positive effect on financial development of the countries re-ceiving said funds through increasing aggregate level of bank deposits and bank credits to private investors.
This raises the question: Do remittances have any effect on the financial development of country receiving these funds? In order to answer this question, this master thesis tries to fill a gap in the literature through investigating the relation of remittances and financial development in South-Eastern and South-Eastern-European countries from year 1994 – 2007.
Exactly how remittances might affect financial development is unclear. The thought that remit-tances can spur financial success in developing countries comes from the idea that money trans-ferred through financial institutions creates an avenue for recipients to gain access to other fi-nancial products and services they previously might not have been able to access (Orozco and Fedewa, 2005). At the same time, providing these remittance transfer services allows the banks
2 to learn more about the recipients who otherwise would not be in the banking system at all or at the very most have a limited financial history.
But due to high transaction costs, lack of financial education, and exchange rate restrictions, around 54% of recorded remittances are sent through informal channels (Freud and Spatafora, 2005)1. Furthermore, because remittances are typically not steady in amount, recipients might need to acquire financial products which allow for these funds to be stored safely in bank depo-sits, even if the bulk of these funds were not processed through the banks they are deposited in. This can affect credit marker development positively (Aggarwal at. al, 2006). Remittances might have the opposite effect on the credit market as well; households that receive their remittances through banks have an even larger potential to learn about and demand other bank products. On the other hand, remittances may help relax individuals’ financing constraints, which may lead to a lower demand for credit and have the opposite effect on the credit market (Aggarwal at al., 2006). A rise in remittances may not translate into an increase in credit to the private sector if these cash flows are instead channeled to finance the government or if banks are reluctant to lend and prefer to hold only liquid assets2. Finally, the bank deposits may not increase if remit-tances are immediately consumed or if the recipients distrust the financial institutions and choose to retrieve their funds and save them in other ways.
The effect of remittances on economic growth depends upon the financial development level of the receiving countries. Remittances bring economic growth to countries that have a less devel-oped financial system. This inflow helps smooth the liquidity constraints and create an alterna-tive way of financing investments (Giuliano and Ruiz-Arranz, 2005). The investment returns might be deposited in banks and in the same time allocated to other investors in form of bank credits, having a positive effect on the credit market.
Freund and Spatafora (2005) concluded that remittances flow varies from the number of mi-grants and transaction costs. The study showed that an increase in the number of people migrat-ing in Organization for Economic Co-operation and Development (OECD) countries was asso-ciated with an increase in the remittance flow. Transaction costs (fees paid in a bank office or to a money operator from the migrant to send money in the country of origin) have an impact on the amount and the way remittances are transferred. High transaction costs may keep migrants
1 Celent (2002) estimated that 54 % of total recorded remittances are sent through informal channels.
3 from remitting or push them into using the informal channels of money transfer. The study con-cluded that one percentage reduction in transaction costs would increase money transfer through formal channels by 14-23%.
Financial development is defined as “the factors, policies, and institutions that lead to effective financial in-termediation and markets, and deep and broad access to capital and financial services” (World Economic
Re-port, World Bank, 2008). To examine the effect of remittances on financial development, it needs to be measured empirically. King and Levine (1993) constructed four ways of measuring financial development, as the share of: (i) liquid liabilities to GDP, (ii) bank deposits to GDP, (iii) bank credits to private non-financial firms to the total amount of bank credits, (iv)bank credits to
private investors to GDP. For the purpose of this paper when running the estimations absolute
values of remittances, bank deposits and bank credits are used instead of ratio specification in order to avoid spurious correlations just by movements in GDP.
Data for remittances and current GDPs were collected from World Bank Indicators (World Bank), bank deposits’ and bank credits’ data were collected from the Balance of Payments Statis-tics (IMF). The relationship between remittances and financial development was tested by run-ning fixed effect regressions. The estimations were run twice in order to check for the effect of remittances on bank deposits and bank credits. In both estimations, country-specific and time-effects are controlled for. It is known in the literature, measuring and properly identifying remit-tances can be a problem. Remittance transferred through informal channels (De Lunz Martinez, 2005) lead to measurement errors and omitted factors because of the difficulties in identifying what is considered as remittances. This leads to indignity biases, which affects the relationship between remittances and financial development. In order to run the regressions the problem of indignity biases arising from measurement errors in remittances data should be ignored. Results showed that remittances have a significant positive effect on the financial development of the countries receiving said funds. The positive effect of remittances on bank deposits is less robust than their effect on bank credits to private investors.
The thesis is organized as follows: chapter two gives a brief overview of previous research on remittances and financial development and explains the importance of the study; chapter three explains the empirical methodology used and presents the data, the way they are calculated and the problems consisting gathering and definitions; chapter four analysis the empirical results; fi-nally, chapter five concludes.
4
2
Theoritical framework
2.1 Previous Studies
The increasing volume of remittances has attracted various studies in the last decades. It is im-portant to understand why migrants send money back home. Stark and Bloom (1985) presented the altruistic motive for remitting. Poverty is the reason why people emigrate and send back home money to help their families left behind. Lucas and Stark (1985) wrote that “Certainly the
most obvious motive for remitting is pure altruism-the care of a migrant for those left behind. Indeed, this appears to be the single notion underlying much of the remittance literature”.
According to Lucas and Stark (1985), Stark and Bloom (1985), Stark and Lucas (1988), Poirine (1997), Solimano (2003), Gubert (2002), Aggarwal and Horowitz (2002) there are four reasons why migrants send money back home: (i) The altruistic motive, (ii) The self-interest motive, (iii) The Loan Repayment motive, and (iv) The co-insurance motive.
(i) The altruistic motive
In most of the cases migration takes place for economic reasons. Migrants earn a higher per ca-pita wage in the host country than workers do in home country. This is the reason why they send money back home to support the family left behind. The remittances will decrease over time be-cause migrants either loose the relation with the family or bring the family abroad as well.
(ii) The self-interest motive
This is the opposite of the altruistic motive. The center of the migrant interest is his economic well-being. While working abroad a part of the increased income is saved. The money saved is invested in home country where the risk is higher compared with the host country but the return is higher as well. The migrant uses the family as a trusted agent in taking care of his investments back home.
(iii) The Loan Repayment motive
There is an unsigned contract between the family and the migrant. The family invests in the edu-cation and settling down of the migrant in the host country. Once the migrant is integrated in the new society and in the labor market, the income raises over time. The migrant saves and pays
5 back the investment to the family in the form of remittances. Compared with the altruistic mo-tive, remittances do not have to diminish over time.
(iv) The co-insurance motive
Migration can be seen as a co-insurance strategy between the family and the migrant where re-mittances are considered the premium. Migrant supports the family in difficult financial times sending money to help them with consumption, education and other necessities. Meantime, when the economic risk in the host country is high the migrant can turn into his family for fi-nancial and spiritual support.
Faini (2002) argues the relation between migration, education, and remittances. He concluded that skilled migration is combined with a low level of remittances and associated with the prob-lem of brain drain. High skilled individuals migrate for getting a better and more competitive ter-tiary education in the host country, with a chance to integrate in the society and labor market. This can lead to two different scenarios which can occur over a number of years. In the first sce-nario, the migrants may bring the family in the host country where they have settled down, rein-forcing the conclusions of Faini (2002) of the presence of brain drain in the home country and a decreasing level of remittances. The second scenario is that migrants decide to return home hav-ing as asset the education and skilled earned abroad. This case can be considered as a brain gain for the home country and the productive skills and education earned are a good chance for the positive impact on the economic growth of the home country.
Freund and Spatafora (2007) studied the relation between remittances and transaction costs. They concluded that remittances are influenced by the number of migrants, transaction costs and financial development of the receiving country. A higher number of migrants lead to a higher vo-lume of remittances. They found out that remittances are negatively correlated with the transac-tion costs which are lower in more financial developed countries for only one percent reductransac-tion in transaction costs there is an increase of 14-23% in remittances. Due to high transaction costs in developing countries, remittances are sent through informal channels. Celent (2002) calculated that informal remittances would be 35% of the total remittances, or 54% of the recorded remit-tances in 2006. Freund and Spatafora (2007) concluded that the more financial developed a country is, the lower the transaction costs are and the higher the remittances volume transferred via formal channels are. Remittances have the tendency to increase in times of economic
prob-6 lems, helping families to cope with the more difficult economic situation (Yang, 2006). Earlier studies argue that the effect of remittances on economic growth depends upon the level of fi-nancial development of the country, but a few studies have based their research on the boosting effect of remittances on financial development. Giuliano and Ruiz-Arranz (2005) conducted a search on a number of developing countries during the period 1975-2002 in order to test the re-lationship between remittances, financial development3 and growth. The effect of remittances on economic growth was estimated by ordinary least squares and it was controlled for inflation, openness to international trade, human capital, and investment ratio and population growth. These results showed that remittances have a positive effect on the economic growth on the countries receiving said funds and that openness to international trade, human capital, invest-ment ratio were positively correlated to the economic growth, while inflation had a negative rela-tion with the latter. The research goes deeper on finding what role does financial development play in the effect of remittances on economic growth. Estimating the effect financial develop-ment might have on the relation between remittances and economic growth there were used two econometric techniques, ordinary least squares and fixed effects. The results of the estimations showed that the effect of remittances on the economic growth of the receiving countries depend on the level of financial development of the countries receiving these funds. It was concluded that remittances enhance growth in countries with a under development financial system because remittances offer an alternative way of finding monetary funds, which are used to finance in-vestments in countries where access to capital is very low. Mundaca (2005) tested the effect of remittances and financial intermediation on economic growth using a panel data for Central American countries and arrived at another conclusion. An estimation of the effect that remit-tances have on economic growth and controlled for fixed time and as well the long-run invest-ments and demographic variables by using the ordinary least squares and fixed effects equations in order to test the relationship and any financial intermediation it might have.. The results of the analyses showed that remittances have a positive effect on economic growth of the countries with a higher level of financial development because financial development opens the door to a better use of remittance flows which enhances growth.
3 Giuliano and Ruiz-Arranz (2005) have used four different proxies to measure financial development; (i) liquid
lia-bilities of the financial system, (ii) the share of bank deposits to GDP, (iii) loans to the private sector, (iv) the share of bank credit to private investors to GDP.
7 Another recent study by Aggarwal et.al, (2006) was conducted using a panel of 99 countries dur-ing the period 1970 - 2002 in order to test for the effect of remittances on financial develop-ment4. The relationship was tested by running ordinary least squares, fixed effects and random effects equations. These results showed that remittances have a positive effect on financial de-velopment measured as the ratio of bank deposits to GDP on the receiving countries of said funds. So a one percentage increase in the share of remittances to GDP is reflected in an in-crease in the share of deposits to GDP varying from 0.2 to 1.7 percent. The effect of remittances on bank credits is less robust, varying from 0.2 to 0.8 percentage increase in the share of bank credits to private investors to GDP as a response of a one percentage increase in the share of remittances to GDP. The positive effect of remittances on bank deposits indicates that the funds sent from migrants either through formal or informal channels are saved in bank deposits, while the weaker result to bank credits might be explained with the decreasing demand for loans due to having more monetary funds available sent by migrants. It was controlled for a number of va-riables known from the literature for their effect on financial development. This study pointed out that the country size, the level of financial development, the improvement of creditor rights and the domestic liberalization help in advancing financial development, while inflation and mul-tiple exchange rate agreement had a negative influence in the financial development.
2.2 The South-Eastern and Eastern-European countries
The countries included in my study consists of Albania, Belarus, Bosnia and Herzegovina, Bul-garia, Croatia, the Czech Republic, Estonia, Hungary, Latvia, Lithuania, the former Yugoslav Re-public of Macedonia, Moldova, Poland, Romania, Russia, Serbia, Ukraine. The reason I chose these countries is to observe the difference in their economies after the transition from com-munism to democratic states. A large portion of the population has migrated from these coun-tries. The different motives for migration have been from political, conflicts, violence, civil wars, human rights abuses, and political freedom to economic motives such as, poverty, unemploy-ment, lack of basic health and education to social and cultural motives such as discrimination based on ethnicity, gender and religion. Migration plays an important role in the function of the economies of the Eastern-European countries since a great deal of the world’s international mi-gration flows directly from and to these countries. The motivation of migrants is driven primarily
4 Aggarwal et al,(2006) have used two different proxies on measuring financial development; (i) the share of bank
8
by their perceptions of the differences in the quality of life and/or availability of employment in two separate geographical locations. Over time, such perceptions as these have changed in coun-tries of the East-Europe. In the aftermath of forced transition from Russia, migration was in-spired not only by general motivations, but also by the natural desire to remove oneself from conflict and/or return to one’s ethnic homelands. When most of the Diaspora migration was completed and security risks began to lessen, the flow of migration also began to return to a normal state, again being motivated by issues such as income, employment, and quality of life. Many of the trends of motivation for migration in the Eastern-European region are similar to those found in other countries and regions. However, many of the migration trends that have occurred in recent history (since 1990) are specifically distinctive to East-Europe. This is mostly due to the circumstances of economic transition, political and social liberalization, and the sepa-ration of federal states. After the breakup of the Soviet Union, many new countries were created leading to a up flow of migrants. These new migrants were known as “statistical migrants”: long-term, foreign-born residents who were not physically moved, but nevertheless called migrants under the United Nation’s practices of defining a migrant as “a person living outside his or her country of birth”.
2.3 Summary
This master thesis is an effort to add information to the literature on South-Eastern and Eastern-European countries on the effect remittances might have on the development of financial sector. There are three important reasons why this study is performed.
South-Eastern and Eastern-European countries are a major recipient of remitances. They
wel-comed $37 billion, accounting for 12% of the world’s remittances in 2007.
The countries studied have suffered the transition from communism to democratic states, mov-ing from centralized to market economies. It is interestmov-ing to analyze if these huge in-flow funds might have any positive effect on the development of the financial sector these countries studied are facing.
There are a few recent studies analyzing the effect remittances have on the financial development of the receiving countries, but none of these studies has based their research on the Eastern Eu-ropean countries. This lack of a specific study that analyzes the effect of these huge in-flow funds on the financial development of Eastern European countries was the motivation on doing this research.
9
This chapter includes two parts. The first part is a description of the empirical strategy used. It is followed by the presentation of the data collection and problems arising from properly identifying and correctly recording data.
3.1
Empirical Methodology
In this thesis it is tested the effect remittances might have on financial development of a panel of 17 countries of South-Eastern and Eastern Europe for the years 1994 – 2007. The model can be written as: t i t i t i t i REM X u FD, ) 0 1log( , ) 2log( , ) , log( (1) Where: t
FDi, Financial development
t
REMi, The absolute value of remittances for all countries for each specific year
t
Xi, This matrix takes different values presenting the control variables, time and country size.
0
Constant term
1
Regression coefficient for independent variable (REM)
2
Regression coefficient for dummy country size t i t i t i
u, , , Where the first component is the unobserved individual specific effect and the latter is the remainder disturbance
t Refers to the time period from 1994 to 2007
i Refers to the countries studied
The effect remittances might have on financial development is tested by estimating equation (1) by running fixed effects regressions. When using a fixed effect model the error term is composed as the sum of two components,ui,t i,t i,t where the first component presents fixed para-meters to be estimated and the second component presents independent and identically distri-butes error terms with zero mean and constant variance, IID (0, σ²). The explanatory variable (remittances) is assumed to be independent of the error termi,t, (Baltagi, 2008).
10 In this study there is used the fixed effect model compared with the random effect model, be-cause the first model is more useful when the study deals with not a large number of countries (17 countries in this study), according to Baltagi, (2008). In the estimations it is observed that the correlation between the fixed effects and the explanatory variable is different from zero (0,1558 in the case of bank credits a 0,3704 in the case of bank deposits) which confirms again the ap-propriate use of the fixed effects model.
The matrix X takes two different set of variables, one is country size and the other is time. The literature ( Alggarwal et. Al, 2005) has shown that country size and time effect the financial de-velopment of a country. Country size is measured as the log of GDP in US dollars for each country for the time period studied. The development of financial sector calls for fixed costs payments which are irrelevant for the larger sized economies. The development of the financial sector cannot happen within a year, but it requires a number of years making it important to con-trol for time effect in the estimations as well. When examining the effect of remittances on fi-nancial development, equation (1) is estimated twice, once for testing the effect remittances might have on bank deposits and second their effect on bank credits to private investors. In both cases it is controlled for country size and time.
The literature has shown certain benefits from using panel data analysis compared with cross-sectional and time series analysis.
Controlling for individual heterogeneity. Panel data consider firms, states, countries as hete-rogeneous (see Baltagi, 2008), while cross-section and time series analysis does not test for heterogeneity bearing the risk of endogeneity biases (Moulton, 1986). When working with remittances one should bear in mind the possibility of endogeneity biases caused by measur-ing errors and omitted variables. Freud and Spatafora (2005) concluded in their research that the unrecorded remittances5 vary from 20 to 200 percent of the recorded remittances. Another problem that occurs with remittances data is the difficulty on properly identifying what in-flow funds are considered as remittances. Sometimes it is not clear for the commer-cial banks what funds to record under workers’ remittances and what in-flow funds are con-sidered as compensation of employees. The goods transported with the migrant who should be recorded under migrants’ transfers in most of the cases are very difficult or impossible to
11 be measured and for this reason they are omitted from being considered as remittances. In order to empirically examine the relationship between remittances and financial development the biases problem arising from omitting factors and measurement errors should be ignored. Panel data gives more detailed information, less co linearity between the variables and higher
degree of freedom. Time series are disturbed by multi co linearity, but adding cross-section data will obviously add more variability and specific data information which will lead to less co linearity.
Panel data are used to study dynamics of change on the variables studied. The use of cross-section data in this thesis would cause one to find the effect remittances might have on fi-nancial development at a given point in time. While time series data would test the relation-ship over time, but for only one specific country. Thus to test changes over time for a num-ber of countries panel data analysis is used.
Panel data allows for tests for more complicated problems than cross- section or time-series data do. Hsiao (2003) explained that few restrictions can be put on lag distributed models, compared with simply time-series model. Panel data studies are associated with some limita-tions as well.
Data collection problem. There have been some observed problems when collecting and managing the data (Kasprzyk et al., 1989) which consist of incomplete and inconsistency or frequency in the collection of the data collection. This problem is observed in the thesis where data for bank credits and bank deposits were missing for Bosnia and Herzegovina and Lithuania, while remittances data were collected and published for both countries for the pe-riod studied.
Measurement errors. Problems during the panel data analysis might occur from the missing information. Sometimes omitted or misreported data can be a sign of concern as in the case of remittances where the data recorded and published by the authorities are extremely differ-ent from the real data.
The high cost of gathering, processing, managing and publishing data. The obvious question that rises is the question: “Why having such data?” Important studies run for macroeconom-ic factors need data from a large number of countries, for a long period of time. It is easily
12 understandable that financial development cannot change within a year or from one year to another. For studies to be conclusive it takes a long period of time with a large amount of data collected before studies can be conclusive. These important economic studies are consi-dered as the pay off for the high cost of panel data collection.
Listing the benefits and problems that one could face while working with panel data, it is wise to understand that panel data analysis will not solve all the difficulties met during analyzing cross-section or time series data (Baltagi, 2008).
3.2 Data
The literature is not clear enough on what is considered to be remittances, but according to IMF6 they are calculated as the sum of workers’ remittances (money transfers from migrants residing in another country for more than one year), compensation of employees (wages, salaries and other work benefits earned from migrants residing abroad less than one year) and migrants’ transfers (items transferred together with the migrant from one country to another). In this pa-per, remittances are considered as the sum of the three components mentioned above. UNDP7 defines migrants as those who reside in another country other than their country of origin for more than one year as residents. The money transfers they send back home are considered as workers’ remittances. Migrants that reside in a host country more than three months, but less than one year, are considered non-resident migrants and the money transfers they send in the country of origin are considered as compensation of employees. In compensation of employees are calculated wages, salaries and other benefits from the work. All the other items and goods moving together with the migrant from one country to another are considered as migrant trans-fers (IMF). Funds transferred from the host to the home country move in three phases. The first phase is when the migrant working abroad goes to the bank office or money transfer operator to send a part of his savings to the home country. The second phase is when the money is trans-ferred from one country to another. The final phase is when the recipient in the home country receives the funds in the bank or money operator office (de Luna Martinez, 2005). Remittances data were collected from World Bank Indicators (World Bank) for 17 countries of South-Eastern and East-Europe from year 1994 to 2007. Financial development is measured either as the ratio
6 IMF stands for International Monetary Fund
13 of bank deposits to GDP or as the ratio of bank credits to the private sector to GDP (King and Levine, 1993). For the purpose of this paper when running the estimations absolute values of remittances, bank deposits and bank credits instead of ratio specification in order to avoid spu-rious correlations just by movements in GDP. Data for bank deposits and bank credits are col-lected in national currency from Balance of Payment Statistics (IMF). Bosnia and Herzegovina and Lithuania do not have such data reported in Balance of Payments Statistics, IMF; however they are large recipients of remittances.
With the increasing number of banking services and products it has become increasing difficult for the banks to identify correctly which money transfers are considered as remittances. Should banks consider the remittances of workers or should they include the compensation of em-ployees and migrant transfers as well?
International Monetary Fund, World Bank, United Nations with the participation of G-8 Coun-tries has been working since 2004 to in improve remittance data collection. The group, known as “Luxembourg Group” has arrived at the conclusion that three other new components: personal remittances, total remittances and transfers to nonprofit institutions serving households should be added to the Balance of Payments Statists in calculating the remittances flows ( World Bank, 2008). However, at the time this master thesis was written the only way remittances are calcu-lated is as the sum of workers’ remittances, compensation of employees and migrants’ transfers, (Balance of Payments Statistics, IMF).
In a survey covering 40 countries (De Luna Martinez, 2005) it was observed that 90% of the cen-tral banks recorded remittances’ transfers only through commercial banks, ignoring the flows transferred through non-bank financial institutions-like money operators or money transferred physically by migrants themselves. These informal flows pointed out the increasing problem that remittances data collected and presented in the balance of payments by central banks8 do not show the real value (De Luna Martinez, 2005). In fact, Celent (2002) estimated the value of in-formal remittances in 2006 to be around 54 % of the recorded remittance flows. Market
8 Remittances transferred through banks are recorded by commercial banks under three accounts; workers’
remit-tances, compensation to employees and migrant transfers. Central Banks collect remittances data from commercial banks and record the in-flows in the balance of payments. IMF, International Monetary Fund collects remittances data from the central banks of each country and presents yearly data in the International Financial Statistics in na-tional currency.
14 ers had come to the conclusion that informal remittances flows vary from 50% to 250% of the recorded flows (Freud and Spatafora, 2005). The way remittances are send depends on transac-tion costs. High transactransac-tion costs make migrants send funds home through informal channels, reducing the recorded amount of remittances. Thus transaction costs interfere in the way remit-tances are sent and not in the amount sent (Freud and Spatafora, 2005). The total remitremit-tances transaction cost calculated as the sum of the fees sender and beneficiary pays and the cost arising from exchanging rates (De Martinez, 2005) is presented on the Figure 3.1.
Figure 3.1
1 2 3
Cost
= + + +Set at Country of Origin Set at Recipient Country (Source: De Luna Martinez, 2005)
Statistical institutions are responsible for collecting and presenting accurate values of remittance flows (de Luna Martinez, 2005), as these data can be used to encourage new international banks to enter in the banking system offering new and improved services for the senders and recipients of remittances (Raul Hernandez-Cuss, 2004).
Fee that Beneficiary Pays Pays Exchange Rate Spread Fee that Sender Pays
15
4
Empirical Results
4.1
Descriptive Statistics
This paragraph shows how remittances and financial development have changed during the years for all the countries studied. The top five remittance recipient countries in absolute values are Ukraine ($ U.S. 107,753 billion), Lithuania ($ U.S. 29,759 billion), Poland ($ 8,496 billion), Ro-mania ($ U.S. 6,717 billion), Serbia ($ U.S. 4,703 billion).Figure 4.1.1 shows the average value of remittances for the period 1994-2007 for each specific country studied.
Figure 4.1.1 Remittance Recipients (in billions of USD)for 1994-2007 (Average value)
Source: World Bank Indicators, World Bank. Graph made by author
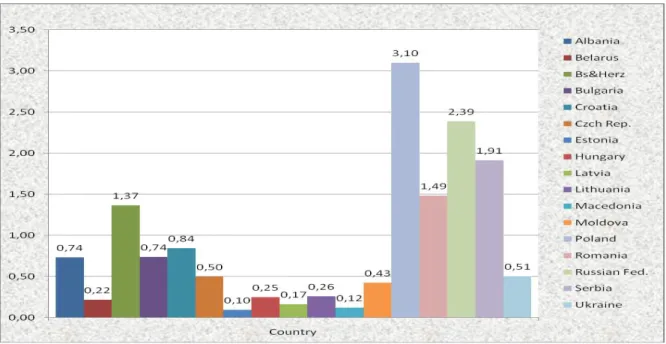
Remittances as a percentage of GDP are higher in low-income countries, like Bosnia and Herze-govina where 49.74% of the country GDP was composed by remittances in year 1998. It is fol-lowed by Moldova with 34.67% in year 2006, Albania with 18.47% in year 1998 and folfol-lowed by Serbia with 17.75% in year 2005. Remittances value as a share of GDP for all the countries stu-died during the period 1994-2007 are presented for each specific country in the tables in appen-dix, while figure 4.1.2 shows graphically the average value of the share of remittances to GDP for each specific country.
16 Figure 4.1.2 Remittance Recipients (in % of GDP) for 1994-2007 (Average value)
Source: World Bank Indicators, World Bank. Graph made by author
There was observed variation in the financial development measured with the ratio of deposits to GDP ranging from 0.7% (Serbia in year 1999) to 72% (the case of Bulgaria in 1994). The average value of the share of bank deposits to GDP is shown graphically in Figure 4.1.3.
Figure 4.1.3 Bank deposits (in % of GDP) for 1994-2007 (Average value)
17 Financial development measured with the ratio of bank credits to GDP varies from 1.38% (Ukraine in 1996) to 96% (Estonia 2007). The average value of the share of bank credits to GDP is shown graphically in Figure 4.1.4.
Figure 4.1.4 Bank credits (in % of GDP) for 1994-2007 (Average value)
Source: World Bank Indicators, World Bank. Graph made by author
The very low deposit values as a percentage of GDP in Serbia during year 1999 were as the con-sequence of the last war in Balkans for the independency of Kosovo. A study performed by World Bank Institute has concluded that Ukraine during year 1996 had low levels of governance indicators like political stability of 38 %, government effectiveness of 22% and the rule of law only 35% being the reasons of the very low values of bank credits to private investors as a per-centage of GDP.
18
4.2 Financial development measured as bank deposits
In this section, I present the results from the estimation of the following model:
t i t i t i t i REM X u t
BankDeposi , ) 0 1log( , ) 2log( , ) ,
log( (2)
Fixed effects estimations of regression equation (2) examined the effect of remittances on bank deposits. For this fixed effect estimation the size of the country, the time it has to develop finan-cially is controlled. The estimations of equation (2) showed that remittances have a significant positive impact on bank deposits on the country receiving said funds on five percent significance level (please check correlation coefficient and p-values on Table 4.2). A one percentage increase in the value of remittances is associated with an increase by 0.49 percentages in the value of bank deposits, compared with a very robust positive effect on the previous study of Aggarwal et. al (2005), where one percentage increase in remittances leads to 1.7 percentage increase in the bank deposits. Fixed effects Log of Remittances 0,4949 [6,33]** Log of GDP -0,0733 [9,39]** Constant -364,8659 [7,83]** Observations 147 Number of countries 13 Adjusted R-squared 0,7133 P-Value <0.0001
** t-value is significant at 0.05 level.
Table 4.2 The impact of remittances on bank deposits, fixed effects estimates
Referring to the control variables, it is observed a positive effect of time on financial develop-ment confirmed the results from the previous study of the same type of Aggarwal et al. (2006), meaning that it needs a certain number of years for a country to develop financially. A significant
19 negative effect of the country size on the level of financial development concluded from this thesis is in contradiction with the findings of previous studies of Djankov et al. (2005) and Ag-garwal et al. (2006), studies that confirmed a positive effect of country size on the level of finan-cial development of the countries receiving remittances. This negative effect concluded in the thesis, shows that the cost of developing the financial sector in is relevant to the size of econo-mies in Southern-Eastern and Eastern European countries.
4.3 Financial development measured as bank credits
In this section, I present the results from the estimation of the following model: t i t i t i t i REM X u
BankCredit, ) 0 1log( , ) 2log( , ) ,
log( (3)
Fixed effects estimations on regression equation 3 examined the effect of remittances on bank credits to private investors. The results from estimations showed that remittances have a signifi-cant positive effect on the bank credits of the country receiving remittances on five percent sig-nificance level, (please check correlation coefficient and p-values on Table 4.3). One percentage increase in the value of remittances is associated with an increase by 0.66 percentages in the value of bank credits, comparing with the results of the previous study of Aggarwal et.al, (2005) where bank deposits are increased by 0.8 percentages following one percentage increase in remittances.
Fixed effects Log of Remittances 0,6624 [2,65]** Log of GDP -0,0796 [4,37]** Constant -341,5179 [2,58]** Observations 145 Number of countries 13 Adjusted R-squared 0,6297 P-Value <0.0001
** t-value is significant at 0.05 level
20 Referring to the control variables it is observed exactly the same results as from the case when financial development was measured by bank deposits. Country size has a negative effect on bank credits while time plays a positive role, confirming the results from previous studies (Alg-garwal et.al, 2005) that it needs a certain number of years for the financial sector to develop. The relationship of remittances and financial development was examined by fixed effects regres-sions. The results confirmed the significant positive effect of remittances on financial develop-ment of the countries receiving said funds, confirming the results achieved from the previous study of the same type of Aggarwal et.al, (2006). The difference with the latter study is that while Aggarwal et. al, (2006) concluded that remittances have a less robust effect on bank credits to private investors then to bank deposits. This thesis concluded that the positive effect of remit-tances on financial development when the latter is measured by bank deposits is less robust than when it is measured by bank credits to private investors. Indeed the effect of remittances on bank credits is higher (0.6624) than the one with bank deposits (0.4949).
21
5
Conclusions
Remittances, funds received from migrants working abroad, were calculated to be approximately $318 billion in 2007, which is an increase of three times the amount of $102 billion in 1995. The South-Eastern and Eastern-European countries welcomed 12% of the world’s remittances in-flows in 2007, calculating for $37 billion. Different researchers have studied the effect of remit-tances on consumption, reducing poverty, the effect on boosting economic growth of the receiv-ing countries, but lately it is increased the interest of researchers on studyreceiv-ing the effect remit-tances might have on the development of the financial sector. There are a few studies conducted on the effect remittances have on the financial development, but to the best of my knowledge no one has studied this relationship for the case of South- Eastern and Eastern European countries before.
This thesis investigates the effect remittances might have on financial development of South-Eastern and East European countries from 1994-2007. The highest level of remittances was ob-served in Ukraine ($ U.S. 107,753 billion), Lithuania ($ U.S. 29,759 billion), Poland ($ 8,496 bil-lion), Romania ($ U.S. 6,717 bilbil-lion), Serbia ($ U.S. 4,703 bilbil-lion), while in the low-income coun-tries remittances accounted from 20% to 50% of the country’s GDP. For an example: Remit-tances in Bosnia and Herzegovina accounted for the half of the country’s GDP, having these funds play a very crucial role in the domestic economy. Financial development has a high va-riance, measuring from 0.7 % to 72% in the case of the share of bank deposits to GDP and from 1.38% to 96% as the share of bank credits to private investors to GDP.
The panel data collected from World Bank Indicators (World Bank) and Balance of Payments Statistics (IMF) were used and fixed effects regressions performed in order to examine the effect of remittances on financial development, the latter measured as bank deposits and bank credits to private investors. In the two estimations country size and time effects are controlled for. The results of the estimations showed a positive effect of remittances on financial development. One percentage increase in remittances leads to 0.49 percentage increase in the bank deposits value and 0.66 percentage increase in the bank credits value. The effect remittances have on bank deposits is less robust than their effect on bank credits to private investors.
22
6 References
Academic articles:
Adams, R., (2004). “Remittances and Poverty in Guatemala”. World Bank Policy Research Working
Paper 3418.
Adams, R. and Page, J.,( 2003). “International Migration, Remittances and Poverty in Developing Countries.” World Bank Policy Research Working Paper 3179.
Aggarwal, R., Demirguc-Kunt, A., and Martinez Peria, M.S.,( 2006). “Do Workers’ Remittances Promote Financial Development?” World Bank Policy Research Working Paper 3957.
Aggarwal, R., and Horowitz, A., “Are International Remittances Altruism or Insurance? (2002)Evidence from Guyana Using Multiple-Migrant Households.” World Development, 30, 2033-2044.
Beck, Th., Demirguc-Kunt., A.,and Levine R, (2004). “Finance, Inequality and Poverty: Cross-country Evidence.” NBER Working Paper 10979.
Beine, M., Docquier, F., and Rapoport, H, (2001). Brain Drain and Economic Growth: Theory and Evidence. Journal of Development Economics, 64(1), 275-289.
Chami, R., Connel, F., and Samir, J.,(2003). “Are Immigrant Remittance Flows a Source of Capi-tal for Development.” Internationa Monetary Fund Working Papers 03/189.
Cox, E., Ureta, M.,(2003). “International Migration, Remittances and Schooling: Evidence from El Salvador.” Journal of Development Economics 72, 429-61.
De Luna Martinez, J., (2005).”Workers’ Remittances to Developing Countries. Findings of a Survey with Central Banks on Select Public Policy Issues.” World Bank Mimeo.
Duryea, S., Lopez-Cordova, E., and Olmedo, A., (2005). “ Migrant Remittances and Infant Mor-tality: Evidence from Mexico” Mimeo. Inter-American Development Bank.
Freud, C., and Spatafora, N., (2005). “Remittances: Transaction Costs, Determinants and Infor-mal Flows.” World Bank Policy Research Working Paper 3704.
Giuliano, P., and Ruiz-Arranz, M., (2005). “Remittances, Financial Development and Growth.”
International Monetary Fund Working Paper 05/234.
Goldsmith, R., (1969). Financial Structure and Development. New Haven, CT: Yale U.Press.
North, D., (1990). Institutions, Institutional Change and Economic Performance. First Edition. Cam-bridge University Press.
23 Gubert, F., (2002). “Do Migrants Insure Those who Stay Behind? Evidence from The Kayes Area (Western Mali)”. Oxford Development Studies, Taylor and Francis Journals, vol 30(3).
Johnson, G.E., and Whitelaw, W.E., (1974). “Urban-Rural Income Transfers in Kenya: An Esti-mated-Remittances Function.” 1974. Journal of Economic Development and Cultural Change. P.473-79. Kanaiaupuni, Sh., and Donato, K., (1999). “Migradollars and Mortality: The Effects of Migration on Infant Survival in Mexico.” Demography,36, 339-353.
King, R., and Levine, R., (1993). “Finance and Growth: Schumpeter Might be Right.” Quaterly
Journal of Economics, 108,717-737.
La Porta, R., Lopez, F., and Vishny, R., (1997). “Legal Determinanra of External Finance.”
Jour-nal of Finance, 52, 1131-1150.
Maimbo, S., and Ratha, D., (2005). “Remittances: Development Impact and Future Prospects”. Washing-ton, D.C.:World Bank.
Mundaca, G.,(2005). “Can Remittances Enhance Economic Growth? The Role of Financial Markets Development.” Mimeo. University of Oslo.
Solimano, A., (2003). “Workers Remittances to the Andean Region: Mechanisms, Costs and De-velopment Impact”, Paper prepared for the Multilateral Investment Fund-IDB’s Conference on Remittances
and Development, May, Quito Ecuador.
Stark, O.,(1991). “The Migration of Labor”, Journal of Regional Science and Urban Economics. Oxford and Cambridge, MA.
Lucas, R., and Stark, O., (1985). “Motivations to Remit: Evidence from Botswana.” The Journal of
Political Economy, 93:901-918.
Yang, D., (2005) ”International migration, human capital, and entrepreneurship : evidence from Philippine migrants'exchange rate shocks”. World Bank Policy Research Working Paper Series 3579. IMF, various years. Balance of Payments Statistics Yearbook, Washington, D.C.
The Financial Development Report (2008), World Economic Forum.
World Bank, (2006).Economic Implications of Remittances and Migration. World Bank, Wash-ington D.C.
World Bank, (2006). Migration and Remittances. East-Europe and the Former Soviet Union. World Bank, Washington D.C.
24 Internet resources:
World Bank, (2009). GDP and workers’ remittances data collected for the period 1994-2007. Retrieved from:
http://ddpext.worldbank.org/ext/DDPQQ/member.do?method=getMembers&userid=1&que ryId=135
25
Appendix - Data for remittances, bank deposits and bank credits.
Country Year Rem Rem/GDP Deposits/GDP Credits/GDP Albania 1994 307 000 000 0,154607524 0,204934337 0,03420124 Albania 1995 427 000 000 0,176118864 0,260255 0,033143665 Albania 1996 551 000 000 0,182860994 0,338980812 0,034585776 Albania 1997 300 000 000 0,136598104 0,390523797 0,040372642 Albania 1998 504 000 000 0,184767968 0,415210537 0,03604381 Albania 1999 407 000 000 0,118506783 0,44600256 0,038411861 Albania 2000 598 000 000 0,16220691 0,367530524 0,046674556 Albania 2001 699 000 000 0,170862022 0,470252105 0,059901366 Albania 2002 734 000 000 0,164967038 0,445283928 0,063489805 Albania 2003 889 000 000 0,157280415 0,4586176 0,074755546 Albania 2004 1 160 670 000 0,1554931 0,486187323 0,094608748 Albania 2005 1 289 700 000 0,153966751 0,519252761 0,151197627 Albania 2006 1 359 460 000 0,149426414 0,563488793 0,218070835 Albania 2007 1 070 897 000 0,098871274 0,613226123 0,293974889 Table 1. Data for Albania
Source:World Bank Indicators and Balance of Payments Statistics, IMF. Calculations made by author.
Country Year Rem Rem/GDP Deposits/GDP Credits/GDP
Belarus 1994 n/a n/a 0,224133086 0,175742146
Belarus 1995 29 000 000 0,002075485 0,10235 0,18878976 Belarus 1996 351 000 000 0,023785545 0,108852 0,064132424 Belarus 1997 295 000 000 0,020879911 0,108879 0,082578033 Belarus 1998 315 000 000 0,020693712 0,5691 0,160930328 Belarus 1999 193 000 000 0,015899842 0,132122 0,092432584 Belarus 2000 139 000 000 0,010913211 0,437933828 0,087861022 Belarus 2001 149 000 000 0,01206007 0,233037524 0,081566627 Belarus 2002 141 000 000 0,009660892 0,153185173 0,090445821 Belarus 2003 222 000 000 0,001234191 0,10955892 0,117149007 Belarus 2004 256 700 000 0,011092584 0,081675405 0,14117924 Belarus 2005 254 600 000 0,008427648 0,061628688 0,15466649 Belarus 2006 339 800 000 0,009193246 0,050613748 0,194756961 Belarus 2007 354 200 000 0,007910955 0,041311044 0,236591664 Table2. Data for Belarus
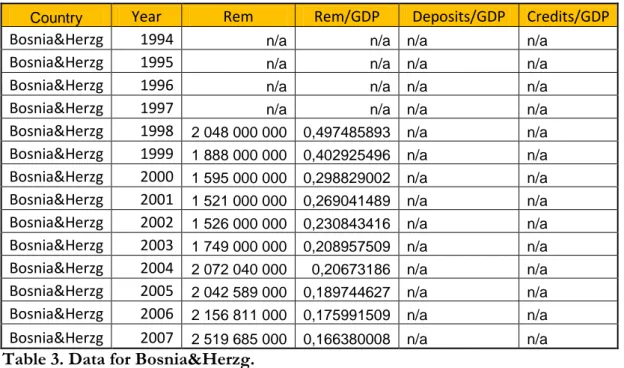
26 Country Year Rem Rem/GDP Deposits/GDP Credits/GDP
Bosnia&Herzg 1994 n/a n/a n/a n/a
Bosnia&Herzg 1995 n/a n/a n/a n/a
Bosnia&Herzg 1996 n/a n/a n/a n/a
Bosnia&Herzg 1997 n/a n/a n/a n/a
Bosnia&Herzg 1998 2 048 000 000 0,497485893 n/a n/a Bosnia&Herzg 1999 1 888 000 000 0,402925496 n/a n/a Bosnia&Herzg 2000 1 595 000 000 0,298829002 n/a n/a Bosnia&Herzg 2001 1 521 000 000 0,269041489 n/a n/a Bosnia&Herzg 2002 1 526 000 000 0,230843416 n/a n/a Bosnia&Herzg 2003 1 749 000 000 0,208957509 n/a n/a Bosnia&Herzg 2004 2 072 040 000 0,20673186 n/a n/a Bosnia&Herzg 2005 2 042 589 000 0,189744627 n/a n/a Bosnia&Herzg 2006 2 156 811 000 0,175991509 n/a n/a Bosnia&Herzg 2007 2 519 685 000 0,166380008 n/a n/a Table 3. Data for Bosnia&Herzg.
Source:World Bank Indicators and Balance of Payments Statistics, IMF. Calculations made by author.
Country Year Rem Rem/GDP Deposits/GDP Credits/GDP
Bulgaria 1994 n/a n/a 0,082030228 0,492104563
Bulgaria 1995 n/a n/a 0,074481136 0,398890909
Bulgaria 1996 42 000 000 0,004242158 0,060611925 0,629494605 Bulgaria 1997 51 000 000 0,004920414 0,007217421 0,093263925 Bulgaria 1998 51 000 000 0,004004183 0,007635792 0,105502431 Bulgaria 1999 43 000 000 0,0033215 0,008891761 0,120739807 Bulgaria 2000 58 000 000 0,004603397 0,008554753 0,125600867 Bulgaria 2001 71 000 000 0,0052211 0,009233919 0,149469184 Bulgaria 2002 1 177 000 000 0,075446668 0,009149538 0,195174372 Bulgaria 2003 1 718 000 000 0,085961705 0,009192708 0,271838108 Bulgaria 2004 1 722 770 000 0,069896205 0,009405069 0,36120341 Bulgaria 2005 1 612 900 000 0,05932468 0,009922111 0,434329509 Bulgaria 2006 1 707 200 000 0,053929097 0,010194283 0,469601507 Bulgaria 2007 2 085 618 000 0,052734718 0,01066242 0,667073602 Table 4. Data for Bulgaria
27 Country Year Rem Rem/GDP Deposits/GDP Credits/GDP
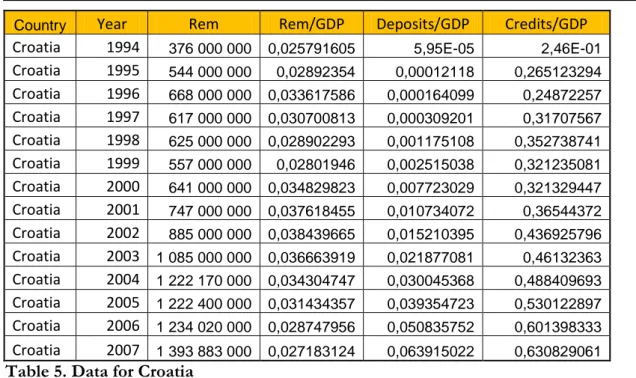
Croatia 1994 376 000 000 0,025791605 5,95E-05 2,46E-01 Croatia 1995 544 000 000 0,02892354 0,00012118 0,265123294 Croatia 1996 668 000 000 0,033617586 0,000164099 0,24872257 Croatia 1997 617 000 000 0,030700813 0,000309201 0,31707567 Croatia 1998 625 000 000 0,028902293 0,001175108 0,352738741 Croatia 1999 557 000 000 0,02801946 0,002515038 0,321235081 Croatia 2000 641 000 000 0,034829823 0,007723029 0,321329447 Croatia 2001 747 000 000 0,037618455 0,010734072 0,36544372 Croatia 2002 885 000 000 0,038439665 0,015210395 0,436925796 Croatia 2003 1 085 000 000 0,036663919 0,021877081 0,46132363 Croatia 2004 1 222 170 000 0,034304747 0,030045368 0,488409693 Croatia 2005 1 222 400 000 0,031434357 0,039354723 0,530122897 Croatia 2006 1 234 020 000 0,028747956 0,050835752 0,601398333 Croatia 2007 1 393 883 000 0,027183124 0,063915022 0,630829061 Table 5. Data for Croatia
Source:World Bank Indicators and Balance of Payments Statistics, IMF. Calculations made by author.
Country Year Rem Rem/GDP Deposits/GDP Credits/GDP Czech.Rep 1994 164 000 000 0,003991211 0,309948059 0,738501054 Czech.Rep 1995 191 000 000 0,003456573 0,359038404 0,706843412 Czech.Rep 1996 112 000 000 0,001806143 0,705251026 0,685508736 Czech.Rep 1997 85 000 000 0,001487708 2,478391466 0,690412956 Czech.Rep 1998 350 000 000 0,005659156 2,372330301 0,589166934 Czech.Rep 1999 318 000 000 0,005283082 2,5596213 0,527907536 Czech.Rep 2000 297 000 000 0,005236171 2,845055432 0,470447704 Czech.Rep 2001 257 000 000 0,00415573 3,550418543 0,389576186 Czech.Rep 2002 335 000 000 0,004450285 3,892502526 0,292403111 Czech.Rep 2003 499 000 000 0,005462045 4,415228686 0,303622663 Czech.Rep 2004 814 530 000 0,007436941 5,252668078 0,315065938 Czech.Rep 2005 1 026 149 000 0,008238946 6,53482402 0,3608983 Czech.Rep 2006 1 189 915 000 0,008361262 8,13679392 0,408298193 Czech.Rep 2007 1 332 446 000 0,007614049 9,954535798 0,477705545 Table 6. Data for Czech.Republic
28 Country Year Rem Rem/GDP Deposits/GDP Credits/GDP
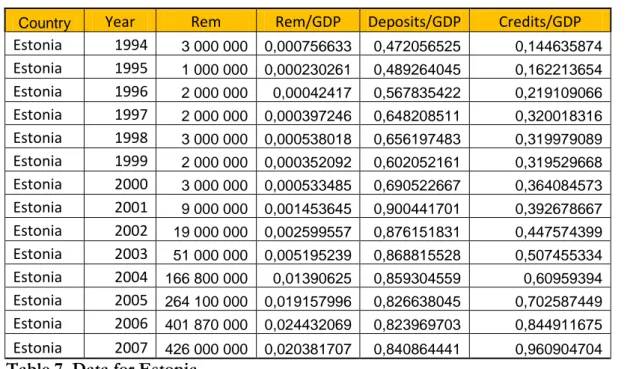
Estonia 1994 3 000 000 0,000756633 0,472056525 0,144635874 Estonia 1995 1 000 000 0,000230261 0,489264045 0,162213654 Estonia 1996 2 000 000 0,00042417 0,567835422 0,219109066 Estonia 1997 2 000 000 0,000397246 0,648208511 0,320018316 Estonia 1998 3 000 000 0,000538018 0,656197483 0,319979089 Estonia 1999 2 000 000 0,000352092 0,602052161 0,319529668 Estonia 2000 3 000 000 0,000533485 0,690522667 0,364084573 Estonia 2001 9 000 000 0,001453645 0,900441701 0,392678667 Estonia 2002 19 000 000 0,002599557 0,876151831 0,447574399 Estonia 2003 51 000 000 0,005195239 0,868815528 0,507455334 Estonia 2004 166 800 000 0,01390625 0,859304559 0,60959394 Estonia 2005 264 100 000 0,019157996 0,826638045 0,702587449 Estonia 2006 401 870 000 0,024432069 0,823969703 0,844911675 Estonia 2007 426 000 000 0,020381707 0,840864441 0,960904704 Table 7. Data for Estonia
Source:World Bank Indicators and Balance of Payments Statistics, IMF. Calculations made by author.
Country Year Rem Rem/GDP Deposits/GDP Credits/GDP
Hungary 1994 n/a n/a 0,097697494 0,264130627
Hungary 1995 152 000 000 0,003403774 0,107212631 0,224998397 Hungary 1996 169 000 000 0,003742027 0,096283983 0,220589387 Hungary 1997 213 000 000 0,004658428 0,088488725 0,243176472 Hungary 1998 220 000 000 0,004675953 0,080252552 0,241925842 Hungary 1999 213 000 000 0,004433411 0,069999623 0,260503147 Hungary 2000 281 000 000 0,005859691 0,069904536 0,313896706 Hungary 2001 296 000 000 0,005552439 0,066981304 0,329075823 Hungary 2002 279 000 000 0,004195367 0,051067533 0,349257453 Hungary 2003 295 000 000 0,003498327 0,046536751 0,421004605 Hungary 2004 307 100 000 0,00300856 0 0,4568273 Hungary 2005 280 450 000 0,002544527 0,042042689 0,51239284 Hungary 2006 362 980 000 0,003210703 0,040727863 0,552956371 Hungary 2007 413 265 000 0,002985391 0,041777148 0,614674128 Table 8. Data for Hungary
29 Country Year Rem Rem/GDP Deposits/GDP Credits/GDP
Latvia 1994 n/a n/a 1,031162651 0,16147074
Latvia 1995 n/a n/a 1,119500574 0,079968642
Latvia 1996 41 000 000 0,007340707 1,2394845 0,070534356 Latvia 1997 46 000 000 0,007500121 1,862554791 0,107839758 Latvia 1998 49 000 000 0,007405216 2,136430622 0,146627298 Latvia 1999 49 000 000 0,006722897 2,183635639 0,156784525 Latvia 2000 72 000 000 0,0091918 2,656079773 0,192370869 Latvia 2001 112 000 000 0,013472797 3,114482567 0,26291954 Latvia 2002 138 000 000 0,014815158 3,254725947 0,325446336 Latvia 2003 173 000 000 0,015465135 3,165838104 0,402315032 Latvia 2004 229 400 000 0,01666961 2,35968191 0,507733692 Latvia 2005 381 000 000 0,023750392 2,971332929 0,681642565 Latvia 2006 482 100 000 0,024166279 3,12919531 0,875134264 Latvia 2007 551 900 000 0,020324313 3,142696888 0,886671177 Table 9. Data for Latvia
Source:World Bank Indicators and Balance of Payments Statistics, IMF. Calculations made by author.
Country Year Rem Rem/GDP Deposits/GDP Credits/GDP Lithuania 1994 1 000 000 0,000143706 n/a n/a
Lithuania 1995 1 000 000 0,000133215 n/a n/a Lithuania 1996 3 000 000 0,000371621 n/a n/a Lithuania 1997 3 000 000 0,000304746 n/a n/a Lithuania 1998 3 000 000 0,000270404 n/a n/a Lithuania 1999 3 000 000 0,000276753 n/a n/a Lithuania 2000 50 000 000 0,004378878 n/a n/a Lithuania 2001 79 000 000 0,006504113 n/a n/a Lithuania 2002 109 000 000 0,007711742 n/a n/a Lithuania 2003 115 000 000 0,006196743 n/a n/a Lithuania 2004 324 500 000 0,014416828 n/a n/a Lithuania 2005 534 300 000 0,020764312 n/a n/a Lithuania 2006 994 090 000 0,033404024 n/a n/a Lithuania 2007 1 427 289 000 0,037234879 n/a n/a Table 10. Data for Lithuania
30 Country Year Rem Rem/GDP Deposits/GDP Credits/GDP
Macedonia 1994 n/a n/a 0,003310295 0,45324959
Macedonia 1995 n/a n/a 0,002000584 0,231015961
Macedonia 1996 68 000 000 0,015377101 0,002191469 0,26525803 Macedonia 1997 78 000 000 0,020881789 0,003033679 0,272611937 Macedonia 1998 63 000 000 0,017641903 0,003166192 0,177101124 Macedonia 1999 77 000 000 0,020962145 0,003139783 0,208655088 Macedonia 2000 81 000 000 0,022582274 0,003752954 0,172795836 Macedonia 2001 73 000 000 0,021239692 0,004667253 0,17597855 Macedonia 2002 106 000 000 0,027958698 0,005527524 0,17667746 Macedonia 2003 174 000 000 0,037584887 0,00680356 0,187577042 Macedonia 2004 213 000 000 0,039676317 0,008614287 0,220898977 Macedonia 2005 226 600 000 0,038970021 0,001629426 0,247380669 Macedonia 2006 266 550 000 0,041824139 0,014959072 0,298187608 Macedonia 2007 266 550 000 0,034734451 0,015474625 0,363945789 Table 11. Data for Macedonia
Source:World Bank Indicators and Balance of Payments Statistics, IMF. Calculations made by author.
Country Year Rem Rem/GDP Deposits/GDP Credits/GDP
Moldova 1994 n/a n/a 0,636331011 0,036898037
Moldova 1995 1 000 000 0,000570452 0,563688272 0,066917284 Moldova 1996 87 000 000 0,051323482 0,447242883 0,07705604 Moldova 1997 114 000 000 0,059065172 0,526735449 0,069199282 Moldova 1998 124 000 000 0,075632943 0,60380399 0,138746985 Moldova 1999 112 000 000 0,09566231 0,505145269 0,117931342 Moldova 2000 179 000 000 0,138929828 0,485980025 0,126423845 Moldova 2001 243 000 000 0,164116346 0,511977745 0,147201869 Moldova 2002 324 000 000 0,194967185 0,490264231 0,171457262 Moldova 2003 487 000 000 0,24584766 0,466830805 0,202942177 Moldova 2004 705 200 000 0,271415378 0,535964036 0,21212756 Moldova 2005 920 300 000 0,307980877 0,625517901 0,236010039 Moldova 2006 1 181 720 000 0,346702625 0,650556375 0,274732985 Moldova 2007 1 498 200 000 0,340790835 0,677437493 0,368977021 Table 12. Data for Moldova
31 Country Year Rem Rem/GDP Deposits/GDP Credits/GDP
Poland 1994 581 000 000 0,005897522 0,062833135 0,177848413 Poland 1995 724 000 000 0,005206321 0,041468232 0,168867986 Poland 1996 774 000 000 0,004939878 0,031971707 0,192203789 Poland 1997 848 000 000 0,005395984 0,03457436 0,208195159 Poland 1998 1 070 000 000 0,006188494 0,034796023 0,225491012 Poland 1999 825 000 000 0,004911939 0,039640846 0,237850677 Poland 2000 1 726 000 000 0,010073995 0,047274369 0,26567013 Poland 2001 1 995 000 000 0,010476795 0,077438158 0,272684475 Poland 2002 1 989 000 000 0,010036355 0,067218005 0,274319855 Poland 2003 2 655 000 000 0,012246257 0,077887129 0,280671667 Poland 2004 4 728 000 000 0,018704833 0,085265289 0,281366477 Poland 2005 6 482 000 000 0,021328518 0,094299615 0,289266166 Poland 2006 8 496 000 000 0,024866094 0,111164778 0,33284058 Poland 2007 10 496 000 000 0,024866751 0,132623993 0,394856501 Table 13. Data for Poland
Source:World Bank Indicators and Balance of Payments Statistics, IMF. Calculations made by author.
Country Year Rem Rem/GDP Deposits/GDP Credits/GDP
Romania 1994 11 000 000 0,000365781 0,08084649 0 Romania 1995 9 000 000 0,000253685 0,0835524 0 Romania 1996 18 000 000 0,000509429 0,06414846 0,114911862 Romania 1997 16 000 000 0,000453439 0,03758012 0,083603369 Romania 1998 49 000 000 0,001163467 0,02430404 0,115517121 Romania 1999 96 000 000 0,00269721 0,02561593 0,080681839 Romania 2000 96 000 000 0,002590909 0,02595542 0,071153794 Romania 2001 116 000 000 0,002886955 0,02505635 0,086126702 Romania 2002 143 000 000 0,003120599 0,02795299 0,101067644 Romania 2003 124 000 000 0,002083776 0,02928678 0,137378183 Romania 2004 132 000 000 0,001748589 0,03261416 0,156109521 Romania 2005 4 732 600 000 0,047845896 0,03894863 0,199129622 Romania 2006 6 717 640 000 0,054774604 0,04177191 0,258629454 Romania 2007 8 533 000 000 0,051410957 0,05005747 0,350650011 Table 14. Data for Romania
32 Country Year Rem Rem/GDP Deposits/GDP Credits/GDP
Russian Fed 1994 4 563 000 000 0,011549368 0,1089291 0,121200262 Russian Fed 1995 2 503 000 000 0,006328242 0,06108015 0,093654883 Russian Fed 1996 2 771 000 000 0,007073905 0,05800543 0,082935053 Russian Fed 1997 2 268 000 000 0,005601016 0,06407825 0,10678079 Russian Fed 1998 1 925 000 000 0,00710455 0,07465538 0,156180027 Russian Fed 1999 1 292 000 000 0,006595008 0,04824484 0,130854412 Russian Fed 2000 1 275 000 000 0,00490935 0,03669549 0,132694508 Russian Fed 2001 1 403 000 000 0,004575955 0,03401191 0,16470996 Russian Fed 2002 1 359 000 000 0,003933766 0,0274816 0,177038133 Russian Fed 2003 1 453 000 000 0,003367425 0,02327857 0,209349704 Russian Fed 2004 2 495 110 000 0,004216547 0,01959039 0,241020994 Russian Fed 2005 2 918 660 000 0,003817582 0,01742308 0,256992703 Russian Fed 2006 3 091 400 000 0,003120808 0,01594354 0,308956084 Russian Fed 2007 4 100 380 000 0,003178387 0,01460455 0,378718508 Table 15. Data for Russian Fed.
Source:World Bank Indicators and Balance of Payments Statistics, IMF. Calculations made by author.
Country Year Rem Rem/GDP Deposits/GDP Credits/GDP
Serbia 1994 n/a n/a n/a n/a
Serbia 1995 n/a n/a n/a n/a
Serbia 1996 n/a n/a n/a n/a
Serbia 1997 206 000 000 0,010466846 0,004356884 n/a Serbia 1998 283 000 000 0,017585672 0,00562481 n/a Serbia 1999 327 000 000 0,029372303 0,003780478 0,491126293 Serbia 2000 1 132 000 000 0,12629242 0,007407331 0,338037834 Serbia 2001 1 698 000 000 0,144405711 0,01118364 0,338037834 Serbia 2002 2 089 000 000 0,131952362 0,013651121 0,172599268 Serbia 2003 2 661 000 000 0,130827996 0,015082797 0,191270311 Serbia 2004 4 129 000 000 0,168407584 0,015935289 0,228834387 Serbia 2005 4 650 000 000 0,177525526 0,018407868 0,288761309 Serbia 2006 4 703 000 000 0,154058766 0,020650659 0,288610471 Serbia 2007 4 910 000 000 0,122377128 0,024650423 0,339028715 Table 16. Data for Serbia
33 Country Year Rem Rem/GDP Deposits/GDP Credits/GDP
Ukraine 1994 n/a n/a 0,20066207 0,046225868
Ukraine 1995 n/a n/a 0,078634896 0,014751266
Ukraine 1996 6 000 000 0,000134656 0,063108232 0,01383935 Ukraine 1997 12 000 000 0,00023928 0,068075724 0,024196648 Ukraine 1998 12 000 000 0,000286511 0,08133245 0,077218329 Ukraine 1999 18 000 000 0,000569969 0,093933242 0,084681314 Ukraine 2000 33 000 000 0,001055611 0,110181337 0,110638561 Ukraine 2001 141 000 000 0,003709614 0,125281845 0,130167491 Ukraine 2002 209 000 000 0,004930071 0,167019175 0,176407599 Ukraine 2003 330 000 000 0,006582496 0,229536477 0,245352056 Ukraine 2004 411 000 000 0,006334473 0,240383005 0,251255096 Ukraine 2005 595 000 000 0,006907198 0,300699736 0,321636327 Ukraine 2006 829 000 000 0,007693516 0,33850218 0,443290766 Ukraine 2007 4 503 000 000 0,03189608 0,388132049 0,581420807 Table 17. Data for Ukraine