EX PL O R IN G H EA V Y V EH IC LE I N TE R A C TIO N
the increasing levels of information- and computation-rich functionality. The possibilities given by new interaction technologies are pushing the frontiers of how and where interaction between human and computer occurs. This development comes with both opportunities and risks, making the information exchange with the operator a decisive factor for a successful and safe vehicle operation.
This thesis covers theoretical, methodological, technological, and empirical aspects of de-sign research through interaction dede-sign in the heavy vechicles domain. A practice-based procedure, through sketching, is used to approach and bring design theories and design perspectives together into a model covering design research, process, and elements of de-sign. The application area is approached by operator observations, focusing on operator’s attention to displays. This work presents empirical results with evaluation of the applica-tion of guerrilla user study methods, and the use of online based user studies within the heavy vehicle domain. The limited attention to digital information providers, observed in the operator studies, led the work into the study and exploration of designs that could visualize information closer to the area in front of the vehicle. The aim was to improve the operator’s situation awareness, by showing warning and navigation information using transparent displays. The realization of these design prototypes contributed to the devel-opment of a novel mixed reality simulation environment. The resulting evaluation of the designs indicates an improved information detection, at a lower perceived effort level, using transparent display interfaces.
Mälardalen University Press Dissertations No. 329
EXPLORING HEAVY VEHICLE INTERACTION
INTERACTION DESIGN STUDIES OF INDUSTRIAL VEHICLE OPERATORS' INFORMATION AWARENESS USING MIXED REALITY
Markus Wallmyr 2020
School of Innovation, Design and Engineering
Mälardalen University Press Dissertations No. 329
EXPLORING HEAVY VEHICLE INTERACTION
INTERACTION DESIGN STUDIES OF INDUSTRIAL VEHICLE OPERATORS' INFORMATION AWARENESS USING MIXED REALITY
Markus Wallmyr 2020
Copyright © Markus Wallmyr, 2020 ISBN 978-91-7485-491-6
ISSN 1651-4238
Printed by E-Print AB, Stockholm, Sweden
Copyright © Markus Wallmyr, 2020 ISBN 978-91-7485-491-6
ISSN 1651-4238
Mälardalen University Press Dissertations No. 329
EXPLORING HEAVY VEHICLE INTERACTION
INTERACTION DESIGN STUDIES OF INDUSTRIAL VEHICLE OPERATORS' INFORMATION AWARENESS USING MIXED REALITY
Markus Wallmyr
Akademisk avhandling
som för avläggande av teknologie doktorsexamen i datavetenskap vid Akademin för innovation, design och teknik kommer att offentligen försvaras onsdagen den 16 december 2020, 13.00 i Paros & Zoom, Mälardalens högskola, Västerås.
Fakultetsopponent: Professor Jens Krzywinski, Dresden Technical University
Akademin för innovation, design och teknik
Mälardalen University Press Dissertations No. 329
EXPLORING HEAVY VEHICLE INTERACTION
INTERACTION DESIGN STUDIES OF INDUSTRIAL VEHICLE OPERATORS' INFORMATION AWARENESS USING MIXED REALITY
Markus Wallmyr
Akademisk avhandling
som för avläggande av teknologie doktorsexamen i datavetenskap vid Akademin för innovation, design och teknik kommer att offentligen försvaras onsdagen den 16 december 2020, 13.00 i Paros & Zoom, Mälardalens högskola, Västerås.
Fakultetsopponent: Professor Jens Krzywinski, Dresden Technical University
VII
Abstract
The work presented in this dissertation is in the field of interaction design through visual interaction with information systems in heavy industrial vehicles within agriculture, forestry, and construction. The dissertation investigates how interaction technologies and the application of interaction design methods can be used to provide an efficient interaction and a good user experience for the operator interacting with the heavy vehicle information system. Having a proficient user interaction with these systems is becoming central due to the increasing levels of information- and computation-rich functionality. The possibilities given by new interaction technologies are pushing the frontiers of how and where interaction between humans and computers occurs. This development comes with both opportunities and risks, making the information exchange with the operator a decisive factor for a successful and safe vehicle operation.
This thesis covers the theoretical, methodological, technological, and empirical aspects of design research through interaction design in the heavy vehicle’s domain. A practice-based procedure, through sketching, is used to approach and bring design theories and design perspectives together into a model covering design research, process, and elements of design. The application area is approached by observations of operators, focusing on their attention to vehicle displays. This work presents empirical results with evaluation of the application of pop-up user study methods, and the use of online based user studies within the heavy vehicle domain. The limited attention to digital information providers, observed in the operator studies, led the work into the study and exploration of designs that could visualize information closer to the area in front of the vehicle. The aim was to improve the operator’s situation awareness, by showing warning and navigation information using transparent displays. The realization of these design prototypes contributed to the development of a novel mixed reality simulation environment. The resulting evaluation of the designs indicates an improved information detection, at a lower perceived effort level, using transparent display interfaces.
IX
Sammanfattning
Denna avhandling behandlar interaktionsdesign för informationssystem i tunga industrifordon inom jordbruk, skogsbruk och anläggningsarbete med fokus på visuell interaktion. Avhandlingen undersöker hur interaktionstekniker och tillämpning av interaktionsdesignmetoder kan användas för att tillhandahålla en effektiv interaktion samt en god användarupplevelse för operatören som interagerar med informationssystemet i industrifordonet. Behovet av en genomarbetat användarinteraktion med dessa system blir centralt på grund den ökande graden av informations och programvarubaserad funktionalitet. Möjligheterna genom ny interaktionsteknologi flyttar gränserna för hur och var interaktion mellan människa och maskin inträffar. Denna utveckling kommer med både möjligheter och risker, vilket gör informationsutbytet med operatören till en avgörande faktor för framgångsrik och säker fordonsdrift.
Avhandlingen täcker teoretiska, metodologiska, tekniska och empiriska aspekter av forskning genom interaktionsdesign i industrifordonsdomänen. En praktikbaserad procedur, genom skissande, används för att närma sig och sammanföra designteorier och designperspektiv i en modell som täcker designforskning, designprocess och designelement. Det industriella tillämpningsområdet observeras genom operatörsstudier, med fokus på operatörens uppmärksamhet. Detta arbete presenterar inte bara empiriska resultat utan utvärderar också tillämpningen av pop-up-användarstudier och av online baserade-användarstudier inom industrifordonsdomänen. Den begränsade uppmärksamheten på digital presenterad information, som observerades i operatörsstudierna, ledde arbetet med att studera och utforska interaktionsdesigner som kunde visualisera information närmare operatörens fokus framför fordonet. Målet var att förbättra operatörens situationsmedvetenhet genom att visa varnings- och navigationsinformation via transparenta skärmar. Förverkligandet av dessa designprototyper bidrog till utvecklingen av en ny simuleringsmiljö med stöd för blandad verklighets simuleringar. Den resulterande utvärderingen av den visuella designen indikerar en förbättrad informationsdetektering och en lägre ansträngning för operatören med hjälp av transparenta displaygränssnitt.
Acknowledgements
Thank you for reading this thesis and showing interest in this work.
I was probably hooked on Interaction Design from my very first encounter with a computer; I just didn’t know the term back then. I configured the use and looks of different window managers, I had an I/O board for my Amiga computer and tried to make my room interact with me (such as playing a sound of a barking dog when someone opened the door), I studied the windows NT design guidelines, I carried bulky handheld devices trying to find a good use for them, and so it continued. My work-life has also had a connection to Interaction, with roles ranging from application development of graphical user interfaces for desktop and mobile machines, to IT-systems, and product management of both software and hardware products. Having the opportunity to pursue Interaction Design and Computer Science as a PhD is thus the pursue of a real interest, and I am grateful for the opportunity.
A key enabler for making this research work a reality was my employer CrossControl, a supplier of hardware and software for realization of interaction solutions for machines and vehicles in rough environments. The Swedish Knowledge Foundation (KKS) was also a supporter of the research, and Mälardalen University was the academic host. Thank you all for the opportunity. These companies and institutions are what they are because of the people who represent them, and I would like to take a moment and express my sincere gratitude to a few of them.
First of all, I would like to thank my supervisors Gordana Dodig-Crnkovic, Rikard Lindell, Mikael Åkerholm as well as my former supervisor Rikard Land. I greatly appreciate not only your tutoring and guidance but also all interesting conversations, your kindness, and encouragement.
I also want to express my gratitude to my managers during this time. Mikael Åkerholm who opened up the opportunity for this work and encouraged my beginning and Mats Kjellberg who has been with me to the end: Thank you both for believing in me and giving me the opportunity.
Furthermore, I would like to express my appreciation for the people within the ITS-EASY industrial research school, its management and fellow partners, for educational activities as well as interesting times outside the planned activities.
I have listened to and shared views with many talented, interesting and passionate persons during conferences, workshops, brokerage events, seminars, courses, projects, etc. I wish that I can remain a part of the community and continue the conversation into the future, as these exchanges have perhaps been the most inspiring and rewarding part of the PhD studies. You are too many to mention and some of you I cannot even name, but if you read these lines, I express my appreciation and say thank you and that I am looking forward to next time. I would still like to name a few in person. I am hugely grateful for the fellowship with the ITS-EASY PhD colleagues; Apala Ray, Daniel Hallmans, Daniel Kade, David Rylander, Eduard Paul Eniou, Fredrik Ekstrand, Gaetana Sapienza, Kristian Wiklund, Markus Jägemar, Mehrdad Saadatmand, Melika Hozhabri, Sara Dersten, Stephan Baumgart, and Tomas Olsson. Special thanks to my partners in doing research1, writing papers, and organizing workshops; Tobias Holstein, Daniel Kade, Taufik Akbar Sitompul, and Lewis Chuang. The collaboration and different discussions made the work more interesting, fun, and fruitful.
My deepest gratitude I owe to my dear parents Gösta and Isa. I am who I am because of you, who you are, your nurturing, and your support.
Finally and foremost, to the ones that make me complete, my beloved wife Pauline, and my wonderful children Vera and Wilford. It was your loving support and patience that enabled me to grit through with the research and to finish this thesis.
Markus Wallmyr November 2020, Uppsala, Sweden
Table of contents
A. Introduction ... 1
1 Introduction ... 3
2 Thesis overview, included papers, and contributions ... 5
2.1 Full list of publications and position papers ... 10
3 Aim and research questions ... 13
4 Background & the why ... 15
4.1 Heavy vehicles ... 16
4.2 A transforming industry ... 17
4.2.1 From mechanization ... 17
4.2.2 Into digital systems ... 17
4.3 A changing operator situation ... 18
4.3.1 The cabin environment... 19
4.3.2 User acceptance ... 21
4.3.3 Workload and situation awareness ... 22
4.4 Into interaction design ... 24
4.4.1 Interaction design for good ... 25
5 Perspectives on design and research approach ... 27
5.1 Theory and practice in design ... 27
5.2 Sketching as a design practice ... 29
5.3 Sketching theory ... 30
5.3.1 Approach ... 31
5.3.2 The design process ... 35
5.3.3 The elements which form the design space ... 37
5.3.4 The design research perspective ... 38
5.4 Bringing the perspectives together... 41
5.5 The resulting research model ... 43
B. Gaining understanding ... 45
6 Seeing through the eyes of heavy vehicle operators ... 47
6.1 The challenge of gaining understanding ... 48
6.1.1 Resetting the approach and asking what if? ... 49
6.2 Method ... 50
Table of contents
A. Introduction ... 11 Introduction ... 3
2 Thesis overview, included papers, and contributions ... 5
2.1 Full list of publications and position papers ... 10
3 Aim and research questions ... 13
4 Background & the why ... 15
4.1 Heavy vehicles ... 16
4.2 A transforming industry ... 17
4.2.1 From mechanization ... 17
4.2.2 Into digital systems ... 17
4.3 A changing operator situation ... 18
4.3.1 The cabin environment... 19
4.3.2 User acceptance ... 21
4.3.3 Workload and situation awareness ... 22
4.4 Into interaction design ... 24
4.4.1 Interaction design for good ... 25
5 Perspectives on design and research approach ... 27
5.1 Theory and practice in design ... 27
5.2 Sketching as a design practice ... 29
5.3 Sketching theory ... 30
5.3.1 Approach ... 31
5.3.2 The design process ... 35
5.3.3 The elements which form the design space ... 37
5.3.4 The design research perspective ... 38
5.4 Bringing the perspectives together... 41
5.5 The resulting research model ... 43
B. Gaining understanding ... 45
6 Seeing through the eyes of heavy vehicle operators ... 47
6.1 The challenge of gaining understanding ... 48
6.1.1 Resetting the approach and asking what if? ... 49
6.2.1 Study setup ... 50
6.2.2 Technical setup ... 52
6.2.3 On-site, approaching the user ... 53
6.3 Results ... 54
6.3.1 Gaze recording analysis ... 55
6.3.2 Measuring display usage ... 61
6.4 Discussion ... 62
6.4.1 On the approach ... 63
6.4.2 On the use of visual information systems in the cabins ... 64
6.5 Summary ... 65
7 Analyzing online videos as complement to field studies... 67
7.1 Introduction ... 68 7.2 Related work ... 68 7.3 Method ... 69 7.3.1 Video collection ... 69 7.3.2 Video analysis ... 70 7.4 Results ... 71 7.4.1 Diversity ... 71
7.4.2 Findings related to the questions ... 71
7.5 Discussion ... 79
7.5.1 Advantages of alternative field study ... 79
7.5.2 Disadvantages of alternative field study ... 81
7.5.3 A complementary or alternative approach? ... 83
7.6 Summary ... 84
C. Looking where there is nothing – into the transparent ... 85
8 Exploring mixed reality for heavy vehicles ... 87
8.1 Exploring different types of use ... 89
8.2 A few words on technology ... 92
9 A literature survey on augmented reality for heavy vehicle operators ... 95
9.1 Introduction ... 95
9.2 Method ... 96
9.3 Results ... 97
9.3.1 Type of operation ... 97
9.3.2 Uses and impacts ... 100
9.4 Discussion ... 106
9.4.1 Technological approaches ... 106
9.4.2 Will augmenting information benefit the operator? ... 107
9.4.3 User experience and design implications ... 108
9.4.4 Users' acceptance ... 109
6.2.1 Study setup ... 50
6.2.2 Technical setup ... 52
6.2.3 On-site, approaching the user ... 53
6.3 Results ... 54
6.3.1 Gaze recording analysis ... 55
6.3.2 Measuring display usage ... 61
6.4 Discussion ... 62
6.4.1 On the approach ... 63
6.4.2 On the use of visual information systems in the cabins ... 64
6.5 Summary ... 65
7 Analyzing online videos as complement to field studies... 67
7.1 Introduction ... 68 7.2 Related work ... 68 7.3 Method ... 69 7.3.1 Video collection ... 69 7.3.2 Video analysis ... 70 7.4 Results ... 71 7.4.1 Diversity ... 71
7.4.2 Findings related to the questions ... 71
7.5 Discussion ... 79
7.5.1 Advantages of alternative field study ... 79
7.5.2 Disadvantages of alternative field study ... 81
7.5.3 A complementary or alternative approach? ... 83
7.6 Summary ... 84
C. Looking where there is nothing – into the transparent ... 85
8 Exploring mixed reality for heavy vehicles ... 87
8.1 Exploring different types of use ... 89
8.2 A few words on technology ... 92
9 A literature survey on augmented reality for heavy vehicle operators ... 95
9.1 Introduction ... 95
9.2 Method ... 96
9.3 Results ... 97
9.3.1 Type of operation ... 97
9.3.2 Uses and impacts ... 100
9.4 Discussion ... 106
9.4.1 Technological approaches ... 106
9.4.2 Will augmenting information benefit the operator? ... 107
9.4.3 User experience and design implications ... 108
D. Realization and evaluation... 111
10 Video-based augmented reality for task support ... 113
10.1 Introduction ... 114 10.2 Technical setup ... 114 10.3 Evaluation ... 115 10.3.1 Scenario ... 115 10.3.2 Method ... 116 10.4 Results ... 117 10.5 Discussion ... 117 10.6 Summary ... 121
11 Building and evaluating a mixed reality heavy vehicle simulator ... 123
11.1 Introduction ... 124
11.2 Related work ... 125
11.3 Simulator setup ... 127
11.3.1 Projection display ... 127
11.3.2 Simulator cave ... 129
11.3.3 Architecture and software description ... 129
11.4 Evaluation ... 130 11.4.1 Scenario ... 130 11.4.2 Method ... 131 11.5 Results ... 132 11.6 Discussion ... 134 11.7 Summary ... 135
12 Building and evaluating a head-up display simulation ... 137
12.1 Introduction ... 137
12.2 Related work ... 138
12.3 Extension of the simulator setup ... 139
12.3.1 Head-up display ... 139 12.3.2 Software description ... 141 12.4 Evaluation ... 142 12.4.1 Scenario ... 143 12.4.2 Method ... 144 12.5 Results ... 145 12.6 Discussion ... 148 12.7 Summary ... 148
13 Evaluating attention and workload using mixed reality notifications ... 151
13.1 Introduction ... 152
13.2 Conceptualization ... 152
13.2.1 Using the simulator to create situations for ideations ... 153
13.2.2 Operator support and scenario ... 154
13.3 Evaluation ... 155
D. Realization and evaluation... 111
10 Video-based augmented reality for task support ... 113
10.1 Introduction ... 114 10.2 Technical setup ... 114 10.3 Evaluation ... 115 10.3.1 Scenario ... 115 10.3.2 Method ... 116 10.4 Results ... 117 10.5 Discussion ... 117 10.6 Summary ... 121
11 Building and evaluating a mixed reality heavy vehicle simulator ... 123
11.1 Introduction ... 124
11.2 Related work ... 125
11.3 Simulator setup ... 127
11.3.1 Projection display ... 127
11.3.2 Simulator cave ... 129
11.3.3 Architecture and software description ... 129
11.4 Evaluation ... 130 11.4.1 Scenario ... 130 11.4.2 Method ... 131 11.5 Results ... 132 11.6 Discussion ... 134 11.7 Summary ... 135
12 Building and evaluating a head-up display simulation ... 137
12.1 Introduction ... 137
12.2 Related work ... 138
12.3 Extension of the simulator setup ... 139
12.3.1 Head-up display ... 139 12.3.2 Software description ... 141 12.4 Evaluation ... 142 12.4.1 Scenario ... 143 12.4.2 Method ... 144 12.5 Results ... 145 12.6 Discussion ... 148 12.7 Summary ... 148
13 Evaluating attention and workload using mixed reality notifications ... 151
13.1 Introduction ... 152
13.2 Conceptualization ... 152
13.2.1 Using the simulator to create situations for ideations ... 153
13.2.2 Operator support and scenario ... 154
13.3.1 Method ... 156
13.4 Results ... 156
13.4.1 Quantitative results evaluation ... 157
13.4.2 Qualitative observations ... 163
13.5 Discussion ... 165
13.6 Summary ... 167
14 Professional operators’ opinions on the use of head-up displays... 169
14.1 On possible benefits ... 170
14.2 On the use ... 170
14.3 On design ... 171
E. Discussion and reflection ... 175
15 Discussion on the results ... 177
15.1 Validity ... 177
15.2 In the wild ... 178
15.3 Exploring mixed reality interaction in heavy vehicle situations ... 179
15.3.1 The use of video based mixed reality ... 179
15.3.2 Prototyping and evaluating mixed reality visualizations ... 180
16 Discussion on design ... 183
16.1 Exploration of combination ... 184
16.1.1 Pop-up studies in heavy vehicle environments ... 184
16.1.2 Motion capture acting research into heavy vehicle simulations ... 185
16.1.3 The turn from traditional displays to AR and head-up displays. ... 185
16.2 Practice leading to knowledge ... 185
16.2.1 Practice leads to construction of knowledge ... 186
16.2.2 Practice through sketching to facilitate intermediate theory ... 187
16.3 Design Study and the design research model ... 188
16.3.1 Cross-disciplinary generative concepts ... 189
16.3.2 Multi-perspective design space ... 190
16.3.3 Design as interpretive innovation ... 191
17 Summary of results and contributions ... 193
Appendix 1 ... 197
Appendix 2 ... 201
List of References ... 203
13.3.1 Method ... 156
13.4 Results ... 156
13.4.1 Quantitative results evaluation ... 157
13.4.2 Qualitative observations ... 163
13.5 Discussion ... 165
13.6 Summary ... 167
14 Professional operators’ opinions on the use of head-up displays... 169
14.1 On possible benefits ... 170
14.2 On the use ... 170
14.3 On design ... 171
E. Discussion and reflection ... 175
15 Discussion on the results ... 177
15.1 Validity ... 177
15.2 In the wild ... 178
15.3 Exploring mixed reality interaction in heavy vehicle situations ... 179
15.3.1 The use of video based mixed reality ... 179
15.3.2 Prototyping and evaluating mixed reality visualizations ... 180
16 Discussion on design ... 183
16.1 Exploration of combination ... 184
16.1.1 Pop-up studies in heavy vehicle environments ... 184
16.1.2 Motion capture acting research into heavy vehicle simulations ... 185
16.1.3 The turn from traditional displays to AR and head-up displays. ... 185
16.2 Practice leading to knowledge ... 185
16.2.1 Practice leads to construction of knowledge ... 186
16.2.2 Practice through sketching to facilitate intermediate theory ... 187
16.3 Design Study and the design research model ... 188
16.3.1 Cross-disciplinary generative concepts ... 189
16.3.2 Multi-perspective design space ... 190
16.3.3 Design as interpretive innovation ... 191
17 Summary of results and contributions ... 193
Appendix 1 ... 197
Appendix 2 ... 201
List of figures
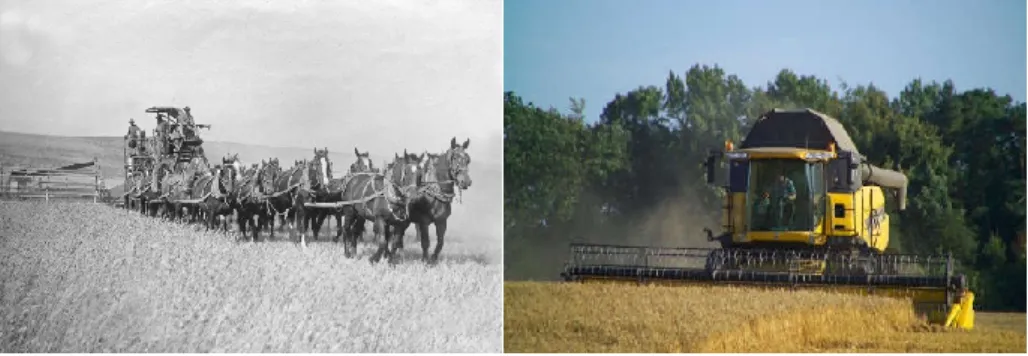
Figure 1 Early mechanized agriculture harvester (Jackman, 1940) and a
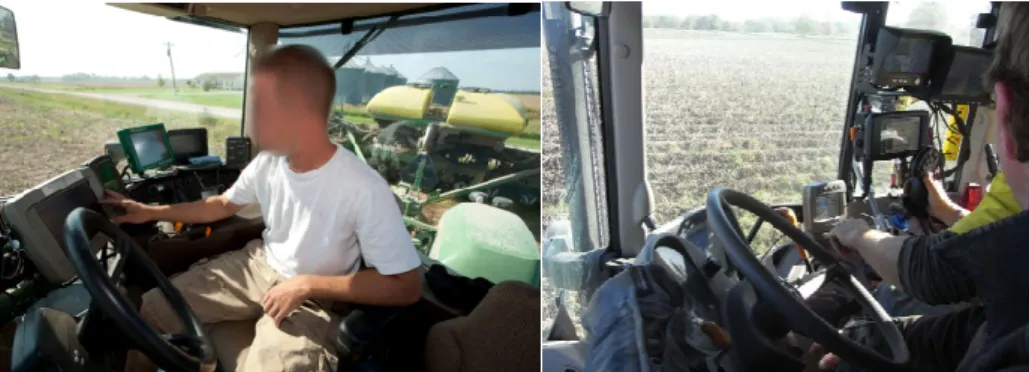
modern combine harvester. (Britton, 2005) ... 18 Figure 2 Two examples of operators interacting with the vehicle in a cabin
with several displays. ... 20 Figure 3 An example of a machine cabin with a multitude of add-on systems
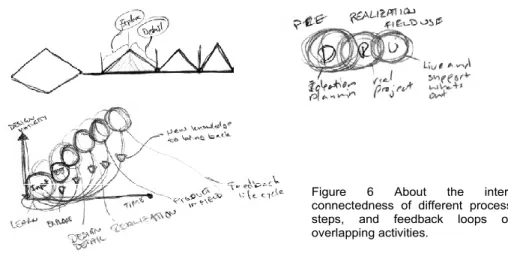
(Marshall, 2012) ... 20 Figure 4 A set of samples from the sketchbook. ... 34 Figure 5 The design develops in time. Going from A to B, as in the
conventional waterfall process model, or as an iterative processing spiraling to the final design. In practice it can feel messy, where one hits
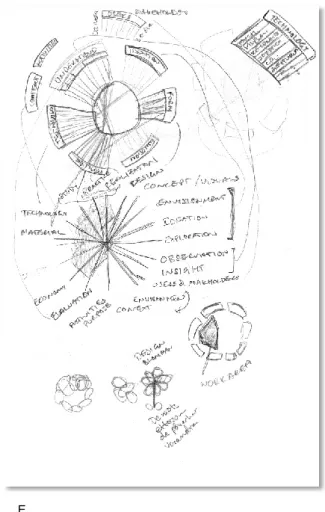
hinders and searches for the ending outcome. ... 35 Figure 6 About the inter-connectedness of different process steps, and
feedback loops or overlapping activities. ... 36 Figure 7 Mapping different activities visually was experienced as a way to
reflect on the different activities, their order, their effort, their evolvement, the possible solution space, and the design maturity. Not limited to only
the design project but encapsulating the whole product lifecycle. ... 36 Figure 8 Three of the sketches created relating to the elements that form the
design space. The activities and purpose, context and environment,
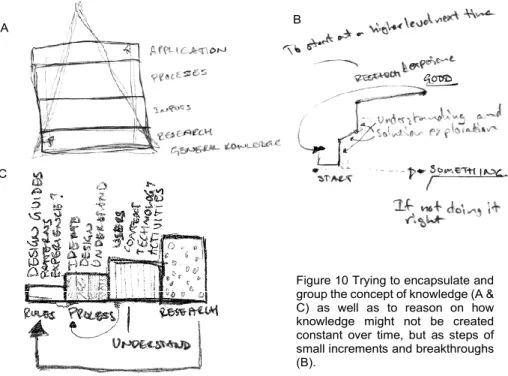
technology, and material as well as users and other stakeholders ... 37 Figure 9 Fällman’s model of interaction design research (Fallman, 2008). ... 38 Figure 10 Trying to encapsulate and group the concept of knowledge (A &
C) as well as to reason on how knowledge might not be created constant over time, but as steps of small increments and breakthroughs
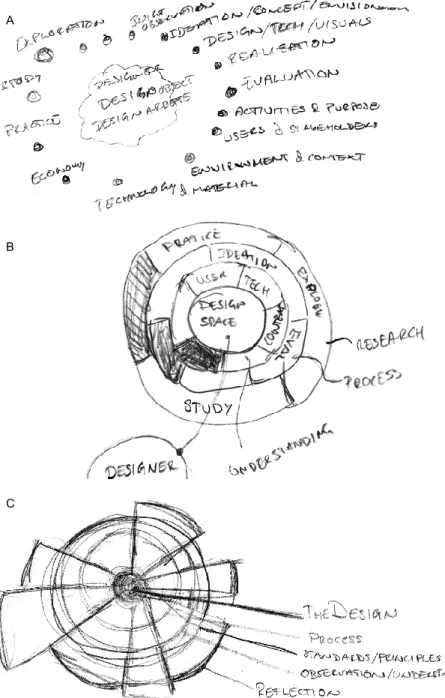
(B). ... 40 Figure 11 Three sketches inspiring and leading to the final design research
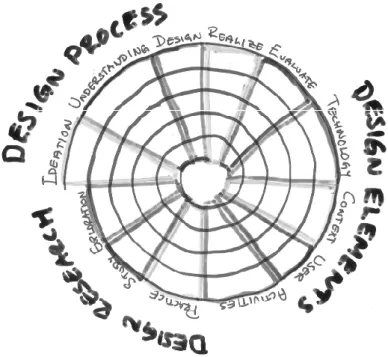
visualization. ... 42 Figure 12 The illustration of the combined resulting model. A tool to relate on
the design process, the elements of the design space as well as the
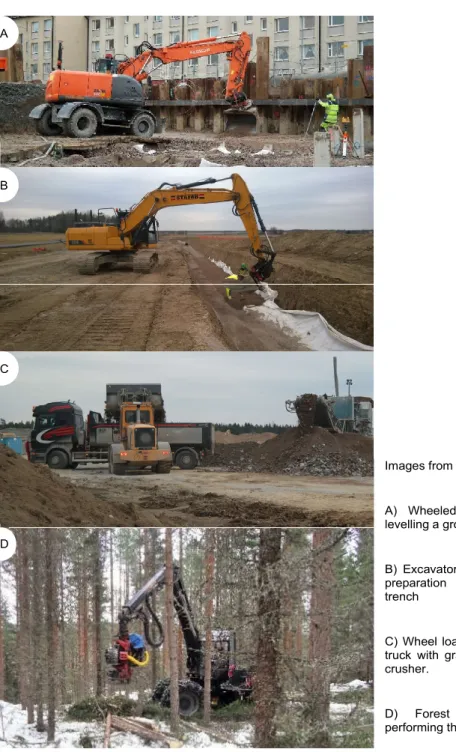
aspect of design research. ... 43 Figure 13 Pictures of the visited machines. ... 51 Figure 14 Forestry harvester and operators gaze points when processing a
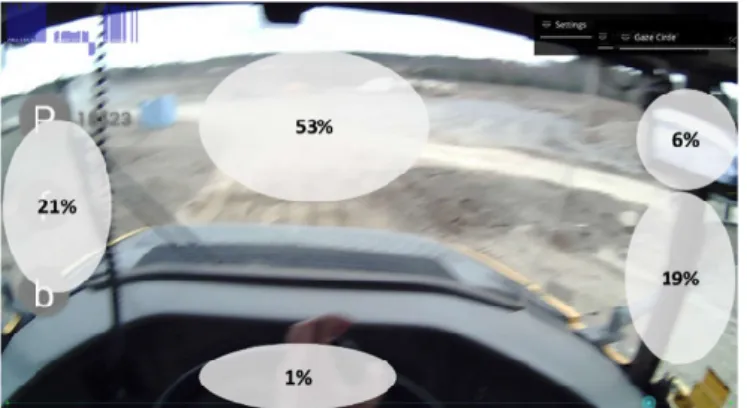
birch tree. ... 55 Figure 15 Level of attention in different areas for the harvester. ... 56 Figure 16 Level of attention in different areas for the wheeled excavator. ... 57
List of figures
Figure 1 Early mechanized agriculture harvester (Jackman, 1940) and a
modern combine harvester. (Britton, 2005) ... 18 Figure 2 Two examples of operators interacting with the vehicle in a cabin
with several displays. ... 20 Figure 3 An example of a machine cabin with a multitude of add-on systems
(Marshall, 2012) ... 20 Figure 4 A set of samples from the sketchbook. ... 34 Figure 5 The design develops in time. Going from A to B, as in the
conventional waterfall process model, or as an iterative processing spiraling to the final design. In practice it can feel messy, where one hits
hinders and searches for the ending outcome. ... 35 Figure 6 About the inter-connectedness of different process steps, and
feedback loops or overlapping activities. ... 36 Figure 7 Mapping different activities visually was experienced as a way to
reflect on the different activities, their order, their effort, their evolvement, the possible solution space, and the design maturity. Not limited to only
the design project but encapsulating the whole product lifecycle. ... 36 Figure 8 Three of the sketches created relating to the elements that form the
design space. The activities and purpose, context and environment,
technology, and material as well as users and other stakeholders ... 37 Figure 9 Fällman’s model of interaction design research (Fallman, 2008). ... 38 Figure 10 Trying to encapsulate and group the concept of knowledge (A &
C) as well as to reason on how knowledge might not be created constant over time, but as steps of small increments and breakthroughs
(B). ... 40 Figure 11 Three sketches inspiring and leading to the final design research
visualization. ... 42 Figure 12 The illustration of the combined resulting model. A tool to relate on
the design process, the elements of the design space as well as the
aspect of design research. ... 43 Figure 13 Pictures of the visited machines. ... 51 Figure 14 Forestry harvester and operators gaze points when processing a
birch tree. ... 55 Figure 15 Level of attention in different areas for the harvester. ... 56 Figure 16 Level of attention in different areas for the wheeled excavator. ... 57
Figure 17 Level of attention in different areas for the wheel loader. ... 58
Figure 18 Level of attention in different areas for the excavator. ... 59
Figure 19 Level of attention in different areas for articulated dump truck. ... 60
Figure 20 Trees that should be cut were marked with red paint (More, 2014) ... 75
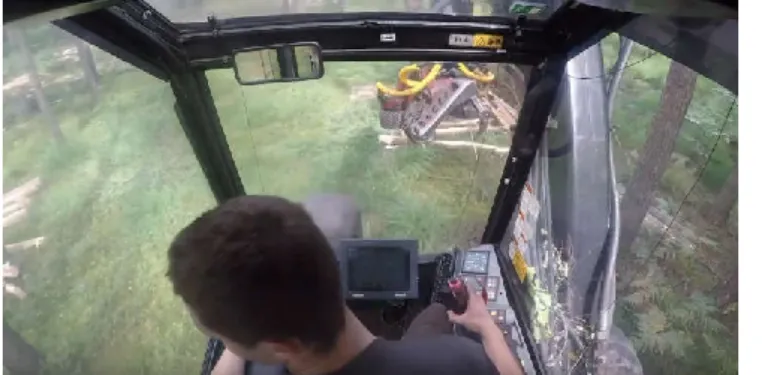
Figure 21 Views from operator’s head ... 76
Figure 22 The operator moved the tree in a way where the tree’s diameter can be seen clearly from the front windscreen (Seppänen, 2017). ... 77
Figure 23 The operator was looking at the buttons on the armrest before pressing them (Forest Faun, 2013) ... 77
Figure 24 The operator was turning his body when reversing the forest harvester (Valmeciarz, 2017) ... 78
Figure 25 The operator put his foot on the dashboard while operating the forest harvester (InsaneLogging, 2015) ... 81
Figure 26 Photographs from some of the ideation sessions, using approaches such as mood boards, annotations, modelmaking, and sketching to explore possible use cases and visualizations for mixed reality interfaces. ... 88
Figure 27 Material from the design process ... 90
Figure 28 Material from the design process ... 91
Figure 29 The left image shows where the boom is not transparent and the right image shows where the boom is 80 % transparent (Aromaa et al., 2020) ... 98
Figure 30 A visualization of the environment around the machine. The blue line represents the crane's structure, while the point clouds represent the environment in front of the machine (Palonen et al., 2017). ... 98
Figure 31 Aiding the pickup of pallets using a forklift. Going under the pallet the forks are represented by blue virtual quads. The green line indicates the maximum depth that the forks can be moved to (Sarupuri et al., 2016). ... 99
Figure 32 The top images visualize the working area of an automated wheel loader, while the bottom images visualize the progress of the work being done by the machine (Halbach & Halme, 2013). ... 100
Figure 33 The red line represents the recommended lifting path, while the red boxes represent collision warning and load sway warning (Fang & Cho, 2016) ... 101
Figure 34 The left image shows the augmented information on the windscreen and the right image shows the augmented information projected directly on the object of interest (Aromaa et al., 2020)... 102
Figure 35 The upper image shows the compactness level of newly paved asphalt, where red color and yellow color respectively mean the asphalt needs to be compacted three and two times more. The right image shows the temperature of the newly paved asphalt, which is visualized using the gradient color from red to blue (Vahdatikhaki et al., 2019) ... 102
Figure 17 Level of attention in different areas for the wheel loader. ... 58
Figure 18 Level of attention in different areas for the excavator. ... 59
Figure 19 Level of attention in different areas for articulated dump truck. ... 60
Figure 20 Trees that should be cut were marked with red paint (More, 2014) ... 75
Figure 21 Views from operator’s head ... 76
Figure 22 The operator moved the tree in a way where the tree’s diameter can be seen clearly from the front windscreen (Seppänen, 2017). ... 77
Figure 23 The operator was looking at the buttons on the armrest before pressing them (Forest Faun, 2013) ... 77
Figure 24 The operator was turning his body when reversing the forest harvester (Valmeciarz, 2017) ... 78
Figure 25 The operator put his foot on the dashboard while operating the forest harvester (InsaneLogging, 2015) ... 81
Figure 26 Photographs from some of the ideation sessions, using approaches such as mood boards, annotations, modelmaking, and sketching to explore possible use cases and visualizations for mixed reality interfaces. ... 88
Figure 27 Material from the design process ... 90
Figure 28 Material from the design process ... 91
Figure 29 The left image shows where the boom is not transparent and the right image shows where the boom is 80 % transparent (Aromaa et al., 2020) ... 98
Figure 30 A visualization of the environment around the machine. The blue line represents the crane's structure, while the point clouds represent the environment in front of the machine (Palonen et al., 2017). ... 98
Figure 31 Aiding the pickup of pallets using a forklift. Going under the pallet the forks are represented by blue virtual quads. The green line indicates the maximum depth that the forks can be moved to (Sarupuri et al., 2016). ... 99
Figure 32 The top images visualize the working area of an automated wheel loader, while the bottom images visualize the progress of the work being done by the machine (Halbach & Halme, 2013). ... 100
Figure 33 The red line represents the recommended lifting path, while the red boxes represent collision warning and load sway warning (Fang & Cho, 2016) ... 101
Figure 34 The left image shows the augmented information on the windscreen and the right image shows the augmented information projected directly on the object of interest (Aromaa et al., 2020)... 102
Figure 35 The upper image shows the compactness level of newly paved asphalt, where red color and yellow color respectively mean the asphalt needs to be compacted three and two times more. The right image shows the temperature of the newly paved asphalt, which is visualized using the gradient color from red to blue (Vahdatikhaki et al., 2019) ... 102
a red line which represents the recommended path and green areas which represent areas that have been treated (Santana-Fernández et
al., 2010) ... 103 Figure 37 The left image shows which object to pick. The middle image
illustrates the recommended route for navigating within the warehouse. The right image represents the destination where the object should be
placed (Pereira et al., 2016) ... 104 Figure 38 Example of instrumentation- related information that is presented
near the sightline (Akyeampong et al., 2014). ... 105 Figure 39 The image shows the view from the cabin operator’s position
when doing the cutting operation. The operator is supported by information from the bucking optimization system presented on a
head-up display, seen in pink in the middle of the image (Englund et al., 2015)... 106 Figure 40 Screenshots from the display ... 115 Figure 41 A map of the evaluation area with the starting point, the location
of the boxes as well as the three drop-off locations (A,B,C) ... 116 Figure 42 Boxplot of NASA-RTLX subscale results... 119 Figure 43 Sketches from the ideation of the simulator. ... 128 Figure 44 Picture showing the head-mounted projection display including a
smartphone, ... 129 Figure 45 Pictures of the simulator room with its components use for and a
user performing in it. ... 129 Figure 46 Architecture overview of the mixed reality simulator ... 130 Figure 47 PC-based simulator, with Bluetooth keyboard and directly
connected joystick ... 130 Figure 48 Top-down view on the digital obstacle course with colored key
elements ... 131 Figure 49 Boxplots of the results for question based on realism, immersion,
and naturalness of use between the compared simulators. ... 133 Figure 50 Boxplot for the question on the perceived effort to complete the
task in each simulator. Rated between 1-Very simple and 5-Very difficult. ... 133 Figure 51 Ideation and exploration into building the head-up diplay for the
evaluations. Trying different materials to use as combiners, how they handle color, and how to design the image source and combiner
display into the simulation environment. ... 140 Figure 52 Left: Schematic illustration of the cave setup. Right: Picture from
the operators’ position. ... 141 Figure 53 An overview of the components in the mixed reality simulator ... 142 Figure 54 Photo showing all three display solutions at once. (the
representation of the virtual world is here presented at the side for better photography possibilities) ... 142 Figure 55 A Top-down view of the virtual scenario, with key elements
colored. ... 143
a red line which represents the recommended path and green areas which represent areas that have been treated (Santana-Fernández et
al., 2010) ... 103 Figure 37 The left image shows which object to pick. The middle image
illustrates the recommended route for navigating within the warehouse. The right image represents the destination where the object should be
placed (Pereira et al., 2016) ... 104 Figure 38 Example of instrumentation- related information that is presented
near the sightline (Akyeampong et al., 2014). ... 105 Figure 39 The image shows the view from the cabin operator’s position
when doing the cutting operation. The operator is supported by information from the bucking optimization system presented on a
head-up display, seen in pink in the middle of the image (Englund et al., 2015)... 106 Figure 40 Screenshots from the display ... 115 Figure 41 A map of the evaluation area with the starting point, the location
of the boxes as well as the three drop-off locations (A,B,C) ... 116 Figure 42 Boxplot of NASA-RTLX subscale results... 119 Figure 43 Sketches from the ideation of the simulator. ... 128 Figure 44 Picture showing the head-mounted projection display including a
smartphone, ... 129 Figure 45 Pictures of the simulator room with its components use for and a
user performing in it. ... 129 Figure 46 Architecture overview of the mixed reality simulator ... 130 Figure 47 PC-based simulator, with Bluetooth keyboard and directly
connected joystick ... 130 Figure 48 Top-down view on the digital obstacle course with colored key
elements ... 131 Figure 49 Boxplots of the results for question based on realism, immersion,
and naturalness of use between the compared simulators. ... 133 Figure 50 Boxplot for the question on the perceived effort to complete the
task in each simulator. Rated between 1-Very simple and 5-Very difficult. ... 133 Figure 51 Ideation and exploration into building the head-up diplay for the
evaluations. Trying different materials to use as combiners, how they handle color, and how to design the image source and combiner
display into the simulation environment. ... 140 Figure 52 Left: Schematic illustration of the cave setup. Right: Picture from
the operators’ position. ... 141 Figure 53 An overview of the components in the mixed reality simulator ... 142 Figure 54 Photo showing all three display solutions at once. (the
representation of the virtual world is here presented at the side for better photography possibilities) ... 142 Figure 55 A Top-down view of the virtual scenario, with key elements
Figure 56 Questionnaire results regarding helpfulness and risk of missing
information ... 146 Figure 57 Evaluation result for the question regarding the perceived
readability of each display, where 1 is low readability and 5 high
readability. ... 147 Figure 58 Evaluation result for question regarding the perceived realism
experienced, where 1 is un-realistic and 5 is realistic. ... 147 Figure 59 To the left, a cabin with large windscreens for good visibility. To the
right, an example of a cabin with four displays covering the windscreen,
including one display which is not visible ... 153 Figure 60 Example of pencil sketches of navigational support as well as
warning notification for the operators ... 154 Figure 61 The symbols used to notify the operator in the simulated
environment. From left: human warning (shown with stop or warning),
stop, warning, navigation direction. ... 154 Figure 62 A bird view of the virtual scenario. ... 155 Figure 63 Overall NASA-RTLX workload ratings for each display type. ... 157 Figure 64 NASA-RTLX subscale result for each type of displays represented
with boxplots. ... 158 Figure 65 The amount of display glances for each evaluated display type. ... 160 Figure 66 Summed display glances for all users, divided in different parts of
the track. ... 161 Figure 67 Pictures from the operator interview where they expressed their
preferred placement of information in the form of general warning,
proximity, machine angle, load weight, and track rotation. ... 173 Figure 68 Illustration of cross-disciplinary generative connections. One type of
intermediate knowledge (represented by the dots) used for evaluation that is usually applied in one domain (represented by the ovals) is
applied in another domain to generate understanding. ... 189 Figure 69 Illustrations of two different ways to illustrate how different
perspectives on design have been used. A show it by marking a dot for each design cycle. Whereas B illustrates a radar chart to show levels of
focus or inclusion. ... 191 Figure 70 The line schematically show the movement back and forth during
design, bringing together different perspectives, being reflective and
actionable to the backtalk from the progress ... 192
Figure 56 Questionnaire results regarding helpfulness and risk of missing
information ... 146 Figure 57 Evaluation result for the question regarding the perceived
readability of each display, where 1 is low readability and 5 high
readability. ... 147 Figure 58 Evaluation result for question regarding the perceived realism
experienced, where 1 is un-realistic and 5 is realistic. ... 147 Figure 59 To the left, a cabin with large windscreens for good visibility. To the
right, an example of a cabin with four displays covering the windscreen,
including one display which is not visible ... 153 Figure 60 Example of pencil sketches of navigational support as well as
warning notification for the operators ... 154 Figure 61 The symbols used to notify the operator in the simulated
environment. From left: human warning (shown with stop or warning),
stop, warning, navigation direction. ... 154 Figure 62 A bird view of the virtual scenario. ... 155 Figure 63 Overall NASA-RTLX workload ratings for each display type. ... 157 Figure 64 NASA-RTLX subscale result for each type of displays represented
with boxplots. ... 158 Figure 65 The amount of display glances for each evaluated display type. ... 160 Figure 66 Summed display glances for all users, divided in different parts of
the track. ... 161 Figure 67 Pictures from the operator interview where they expressed their
preferred placement of information in the form of general warning,
proximity, machine angle, load weight, and track rotation. ... 173 Figure 68 Illustration of cross-disciplinary generative connections. One type of
intermediate knowledge (represented by the dots) used for evaluation that is usually applied in one domain (represented by the ovals) is
applied in another domain to generate understanding. ... 189 Figure 69 Illustrations of two different ways to illustrate how different
perspectives on design have been used. A show it by marking a dot for each design cycle. Whereas B illustrates a radar chart to show levels of
focus or inclusion. ... 191 Figure 70 The line schematically show the movement back and forth during
design, bringing together different perspectives, being reflective and
List of tables
Table 1 A few examples of digital support in three industries... 19 Table 2 Usability benefits of return on investment ... 25 Table 3 Percentage gaze time on vehicle display when performing
operation for the measured time ... 61 Table 4 Comparison of samples between the online video study and the five
prior field studies ... 72 Table 5 Replies from participants on their perception. ... 118 Table 7 Mean and standard deviation for the NASA-RTLX subscales. ... 119 Table 6 NASA-RTLX ratings for each user, one column per user, including the
mean mental workload for each user at the bottom. ... 119 Table 8 Number of responses in each scale value, as well as mean and
standard deviation, for the questions on immersion, realism, and
naturalness of use. ... 133 Table 9 Number of responses in each scale value, as well as mean and
standard deviation, for the question on perceived effort to completing
the task in the simulator. ... 133 Table 10 Number of responses in each scale value, as well as mean and
standard deviation, for the questions on helpfulness. ... 146 Table 11 Number of responses in each scale value, as well as mean and
standard deviation, for the questions of risk of missing information ... 146 Table 12 Number of responses in each scale value, as well as mean and
standard deviation, for the questions on readability ... 147 Table 13 Number of responses in each scale value, as well as mean and
standard deviation, for the questions on readability ... 147 Table 14 NASA-RTLX’s mean scores with standard deviation in parentheses. ... 157 Table 15 NASA-RTLX’s mean scores per category with standard deviation in
parentheses. ... 158 Table 16 Mean number of glances for each display type. ... 160 Table 17 Average glances for the different display types ... 161
1
Introduction
This thesis addresses two main perspectives. The primary perspective is the field of research; to explore visual display interaction in industrial vehicle and mobile machine environments, hereafter called heavy vehicles. The research results address this first perspective in the form of the publications incorporated in this hybrid-format thesis, which combines elements of a monograph and a collection of articles. The other perspective, which reflects upon and extends the first part, is on interaction design as an activity and discipline in the context of heavy vehicles. In the thesis, this perspective is presented as extensions, supplements, and further reflection on the previously published material. This perspective is both more practical and more reflective, based on my experiences gained during the research journey. My hope is that together these perspectives provide a contribution of knowledge to the application of interaction design in the heavy vehicle domain.
Studying the area of visual interaction in heavy vehicle environments is vital because functionality and innovation in today’s vehicles and machines are highly coupled to software, which is often interacted with through a visual interface. Vehicle interaction is subsequently increasingly a human-computer interaction, where the interaction is more, or less, purposely designed to be safe, efficient and satisfying. If we look into a related field, automotive, studies indicate that up to 40% of a car production cost is due to electronics and software (Broy, 2006). The human machine interface (HMI) in a car provided access to more than 700 functions by the early century (Wilkinson, 2002), and interaction in new vehicles often deploys multiple displays in their designs. A situation that for example, has resulted in a research focus
presented at major conferences2 as well as dedicated conferences3, on vehicle interaction.
The heavy vehicles domain is undergoing the same transition, with software being a major source for innovation and an increasingly relies on more visual and display-based interaction. Doug Oberhelman, the CEO of Caterpillar, one of the biggest manufacturers of construction vehicles, said at the Bauma4 fair in 2016 that they entered “The Age of Smart Iron” where “Digital Technology Designed to Transform Productivity, Efficiency and Safety on Job Sites” (Catepillar, 2016). With more functionality realized through electronics and software, it can be expected that more information will have to be presented to the operator. How this interaction is designed can affect the operator’s workload, the effort required to take in information and achieve an appropriate level of performance (Hart & Staveland, 1988).
The maneuvering of heavy vehicles is predominantly a secondary task with the primary task being the production and work performed by the equipment, for example material handling, excavation, or harvesting. This makes operator support in heavy vehicles very diverse in terms of applications, use cases, and information needed to complete the task. However, there are common themes across these different applications when it comes to the human machine interaction system’s purposes and the challenges faced; such as the right information provided at the right time, presentation of mission critical information, providing support on the work process for operators with a large variation in skill levels. Moreover, attention of the operator cannot be diverted from either the driving task nor from the working task for the operator to keep the situation awareness, the information needed for a full comprehension of what is happening and anticipation of what will happen (M. R. Endsley, 1995). This thesis will explore visual interaction for heavy vehicle operators from an interaction design perspective. It is done through studies of the situation of existing operators (users). The thesis presents some of the limitations faced today in different machine types, where the information presented on visual displays risks being unused or missed by the operator. The thesis will furthermore present prototyping and evaluation of designs to address this limitation by presenting information in an augmented/mixed reality approach, where the operator can see the information and the outside world simultaneously.
2 For example, CHI, ACM’s premiere conference in human computer Interaction held annually.
2019 they hosted both a workshop on vehicle interaction called “Looking into the Future: Weaving the Threads of Vehicle Automation” (https://ubisys.org/chi19ws-automation/) on and a paper session named Cars (http://chi2019.acm.org)
2
Thesis overview, included papers,
and contributions
This thesis is written as a hybrid-format thesis, meaning that chapters are based on material which has been disseminated in various ways, such as publications and position papers. The published material has been recompiled to reduce recurring information and additional material has been added with the ambition to provide a more homogenous and comprehensive thesis. The thesis is divided into five parts, forming a logical timeline for the thesis: "Introduction", "Gaining understanding", "Looking where there is nothing – into the transparent", "Realization and evaluation", and finally "Discussion and reflection". Each part consists of a number of chapters. The list below will shortly introduce these parts and chapters, as well as list the disseminated material they build on and my contribution to this material.
A Introduction
The first part will introduce the reader to the research and the heavy vehicle domain. Chapter 3 - “Aim and research questions” will provide the aim for this research and Chapter 4 - “Background & the why” will present motivation, how digital transformation leads to new challenges and opportunities for a well-designed interaction in heavy vehicles. This chapter incorporates new material, excerpts of introduction sections from the other papers included in the thesis, as well as material from:
A. Understanding the user in self-managing systems. Wallmyr, M., In
Proceedings of the 2015 European Conference on Software Architecture Workshops (ECSAW '15). ACM, New York, NY, USA,
DOI=10.1145/2797433.2797438
I was the sole contributor.
2
Thesis overview, included papers,
and contributions
This thesis is written as a hybrid-format thesis, meaning that chapters are based on material which has been disseminated in various ways, such as publications and position papers. The published material has been recompiled to reduce recurring information and additional material has been added with the ambition to provide a more homogenous and comprehensive thesis. The thesis is divided into five parts, forming a logical timeline for the thesis: "Introduction", "Gaining understanding", "Looking where there is nothing – into the transparent", "Realization and evaluation", and finally "Discussion and reflection". Each part consists of a number of chapters. The list below will shortly introduce these parts and chapters, as well as list the disseminated material they build on and my contribution to this material.
A Introduction
The first part will introduce the reader to the research and the heavy vehicle domain. Chapter 3 - “Aim and research questions” will provide the aim for this research and Chapter 4 - “Background & the why” will present motivation, how digital transformation leads to new challenges and opportunities for a well-designed interaction in heavy vehicles. This chapter incorporates new material, excerpts of introduction sections from the other papers included in the thesis, as well as material from:
A. Understanding the user in self-managing systems. Wallmyr, M., In
Proceedings of the 2015 European Conference on Software Architecture Workshops (ECSAW '15). ACM, New York, NY, USA,
DOI=10.1145/2797433.2797438