R R IV A L O F T H E T IP P IN G P O IN T O F S O LA R P H O TO V O LT A IC T EC H N O LO G Y 202 1 Ying Yang
Mälardalen University Press Dissertations No. 334
THE ARRIVAL OF THE TIPPING POINT OF
SOLAR PHOTOVOLTAIC TECHNOLOGY
Ying Yang 2021
School of Business, Society and Engineering
Mälardalen University Press Dissertations No. 334
THE ARRIVAL OF THE TIPPING POINT OF
SOLAR PHOTOVOLTAIC TECHNOLOGY
Ying Yang 2021
Copyright © Ying Yang, 2021 ISBN 978-91-7485-503-6 ISSN 1651-4238
Printed by E-Print AB, Stockholm, Sweden
Copyright © Ying Yang, 2021 ISBN 978-91-7485-503-6 ISSN 1651-4238
Mälardalen University Press Dissertations No. 334
THE ARRIVAL OF THE TIPPING POINT OF SOLAR PHOTOVOLTAIC TECHNOLOGY
Ying Yang
Akademisk avhandling
som för avläggande av filosofie doktorsexamen i industriell ekonomi och organisation vid Akademin för ekonomi, samhälle och teknik kommer att offentligen försvaras fredagen den 30 april 2021, 09.00 i R1-343 + (via Zoom), Mälardalens högskola, Västerås.
Fakultetsopponent: Professor Reinhard Madlener, RWTH Aachen University
Akademin för ekonomi, samhälle och teknik
Mälardalen University Press Dissertations No. 334
THE ARRIVAL OF THE TIPPING POINT OF SOLAR PHOTOVOLTAIC TECHNOLOGY
Ying Yang
Akademisk avhandling
som för avläggande av filosofie doktorsexamen i industriell ekonomi och organisation vid Akademin för ekonomi, samhälle och teknik kommer att offentligen försvaras fredagen den 30 april 2021, 09.00 i R1-343 + (via Zoom), Mälardalens högskola, Västerås.
Fakultetsopponent: Professor Reinhard Madlener, RWTH Aachen University
Abstract
Solar photovoltaic (PV) technology has become well-established for addressing both greenhouse gas emission reductions and regional air pollution. Rapid developments within the solar PV sector are still facing various technical barriers, economic impediments, and institutional barriers. The technical system innovations and their uses in society co-evolve with the engagement of multi-actors between scientific communities, users, investors, policymakers, and other stakeholders. Therefore, a holistic and interdisciplinary approach is called to analyze the complexities and solve the issues.
This doctoral thesis takes a social science perspective in conjunction with technical considerations. China is a major producer and market for solar PV. But it is still not clear that how economically competitive solar PV electricity is, compared with the traditional coal-fired power generation without subsidies. Compared with China, the energy transition in Sweden has been progressively proceeding, which enables it to build a low-carbon economy with the lowest share of fossil fuels in the primary energy supply. An interesting part is to explore how solar PV applications, along with smart city transformation, change the electricity market logic with the emerging of new actors. Further, it is vital to assess the potential availability of solar applications for policymaking and grid accommodation.
In this thesis, economic feasibility, grid party capability, and investment values in the market of China are modeled, calculated, and analyzed. The geographical and technical potential of solar PV applications is explored in Sweden. Also, based on a Service-Dominant logic perspective, the new players and their roles in the transformation of smart cities are explored, using the Swedish electricity market as an example. The results of the grid parity analysis show that distributed solar PV projects have reached a tipping point of cost-effectiveness, when solar PV can be guaranteed to be competitive with conventional power sources in the context of a subsidy-free in China. This also implies a gradual replacement of currently operating coal power plants. The investment return examination shows that profitability levels vary from city to city, taking into account local resource endowments and local economic conditions. By highlighting the flexibility issues associated with integrating a higher percentage of solar power, key performance indicators are presented to assess the performance of current individual technology components and combined system modules. Zooming out to the macro level, we show the theoretical explanation of how the Swedish electricity market is being changed by renewable energies and the emergence of new actors.
Acknowledgement
This doctoral thesis was conducted at the School of Business, Society and En-gineering, Mälardalen University, Västerås, Sweden. I gratefully acknowledge the financial support from the China Scholarship Council, and The Swedish (National) Research School of Management and Information Technology.
I would like to express my profound gratitude toward my supervisors Pro-fessor Jinyue Yan, Associate ProPro-fessor Peter Ekman, and ProPro-fessor Ulf An-dersson for the continuous support. Thank you for giving me the opportunity to pursue my Ph.D., and your invaluable guidance, support, and encourage-ment have been excellent! I am grateful that you fundaencourage-mentally challenged me on this journey and made it a truly rewarding experience.
My deep and sincere gratitude goes to my senior colleague and co-author Associate Professor Pietro Elia Campana for his continuous comments, guid-ance, and patience in reviewing my papers. Pietro, thank you for taking the time to help me, give constructive criticism and positive appreciation, and drive me to higher standards. I would like to pay tribute to Dr. Bengt Stridh and Dr. Yang Zhang, for their vast knowledge and comments, which led to the successful completion of my research work. I thank my fellow Ph.D. candi-dates at the School of Business, Society and Engineering. You have given to and shared in my time as a Ph.D. student. Special thanks are due to my admin-istrative colleagues for your seamless adminadmin-istrative support.
I acknowledge the friends from Agape and La Familia, who mean a lot to me, for accompanying me, feeding me, sharing life with me, and helping me grow in faith. My friends in China have also been a major source of support. I could not have made it through the journey on my own without them being aside. I would like to express my wholehearted gratitude to my friend Pelle. Your wisdom, warm-heartedness, and care carry a special depth to me.
I would like to give very special thanks to my parents, parents-in-law, and siblings for supporting me throughout this process and throughout my life in general. Thank you, my mom and dad, who have always given me the liberty to pursue what I desire with the selfless love and care. Ultimately, this would have been impossible without my husband and my best friend Johannes. You are always around at times with love. You are the one whom I can depend on, share hardships with, and celebrate each accomplishment with. Most im-portantly, I thank God for the numerous blessings He has bestowed upon me
Summary
Solar energy is one of the best options for meeting future energy needs be-cause of its advantages in terms of availability, accessibility, efficiency, and cost-effectiveness compared to many other energy sources. Solar photovoltaic (PV) technology has become well-established for addressing both greenhouse gas emission reductions and regional air pollution. As one of the main drivers of the energy transition, an in-depth understanding of the characteristics and economics of the solar industry is needed in order to integrate with policy interventions. Rapid developments within the solar technology sector are still facing various technical barriers, economic impediments, and institutional barriers. The technical system innovations and their uses in society co-evolve with the engagement of multi-actors between scientific communities, users, investors, policymakers, and other stakeholders. Therefore, a holistic and in-terdisciplinary approach is called to analyze the complexities and solve the issues.
This doctoral thesis takes a social science perspective in conjunction with technical considerations. In recent years, there has been growing concern about solar tariffs in China, not only as a major producer but also as a major market for solar PV. Advances in technology and declining costs have driven significant cuts in solar subsidies by the authorities. The cost of solar PV is influenced by many local factors, so it is a challenge to know whether China has reached the threshold for grid-connected solar PV systems to supply elec-tricity to end-users at the same price as grid-supplied elecelec-tricity or desulfu-rized coal electricity or even lower. Further raised question is how economi-cally competitive solar PV electricity is, compared with the traditional coal-fired power generation.
Compared with China, the energy transition in Sweden has been progres-sively proceeding, which enables it to build a low-carbon economy with the lowest share of fossil fuels in the primary energy supply. Sweden's energy transition has been achieved through information and communication technol-ogies, policy frameworks, and market instruments that have been able to fun-damentally change society and the actors within it. Smart cities are therefore relevant as a context for articulating the market transformation with regard to revising the understanding of actor roles, resources and business logic that is relevant for understanding the smart city transition. An interesting part is to explore how smart city transformation changes energy market logic with the emerging of new actors in the Swedish electricity market.
In this thesis, economic feasibility, grid party capability, and investment values in the market of China are modeled, calculated, and analyzed. The ge-ographical and technical potential of solar PV applications is explored in Swe-den. Also, based on a Service-Dominant logic perspective, the new players and their roles in the transformation of smart cities are explored, using the Swedish electricity market as an example. The results of the grid parity anal-ysis show that distributed solar PV projects have reached a tipping point of cost-effectiveness, when solar PV can be guaranteed to be competitive with conventional power sources in the context of a subsidy-free in China. This also implies a gradual replacement of currently operating coal power plants. The investment return examination shows that profitability levels vary from city to city, taking into account local resource endowments and local economic conditions. By highlighting the flexibility issues associated with integrating a higher percentage of solar power, key performance indicators are presented to assess the performance of current individual technology components and com-bined system modules. This is achieved by quantifying the system perfor-mance in four different categories, i.e. technical, economic, environmental, and social/policy. Zooming out to the macro level, it shows the theoretical explanation of how the Swedish electricity market is being changed by renew-able energies and the emergence of new actors.
In this thesis, economic feasibility, grid party capability, and investment values in the market of China are modeled, calculated, and analyzed. The ge-ographical and technical potential of solar PV applications is explored in Swe-den. Also, based on a Service-Dominant logic perspective, the new players and their roles in the transformation of smart cities are explored, using the Swedish electricity market as an example. The results of the grid parity anal-ysis show that distributed solar PV projects have reached a tipping point of cost-effectiveness, when solar PV can be guaranteed to be competitive with conventional power sources in the context of a subsidy-free in China. This also implies a gradual replacement of currently operating coal power plants. The investment return examination shows that profitability levels vary from city to city, taking into account local resource endowments and local economic conditions. By highlighting the flexibility issues associated with integrating a higher percentage of solar power, key performance indicators are presented to assess the performance of current individual technology components and com-bined system modules. This is achieved by quantifying the system perfor-mance in four different categories, i.e. technical, economic, environmental, and social/policy. Zooming out to the macro level, it shows the theoretical explanation of how the Swedish electricity market is being changed by renew-able energies and the emergence of new actors.
Sammanfattning
Solenergi är ett av de bästa alternativen för att tillgodose framtida energi-behov på grund av dess fördelar när det gäller tillgänglighet, tillgänglig-het, effektivitet och kostnadseffektivitet jämfört med många andra ener-gikällor. Solceller (PV) har blivit väletablerade för att hantera både mins-kade utsläpp av växthusgaser och regional luftförorening. Som en av de viktigaste drivkrafterna för energiövergången behövs en djupgående för-ståelse för solindustrins egenskaper och ekonomi för att integreras med politiska ingripanden. Den snabba utvecklingen inom soltekniksektorn står fortfarande inför olika tekniska hinder, ekonomiska hinder och in-stitutionella hinder. De tekniska systeminnovationerna och deras använd-ning i samhället utvecklas tillsammans med engagemanget av flera aktö-rer mellan vetenskapssamhällen, användare, investerare, beslutsfattare och andra intressenter. Därför kallas ett holistiskt och tvärvetenskapligt tillvägagångssätt för att analysera komplexiteten och lösa problemen.
Denna doktorsavhandling tar ett samhällsvetenskapligt perspektiv i samband med tekniska lösningar. Under de senaste åren har det funnits en växande oro kring ökat oro kring solavgifter i Kina, inte bara som en stor producent utan också som en stor marknad för solceller. Framsteg inom teknik och sjunkande kostnader har lett till betydande minskningar av sol-bidragen från myndigheter. Kostnaden för solceller påverkas av många lokala faktorer, så det är en utmaning att veta om Kina har nått tröskeln för nätanslutna solcellssystem att leverera el till slutanvändare till samma pris som elnätet eller avsvavlat kol el eller ännu lägre. Ytterligare en upp-dragen fråga är hur ekonomiskt konkurrenskraftig solcellsenergi är jäm-fört med traditionell koleldad kraftproduktion.
Jämfört med Kina har energiövergången i Sverige successivt fortgått, vilket gör det möjligt att bygga en koldioxidsnål ekonomi med den lägsta andelen fossila bränslen i primärenergiförsörjningen. Sveriges energiö-vergång har uppnåtts genom informations- och kommunikationsteknik, policyramar och marknadsinstrument som har kunnat förändra samhället och aktörerna inom det. Smarta städer är därför relevanta som ett sam-manhang för att formulera marknadsomvandlingen när det gäller att revi-dera förståelsen för aktörsroller, resurser och affärslogik som är relevant för att förstå smartstadens övergång. En intressant del är att utforska hur smart stadsomvandling förändrar energimarknadslogiken med nya aktö-rer på den svenska elmarknaden.
I denna avhandling modelleras, beräknas och analyseras ekonomisk genomförbarhet, kapacitet för rutnät och investeringsvärden på Kinas marknad. Den geografiska och tekniska potentialen för solcelleanlägg-ningar undersöks i Sverige. Baserat på ett Service-Dominant logikper-spektiv utforskas också de nya aktörerna och deras roller i omvandlingen av smarta städer med den svenska elmarknaden som ett exempel. Resul-taten av nätparitetsanalysen visar att distribuerade solcellsprojekt har nått en brytpunkt för kostnadseffektivitet när solceller kan garanteras vara konkurrenskraftiga med konventionella kraftkällor i samband med fria subventioner Kina. Detta innebär också en gradvis ersättning av nuva-rande kolkraftverk. Investeringens avkastningsundersökning visar att lön-samhetsnivåerna varierar från stad till stad med hänsyn till lokala resurser och lokala ekonomiska förhållanden. Genom att lyfta fram de flexibili-tetsproblem som är förknippade med att integrera en högre andel solkraft presenteras viktiga prestandaindikatorer för att bedöma prestandan hos nuvarande enskilda teknikkomponenter och kombinerade systemmodu-ler. Detta uppnås genom att kvantifiera systemets prestanda i fyra olika kategorier, dvs. teknisk, ekonomisk, miljömässig och social/politik. Ge-nom att zooma ut till makronivå visar det den teoretiska förklaringen till hur den svenska elmarknaden förändras genom förnybar energi och fram-växten av nya aktörer.
I denna avhandling modelleras, beräknas och analyseras ekonomisk genomförbarhet, kapacitet för rutnät och investeringsvärden på Kinas marknad. Den geografiska och tekniska potentialen för solcelleanlägg-ningar undersöks i Sverige. Baserat på ett Service-Dominant logikper-spektiv utforskas också de nya aktörerna och deras roller i omvandlingen av smarta städer med den svenska elmarknaden som ett exempel. Resul-taten av nätparitetsanalysen visar att distribuerade solcellsprojekt har nått en brytpunkt för kostnadseffektivitet när solceller kan garanteras vara konkurrenskraftiga med konventionella kraftkällor i samband med fria subventioner Kina. Detta innebär också en gradvis ersättning av nuva-rande kolkraftverk. Investeringens avkastningsundersökning visar att lön-samhetsnivåerna varierar från stad till stad med hänsyn till lokala resurser och lokala ekonomiska förhållanden. Genom att lyfta fram de flexibili-tetsproblem som är förknippade med att integrera en högre andel solkraft presenteras viktiga prestandaindikatorer för att bedöma prestandan hos nuvarande enskilda teknikkomponenter och kombinerade systemmodu-ler. Detta uppnås genom att kvantifiera systemets prestanda i fyra olika kategorier, dvs. teknisk, ekonomisk, miljömässig och social/politik. Ge-nom att zooma ut till makronivå visar det den teoretiska förklaringen till hur den svenska elmarknaden förändras genom förnybar energi och fram-växten av nya aktörer.
List of Papers
This thesis is based on the following papers, which are referred to in the text by their Roman numerals.
I Yan J, Yang Y*, Campana PE, He J. City-level analysis of sub-sidy-free solar photovoltaic electricity price, profits and grid par-ity in China. Nature Energy. 2019 Aug;4(8):709-17.
II Yang Y*, Campana PE, Yan J. Potential of unsubsidized
distrib-uted solar PV to replace coal-fired power plants, and profits clas-sification in Chinese cities. Renewable and Sustainable Energy
Reviews. 2020 Oct 1;131:109967.
III Ekman P, Röndell J, Yang Y. Exploring smart cities and market transformations from a Service-Dominant logic perspective.
Sus-tainable Cities and Society. 2019 Jul 25:101731.
IV Yang Y*, Jurasz J, Li H, Syrri A, Yan J. Key performance
indi-cators on flexibility of a multi-energy system. Applied Energy
Symposium: Low carbon cities and urban energy systems (CUE).
2019 Oct, Xiamen University, Fujian, China.
V Yang Y*, Campana PE, Stridh B, Yan J. Potential analysis of
roof-mounted solar photovoltaics in Sweden. Applied Energy. 2020 Dec 1;279:115786.
List of papers not included in this thesis
VI Yang Y, Zhang Y, Campana PE, Yan J. Peak-shaving and profit-sharing model by Aggregators in residential buildings with PV: a case study in Eskilstuna, Sweden. Energy Procedia. 2017 Dec 1;142:3182-93.
VII Zhang Y, Campana PE, Yang Y, Stridh B, Lundblad A, Yan J. Energy flexibility from the consumer: Integrating local electric-ity and heat supplies in a building. Applied Energy. 2018 Aug 1;223:430-42.
VIII Zhang Y, Campana PE, Yang Y, Lundblad A, Yan J. Energy flexibility through the integrated energy supply system in build-ings: a case study in Sweden. Energy Procedia. 2018 Jul 1;145:564-9.
IX Yang Y, Yan J. Potential roof area for photovoltaics in a Swedish municipality. Applied Energy Symposium: MIT A+B, 2019 May, Massachusetts Institute of Technology, Cambridge, USA. X Syrri ALA, Bindner H, Li H, Jurasz J, Yan J, Yang Y. KPIs and
assessment procedure. European Union’s Horizon 2020 research
and innovation programme under grant agreement No 774309.
Ref. Ares(2019)3992146 - 24/06/2019.
IX Yang Y, Yan J. Potential roof area for photovoltaics in a Swedish municipality. Applied Energy Symposium: MIT A+B, 2019 May, Massachusetts Institute of Technology, Cambridge, USA. X Syrri ALA, Bindner H, Li H, Jurasz J, Yan J, Yang Y. KPIs and
assessment procedure. European Union’s Horizon 2020 research
and innovation programme under grant agreement No 774309.
Contents
Acknowledgement ...ii
Summary ... iii
Sammanfattning ... v
List of Papers ...vii
List of Figures ... xi
List of Tables ...xii
Abbreviations ... xiii
Symbols ... xiv
1 Introduction ... 1
1.1 Background ... 1
1.2 Research gaps and challenges ... 4
1.3 Scope and objectives ... 6
1.4 Thesis contributions ... 6
1.5 Thesis structure ... 7
2 Previous studies ... 9
2.1 Subsidy and economics in solar PV industry ... 9
2.1.1 Policy and subsidy in Chinese solar PV industry ... 9
2.1.2 Subsidy and economic analysis in the literatures ... 10
2.2 Flexibility in the electricity system ... 13
2.3 New market actor - aggregator ... 15
2.4 Service-Dominant logic ... 18
2.5 The geographical and technical potential availability ... 21
3 Methods ... 24
3.1 Economic viability indices ... 24
3.1.1 Levelized Cost of Electricity and cost crossover ... 24
3.1.2 Levelized Profit of Electricity and other three indices ... 25
3.1.3 Grid parity indices ... 26
3.2 Monte Carlo Analysis ... 27
3.3 K-means clustering algorithm ... 27
Contents
Acknowledgement ...iiSummary ... iii
Sammanfattning ... v
List of Papers ...vii
List of Figures ... xi
List of Tables ...xii
Abbreviations ... xiii
Symbols ... xiv
1 Introduction ... 1
1.1 Background ... 1
1.2 Research gaps and challenges ... 4
1.3 Scope and objectives ... 6
1.4 Thesis contributions ... 6
1.5 Thesis structure ... 7
2 Previous studies ... 9
2.1 Subsidy and economics in solar PV industry ... 9
2.1.1 Policy and subsidy in Chinese solar PV industry ... 9
2.1.2 Subsidy and economic analysis in the literatures ... 10
2.2 Flexibility in the electricity system ... 13
2.3 New market actor - aggregator ... 15
2.4 Service-Dominant logic ... 18
2.5 The geographical and technical potential availability ... 21
3 Methods ... 24
3.1 Economic viability indices ... 24
3.1.1 Levelized Cost of Electricity and cost crossover ... 24
3.1.2 Levelized Profit of Electricity and other three indices ... 25
3.1.3 Grid parity indices ... 26
3.2 Monte Carlo Analysis ... 27
3.4 Case study and questionnaire survey ... 30
3.4.1 Case study ... 30
3.4.2 Questionnaire survey ... 31
3.5 Potential availability analysis ... 32
3.5.1 Usable roof area estimation ... 33
3.5.2 Configurations of PV module and energy conversion ... 34
4 Results ... 37
4.1 Grid parity of user-side and plant-side (Paper I) ... 37
4.2 Investment profitability (Paper I & II) ... 38
4.3 Electricity market in transformation (Paper III) ... 43
4.3.1 The traditional linear value chain market logic ... 43
4.3.2 The networked market and an emerging new role - aggregator . 46 4.4 Selected key performance indicators (Paper IV) ... 48
4.5 Potential availability analysis (Paper V) ... 50
5 Discussions and policy implications ... 55
5.1 “Soft” cost ... 55 5.2 “Additional cost” ... 57 5.3 Self-consumption rate ... 58 5.4 Capital subsidy ... 59 6 Conclusions ... 62 7 Future work... 66 References ... 67
List of Figures
Figure 1. Schematic diagram showing the relationship between the research
topics and the papers. ... 6
Figure 2. Historical policies and installed capacity of China's solar PV industry. ... 10
Figure 3. The narrative and process of S-D logic. ... 19
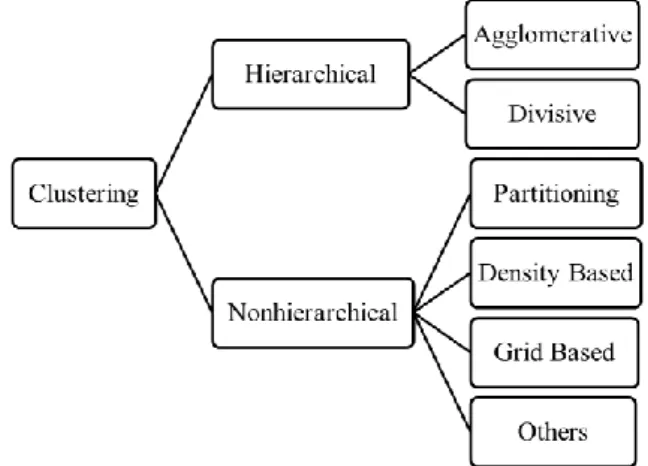
Figure 4. Categorization of clustering algorithms. ... 28
Figure 5. K-means clustering algorithm procedure in Paper II. ... 29
Figure 6. Summary of KPI categories, stakeholders and their roles. ... 31
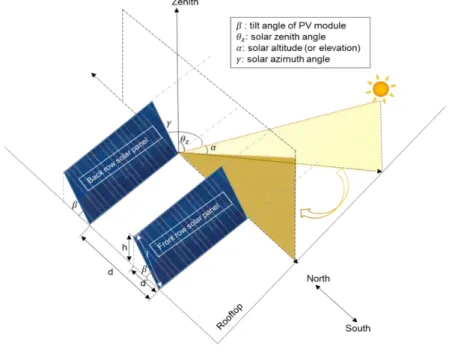
Figure 7. Schematic diagram of the required distance between rows of solar panels in scenario A. ... 35
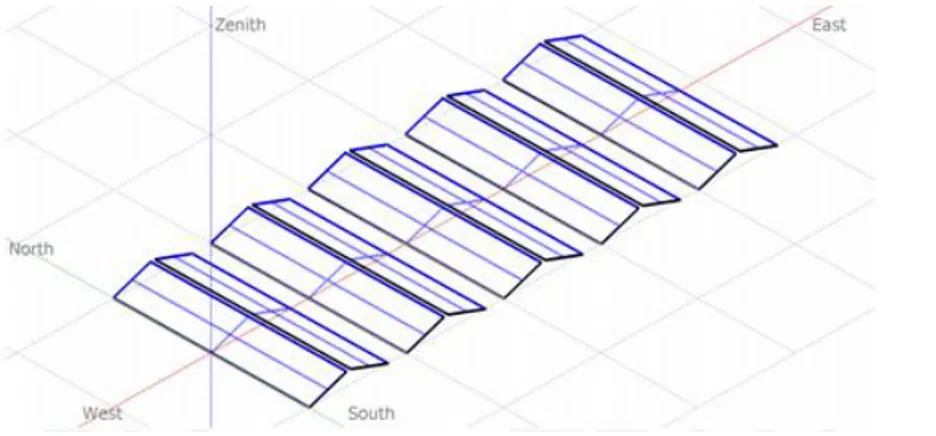
Figure 8. East-West orientation configuration with a low tilt angle in scenario C. ... 36
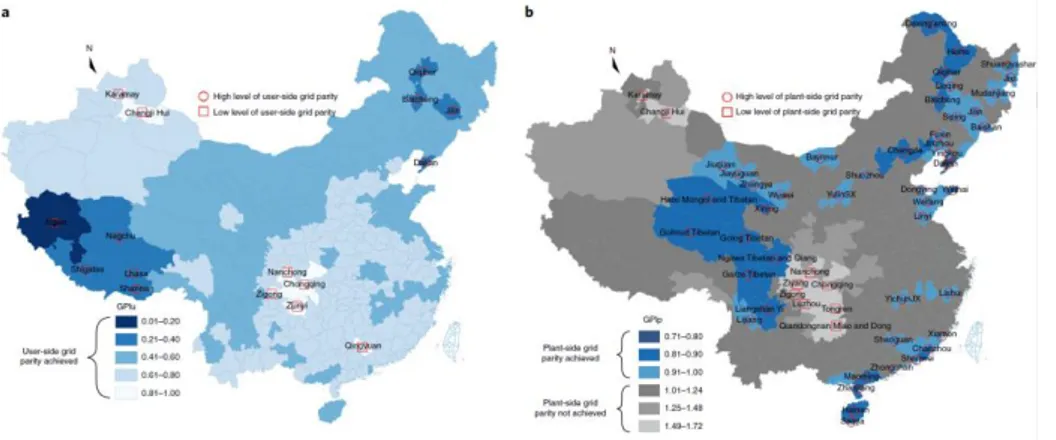
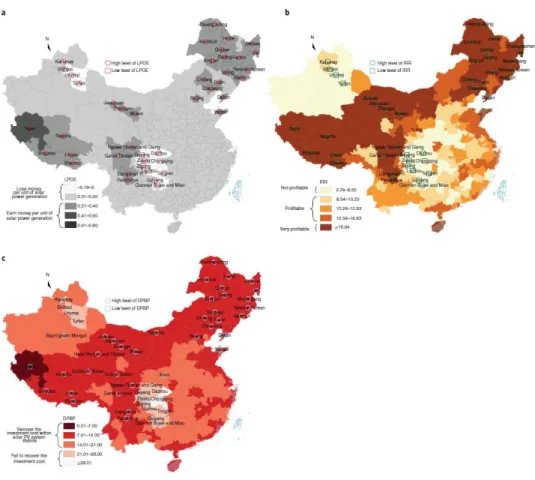
Figure 9. Grid Parity Indices for distributed PV projects in 344 cities without subsidies. ... 38
Figure 10. Economic feasibility and profitability of solar PV in 344 cities without subsidies. ... 39
Figure 11. Current running coal-fired power plants cost-risk levels and city number percent in China and the US. ... 40
Figure 12. The four cost-risk levels of current coal-fired power plants and their corresponding cities in China. ... 41
Figure 13. Four city clusters of distributed solar PV investment-profits. ... 42
Figure 14. A simplified illustration of the Swedish energy system’s traditional linear value chain market logic. ... 45
Figure 15. A future smart and dynamic networked market logic. ... 47
Figure 16. The percent of electricity losses using different row distances and tilt angles due to mutual shading. ... 51
Figure 17. The potential area for roof-mounted solar PV systems (a), and the potential installed capacity on pitched roofs and flat roofs with three scenarios (b-d). ... 53
Figure 18. Different self-consumption rates of 0%, 25%, 50%, 75% and 100% impact economic performances. ... 59
Figure 19. The historical direct subsidy percent and the budgets for solar industry. ... 60
List of Figures
Figure 1. Schematic diagram showing the relationship between the research topics and the papers. ... 6Figure 2. Historical policies and installed capacity of China's solar PV industry. ... 10
Figure 3. The narrative and process of S-D logic. ... 19
Figure 4. Categorization of clustering algorithms. ... 28
Figure 5. K-means clustering algorithm procedure in Paper II. ... 29
Figure 6. Summary of KPI categories, stakeholders and their roles. ... 31
Figure 7. Schematic diagram of the required distance between rows of solar panels in scenario A. ... 35
Figure 8. East-West orientation configuration with a low tilt angle in scenario C. ... 36
Figure 9. Grid Parity Indices for distributed PV projects in 344 cities without subsidies. ... 38
Figure 10. Economic feasibility and profitability of solar PV in 344 cities without subsidies. ... 39
Figure 11. Current running coal-fired power plants cost-risk levels and city number percent in China and the US. ... 40
Figure 12. The four cost-risk levels of current coal-fired power plants and their corresponding cities in China. ... 41
Figure 13. Four city clusters of distributed solar PV investment-profits. ... 42
Figure 14. A simplified illustration of the Swedish energy system’s traditional linear value chain market logic. ... 45
Figure 15. A future smart and dynamic networked market logic. ... 47
Figure 16. The percent of electricity losses using different row distances and tilt angles due to mutual shading. ... 51
Figure 17. The potential area for roof-mounted solar PV systems (a), and the potential installed capacity on pitched roofs and flat roofs with three scenarios (b-d). ... 53
Figure 18. Different self-consumption rates of 0%, 25%, 50%, 75% and 100% impact economic performances. ... 59
Figure 19. The historical direct subsidy percent and the budgets for solar industry. ... 60
List of Tables
Table 1. The S-D logic foundational premises. ... 18 Table 2. Summary results of statistical parameters. (T: technology, En:
environmental, Ec: economics, S/P: social/policy) ... 48 Table 3. Five most important KPIs without categories. ... 49 Table 4. The selected KPIs from the questionnaire analysis in different
categories. ... 49 Table 5. The usable area, potential installed capacity, and electricity
generation for pitched roofs. ... 50 Table 6. The usable area, potential installed capacity, and electricity
generation for flat roofs in three scenarios. ... 52
List of Tables
Table 1. The S-D logic foundational premises. ... 18 Table 2. Summary results of statistical parameters. (T: technology, En:
environmental, Ec: economics, S/P: social/policy) ... 48 Table 3. Five most important KPIs without categories. ... 49 Table 4. The selected KPIs from the questionnaire analysis in different
categories. ... 49 Table 5. The usable area, potential installed capacity, and electricity
generation for pitched roofs. ... 50 Table 6. The usable area, potential installed capacity, and electricity
Abbreviations
BiPV Building Integrated with Photovoltaics CF cash flow
CV coefficient of variation
DCB desulfurized coal benchmark price DPBP discounted payback period
DSM digital surface models DSO distribution system operator DR demand response
EV electric vehicle FiT feed-in tariff
FP foundational premise GHG greenhouse gasses
GIS Geographic Information System GPIp grid parity index of the plant-side
GPIu grid parity index of the user-side
ICT information and communications technology IRR internal rate of return
I&C industrial and commercial KPI key performance indicator LCOE levelized cost of electricity LiDAR Light Detection and Ranging LPOE levelized profit of electricity MCA Monte Carlo Analysis
MP electricity market purchasing price
NDRC National Development and Reform Commission NEA National Energy Administration
NPV net present value PF Packing Factor PV photovoltaic STD standard deviation S-D Service-Dominant
TSO transmission system operator VAT Value-added Tax
ZIP Zoning Improvement Plan
Abbreviations
BiPV Building Integrated with Photovoltaics CF cash flow
CV coefficient of variation
DCB desulfurized coal benchmark price DPBP discounted payback period
DSM digital surface models DSO distribution system operator DR demand response
EV electric vehicle FiT feed-in tariff
FP foundational premise GHG greenhouse gasses
GIS Geographic Information System GPIp grid parity index of the plant-side
GPIu grid parity index of the user-side
ICT information and communications technology IRR internal rate of return
I&C industrial and commercial KPI key performance indicator LCOE levelized cost of electricity LiDAR Light Detection and Ranging LPOE levelized profit of electricity MCA Monte Carlo Analysis
MP electricity market purchasing price
NDRC National Development and Reform Commission NEA National Energy Administration
NPV net present value PF Packing Factor PV photovoltaic STD standard deviation S-D Service-Dominant
TSO transmission system operator VAT Value-added Tax
Symbols
a , b the 𝑎𝑡ℎ and 𝑏𝑡ℎ iteration (a ≠ b)
A𝑟𝑜𝑜𝑓 surface roof area (𝑘𝑚2)
𝐴𝑏𝑎𝑠𝑒 base area (𝑘𝑚2)
𝐴𝑏𝑎𝑠𝑒𝑚 building base area of the 𝑚𝑡ℎ municipality (𝑚2)
𝐴𝑝𝑣𝑆𝐸 usable area for roof-mounted PV systems in Sweden (𝑘𝑚2)
𝑐𝑘(𝑎) , 𝑐𝑘(𝑏) the cluster k at 𝑎𝑡ℎ or 𝑏𝑡ℎ iteration 𝐶𝐹0 initial investment 𝐶𝐹1, 𝐶𝐹2, … 𝐶𝐹𝑡 cash flow of year 1, 2, … , 𝑡 𝐶1(1),
𝐶2(1), …,𝐶4(1)
the center for initial cluster 1, 2, …, 4
𝑑 distance between the front row and the back row of PV panels (meter)
d(p, q) the Euclidean Distance 𝑘 the 𝑘𝑡ℎ cluster, k =1,2,...,4
𝑙 width of a solar PV panel (meter) 𝑚 length of the ridge (meter) m(p, q) the Mahalanobis Distance mu municipality, mu = 1,2,3 … ,290 𝑁𝑣𝑜𝑡𝑒 normalized numbers of votes 𝑁𝐶𝑉 normalized Coefficient of Variation 𝑝 length of counter beam (meter) 𝑞 length of the hanging beam (meter) 𝑟 discount rate for 𝑡 (%) 𝑟𝑓𝑙𝑎 orientation role for flat roofs
𝑟𝑛_𝑝𝑖𝑡 orientation role for not-applicable orientations 𝑟𝑢_𝑝𝑖𝑡 orientation role for applicable orientations
𝑅𝑓𝑙𝑎 flat roof percentage (%) 𝑅𝑛_𝑝𝑖𝑡 not-applicable orientations for solar PV installations (%)
𝑅𝑢_𝑝𝑖𝑡 applicable orientations for solar PV installations (%)
Symbols
a , b the 𝑎𝑡ℎ and 𝑏𝑡ℎ iteration (a ≠ b)
A𝑟𝑜𝑜𝑓 surface roof area (𝑘𝑚2)
𝐴𝑏𝑎𝑠𝑒 base area (𝑘𝑚2)
𝐴𝑏𝑎𝑠𝑒𝑚 building base area of the 𝑚𝑡ℎ municipality (𝑚2)
𝐴𝑝𝑣𝑆𝐸 usable area for roof-mounted PV systems in Sweden (𝑘𝑚2)
𝑐𝑘(𝑎) , 𝑐𝑘(𝑏) the cluster k at 𝑎𝑡ℎ or 𝑏𝑡ℎ iteration 𝐶𝐹0 initial investment 𝐶𝐹1, 𝐶𝐹2, … 𝐶𝐹𝑡 cash flow of year 1, 2, … , 𝑡 𝐶1(1),
𝐶2(1), …,𝐶4(1)
the center for initial cluster 1, 2, …, 4
𝑑 distance between the front row and the back row of PV panels (meter)
d(p, q) the Euclidean Distance 𝑘 the 𝑘𝑡ℎ cluster, k =1,2,...,4
𝑙 width of a solar PV panel (meter) 𝑚 length of the ridge (meter) m(p, q) the Mahalanobis Distance mu municipality, mu = 1,2,3 … ,290 𝑁𝑣𝑜𝑡𝑒 normalized numbers of votes 𝑁𝐶𝑉 normalized Coefficient of Variation 𝑝 length of counter beam (meter) 𝑞 length of the hanging beam (meter) 𝑟 discount rate for 𝑡 (%) 𝑟𝑓𝑙𝑎 orientation role for flat roofs
𝑟𝑛_𝑝𝑖𝑡 orientation role for not-applicable orientations 𝑟𝑢_𝑝𝑖𝑡 orientation role for applicable orientations
𝑅𝑓𝑙𝑎 flat roof percentage (%) 𝑅𝑛_𝑝𝑖𝑡 not-applicable orientations for solar PV installations (%)
𝑅𝑠, 𝑅𝑠𝑤,
𝑅𝑠𝑒, 𝑅𝑤, 𝑅𝑒
orientation of South, South West, South East, West, and East, re-spectively (%)
𝑡 the year t
𝑇 life of the project (years) 𝑈𝑜𝑟𝑖 utilization factor of orientation 𝑈𝑜𝑟𝑖𝑖𝑛𝑑 utilization factor of orientation for industrial buildings 𝑈𝑜𝑟𝑖𝑛𝑜𝑛_𝑖𝑛𝑑 utilization factor of orientation for non-industrial buildings 𝑈𝑠𝑜 utilization factor due to shadows and obstacles 𝑈𝑠𝑜𝑖𝑛𝑑 utilization factor due to shadows and obstacles for industrial
build-ings
𝑈𝑠𝑜𝑛𝑜_𝑖𝑛𝑑 utilization factor due to shadows and obstacles for non-industrial buildings
𝑈𝑎𝑏𝑠𝑖𝑛𝑑 percent of absolute reduction on industrial buildings 𝑈𝑎𝑏𝑠𝑛𝑜𝑛_𝑖𝑛𝑑 percent of absolute reduction on non-industrial buildings 𝑥1, 𝑥2, … , 𝑥𝑘 risk factors for Monte Carlo Analysis 𝑥𝑝𝑖, 𝑥𝑞𝑖 p, q are any two points, p, q =1,2,…,344. i is the dimension (i.e.
LPOE, NPV, IRR, and DPBP), i =1,2,…,4
𝑌 financial indicators of investment projects 𝑍 the calculated KPI value 𝛼 solar altitude (or elevation) angle (°) 𝛼𝑟𝑜𝑜𝑓 slope angle of the roof (°) 𝛼𝑓𝑙𝑎𝑡 slope angle of the flat roofs (°) 𝛼𝑝𝑖𝑡 slope angle of the pitched roofs (°) 𝛽 tilt angle of PV module (°) 𝛽𝑜𝑝𝑡 optimal tilt angle of PV module (°) in scenario A
𝜃𝑧 solar zenith angle (°)
𝛾 solar azimuth angle (°) 𝛿 earth’s declination (°) 𝜙 latitude (°) 𝜔 hour angle (°) 𝜎 the standard deviation
𝜇 the mean
𝑅𝑠, 𝑅𝑠𝑤,
𝑅𝑠𝑒, 𝑅𝑤, 𝑅𝑒
orientation of South, South West, South East, West, and East, re-spectively (%)
𝑡 the year t
𝑇 life of the project (years) 𝑈𝑜𝑟𝑖 utilization factor of orientation 𝑈𝑜𝑟𝑖𝑖𝑛𝑑 utilization factor of orientation for industrial buildings 𝑈𝑜𝑟𝑖𝑛𝑜𝑛_𝑖𝑛𝑑 utilization factor of orientation for non-industrial buildings 𝑈𝑠𝑜 utilization factor due to shadows and obstacles 𝑈𝑠𝑜𝑖𝑛𝑑 utilization factor due to shadows and obstacles for industrial
build-ings
𝑈𝑠𝑜𝑛𝑜_𝑖𝑛𝑑 utilization factor due to shadows and obstacles for non-industrial buildings
𝑈𝑎𝑏𝑠𝑖𝑛𝑑 percent of absolute reduction on industrial buildings 𝑈𝑎𝑏𝑠𝑛𝑜𝑛_𝑖𝑛𝑑 percent of absolute reduction on non-industrial buildings 𝑥1, 𝑥2, … , 𝑥𝑘 risk factors for Monte Carlo Analysis 𝑥𝑝𝑖, 𝑥𝑞𝑖 p, q are any two points, p, q =1,2,…,344. i is the dimension (i.e.
LPOE, NPV, IRR, and DPBP), i =1,2,…,4
𝑌 financial indicators of investment projects 𝑍 the calculated KPI value 𝛼 solar altitude (or elevation) angle (°) 𝛼𝑟𝑜𝑜𝑓 slope angle of the roof (°) 𝛼𝑓𝑙𝑎𝑡 slope angle of the flat roofs (°) 𝛼𝑝𝑖𝑡 slope angle of the pitched roofs (°) 𝛽 tilt angle of PV module (°) 𝛽𝑜𝑝𝑡 optimal tilt angle of PV module (°) in scenario A
𝜃𝑧 solar zenith angle (°)
𝛾 solar azimuth angle (°) 𝛿 earth’s declination (°) 𝜙 latitude (°) 𝜔 hour angle (°) 𝜎 the standard deviation
1
Introduction
This chapter presents the background of the study, the research questions for-mulated based on the research gaps, scope and objectives, contributions, and the structure of the thesis. The relationship between the research topics and the papers is also described.
1.1 Background
Human concerns about fossil fuel depletion, energy security, and environmen-tal degradation have led to an increasing demand for renewable energy sources. Currently, fossil fuels still account for 87% of the global primary sup-ply, but the overall share of renewable energy is about to reach 10% (Armaroli and Balzani, 2016). Solar energy is considered to be a non-polluting, reliable, and clean energy source. The adoption of solar energy technology has signif-icantly alleviated and mitigated the problems associated with air pollutants and greenhouse gas emissions compared to fossil fuel-based power genera-tion. Solar photovoltaic (PV) technology, as one of the emerging technologies, has received increasing attention from academia and industry.
The energy transition is a pathway toward the transformation of the global energy sector which requires urgent action on a global scale. Some countries, such as China and Sweden, are expected to take the lead on the global efforts to achieve clean energy and greenhouse gas emissions reduction. China has made energy transition a long-term strategy and achieved consistent and meas-urable progress over the past years. Whereas, Sweden is helping lead the way and is for the third year in a row ranked number one in the global Energy Transition Index (Bocca, 2020). For China, it is imperative to explore the eco-nomic viability of unsubsidized solar energy and the profitability of invest-ments to assess the inclusion of renewables. At the other end of the spectrum, Sweden is faced with the integration of renewable energy into the current en-ergy market and the transition to smart cities. In Sweden, a new era of power systems marked by large-scale renewables is dawning. The energy transition will be achieved through information and communication technology (ICT), smart technologies, policy frameworks, and market instruments that can fun-damentally change society and the players in it. In the regional evaluation, Sweden scored high in several relevant areas such as innovativeness,
infor-1
Introduction
This chapter presents the background of the study, the research questions for-mulated based on the research gaps, scope and objectives, contributions, and the structure of the thesis. The relationship between the research topics and the papers is also described.
1.1 Background
Human concerns about fossil fuel depletion, energy security, and environmen-tal degradation have led to an increasing demand for renewable energy sources. Currently, fossil fuels still account for 87% of the global primary sup-ply, but the overall share of renewable energy is about to reach 10% (Armaroli and Balzani, 2016). Solar energy is considered to be a non-polluting, reliable, and clean energy source. The adoption of solar energy technology has signif-icantly alleviated and mitigated the problems associated with air pollutants and greenhouse gas emissions compared to fossil fuel-based power genera-tion. Solar photovoltaic (PV) technology, as one of the emerging technologies, has received increasing attention from academia and industry.
The energy transition is a pathway toward the transformation of the global energy sector which requires urgent action on a global scale. Some countries, such as China and Sweden, are expected to take the lead on the global efforts to achieve clean energy and greenhouse gas emissions reduction. China has made energy transition a long-term strategy and achieved consistent and meas-urable progress over the past years. Whereas, Sweden is helping lead the way and is for the third year in a row ranked number one in the global Energy Transition Index (Bocca, 2020). For China, it is imperative to explore the eco-nomic viability of unsubsidized solar energy and the profitability of invest-ments to assess the inclusion of renewables. At the other end of the spectrum, Sweden is faced with the integration of renewable energy into the current en-ergy market and the transition to smart cities. In Sweden, a new era of power systems marked by large-scale renewables is dawning. The energy transition will be achieved through information and communication technology (ICT), smart technologies, policy frameworks, and market instruments that can fun-damentally change society and the players in it. In the regional evaluation, Sweden scored high in several relevant areas such as innovativeness,
infor-and Hockerts, 2015), which makes it a suitable environment for understinfor-anding the smart city transition.
China is strongly committed to reducing CO2 emissions from power geration by building and deploying renewable energy sources such as solar en-ergy. As part of the Paris Agreement commitment, China has set a target to increase the share of renewable energy and non-fossil fuel energy consump-tion to 15% by 2020 and 20% by 2030 (Liu et al., 2018). In regards to the decarbonization of China’s power system, renewable energy will account for 27% of China's total power generation by 2020 (Gosens, Kåberger and Wang, 2017) (National Development and Reform Commission (NDRC) and National Energy Administration (NEA), 2016). Remarkable progress has been made in this by deploying 23%-33% renewable energy in the electricity mix during the first three quarters of 2020 (International Energy Agency (IEA), 2020). Dur-ing the same period, the electricity demand increased by 1.3%, and solar PV power generation increased by 16.9%, regardless of the pandemic lockdown measures being putting (National Energy Agency (NEA), 2020). The propor-tion of solar PV electricity is increasing substantially every year, although it still provides a relatively small share. China is the largest manufacturer of so-lar PV, and with declining local costs, and potential co-benefits of reduced pollution and health, domestic use of solar PV may rise even more dramati-cally in the near future.
While market reforms have addressed some of China's previous problems in integrating solar energy, the power of administrative measures continues to actively intervene in the market with various government policies and incen-tives. Since 2018, the authorities have issued numerous regulations that sig-nificantly reduced the amount of subsidies on solar PV projects. Previously, the subsidies were allocated based on the quantity of solar power generation, rather than quality. The “531 New Policy” subsidy cuts in 2018 were a clear signal from the government that the solar PV industry needs to reduce its re-liance on subsidies and shift its focus from scale growth to quality improve-ment. At the beginning of 2019, however, the government proposed subsidy-free grid parity for PV electricity. As such, the Chinese solar market is moving from subsidy-driven towards unsubsidized grid parity. Grid parity is a tipping point for the diffusion of solar PV technology. In China, the potential for such grid parity exists due to innovations in solar PV technology and declining costs. However, there are few uniform conclusions from previous studies as to whether and when grid parity can be achieved for solar PV. Future research opportunities exist to explore the required system and financial costs associ-ated with grid parity. The attractive economics of solar and other renewable resources present a challenge to coal-fired generation. Cost is often a major consideration when planning the transition from coal-fired generation to green power. It is worth comparing the costs of unsubsidized solar PV and coal-fired generation to meet the goals of the energy transition.
and Hockerts, 2015), which makes it a suitable environment for understanding the smart city transition.
China is strongly committed to reducing CO2 emissions from power geration by building and deploying renewable energy sources such as solar en-ergy. As part of the Paris Agreement commitment, China has set a target to increase the share of renewable energy and non-fossil fuel energy consump-tion to 15% by 2020 and 20% by 2030 (Liu et al., 2018). In regards to the decarbonization of China’s power system, renewable energy will account for 27% of China's total power generation by 2020 (Gosens, Kåberger and Wang, 2017) (National Development and Reform Commission (NDRC) and National Energy Administration (NEA), 2016). Remarkable progress has been made in this by deploying 23%-33% renewable energy in the electricity mix during the first three quarters of 2020 (International Energy Agency (IEA), 2020). Dur-ing the same period, the electricity demand increased by 1.3%, and solar PV power generation increased by 16.9%, regardless of the pandemic lockdown measures being putting (National Energy Agency (NEA), 2020). The propor-tion of solar PV electricity is increasing substantially every year, although it still provides a relatively small share. China is the largest manufacturer of so-lar PV, and with declining local costs, and potential co-benefits of reduced pollution and health, domestic use of solar PV may rise even more dramati-cally in the near future.
While market reforms have addressed some of China's previous problems in integrating solar energy, the power of administrative measures continues to actively intervene in the market with various government policies and incen-tives. Since 2018, the authorities have issued numerous regulations that sig-nificantly reduced the amount of subsidies on solar PV projects. Previously, the subsidies were allocated based on the quantity of solar power generation, rather than quality. The “531 New Policy” subsidy cuts in 2018 were a clear signal from the government that the solar PV industry needs to reduce its re-liance on subsidies and shift its focus from scale growth to quality improve-ment. At the beginning of 2019, however, the government proposed subsidy-free grid parity for PV electricity. As such, the Chinese solar market is moving from subsidy-driven towards unsubsidized grid parity. Grid parity is a tipping point for the diffusion of solar PV technology. In China, the potential for such grid parity exists due to innovations in solar PV technology and declining costs. However, there are few uniform conclusions from previous studies as to whether and when grid parity can be achieved for solar PV. Future research opportunities exist to explore the required system and financial costs associ-ated with grid parity. The attractive economics of solar and other renewable resources present a challenge to coal-fired generation. Cost is often a major consideration when planning the transition from coal-fired generation to green power. It is worth comparing the costs of unsubsidized solar PV and coal-fired generation to meet the goals of the energy transition.
The concept of "smart" refers to a forward-looking approach (Chourabi et al., 2012), where smart cities are composed of a smart economy, people, gov-ernance, mobility, and environment. It is reasonable to assume that smart cit-ies may also need to include the concept of "smart markets", which should be understood beyond traditional neoclassical economics. Sweden has surpassed the environmental targets set by the EU with an explicit goal of reaching 60% of renewable energy systems by 2030. The adoption of renewable energies, such as solar PV power, wind power, hydropower, is closely related to the initiatives and growth of smart cities. On the other hand, the introduction of renewable energy brings transitional challenges and new possibilities to the existing electricity market in Sweden. It alters the roles of traditional market actors as well as business models. For example, the distributed solar PV ap-plication transforms customers of different kinds, e.g. households, companies, and public organizations, from being “pure” consumers to producers. With the varying availability of solar energy and unstable consumption profiles, the balance of electricity demand and supply becomes unbalanced. The electricity prices become more volatile, subject to the changes of supply and demand. Power system operations, managerial control, and new forming laws and reg-ulations in regard to distributed renewable electricity require an enhanced un-derstanding of market logic. In summary, it is of interest to explore how Swe-den's adoption of solar and other renewable energy sources changes the market - a change associated with smart cities that incorporate multiple technologies and services - involving a revised understanding of actors' roles, resources, and business logic.
A co-evolving set of economic and technical developments have built suf-ficient momentum for solar PV technology to become accepted as an estab-lished part of the energy provision system. Extensive efforts are being made to explore the role of solar PV technologies in the energy transition and smart city transformation. It is usually associated with the implementation of tech-nology in order to solve urban problems with a holistic and interdisciplinary approach. Grubler et al. defined energy transition as "a change in the state of the energy system" rather than a change in individual energy technologies or fuel sources (Grubler, Wilson and Nemet, 2016). Similarly, smart city trans-formation needs to be considered from a broader economic, environmental, technological, and social perspective to address urban sustainability issues and improve the quality of urban services (Ekman and Lindh, 2013) (Giourka et al., 2020). The natural science in complex energy systems draws on wider insights across different disciplines. In particular, the techno-economic frame-work illustrates this point clearly. The techno-economic analysis is rooted in energy systems analysis and various domains of economics, and it focuses on energy systems and energy deliver services valued by people (Cherp et al., 2018). In the theories and models of techno-economic analysis, the physical production and consumption of energy and the trade of services in energy