Mälardalen University Press Licentiate Theses No. 124
A DESIGN PROCESS BASED ON VISUALIZATION
Anders Wikström 2010
Copyright © Anders Wikström, 2010 ISBN 978-91-86135-85-0
ISSN 1651-9256
Abstract
The global market of today is tough and the competition
between companies demands new ways of developing
products and services. The current challenge for the
design research community is to provide designers with
a wider range of methods and tools to support specific
activities within the design process and to improve its
overall coordination.
It is uncertain whether problem-solving alone can be
the tool for developing even simple products or services,
as we are less open to the variety of opportunities that
arise in the process. When approaching a problem, the
cognitive mindset demanded to solve the problem, differs
from that required when searching for opportunities in
creating something completely new. This emphasizes the
importance of design thinking, using tools and methods
for conducting Human Centered Design (HCD), empathy,
and intuition, along with the use of visualization.
By focusing on the creative process and the use of sketches
and models, this research will explore the possibility to
develop tools and methods for conducting New Product
Development (NPD) projects in a more efficient way.
This research presents a prescriptive model for visualization
in NPD projects. This model is a result of clarifying the
research problem, understanding the factors that affect
visualization and the need for development of support.
The model works as a supportive tool for project teams
and guidelines for management.
Acknowledgements
Firstly, I would like to start by thanking my supervisor
Professor Mats Jackson for all his help and support during
the work with this thesis. His inspiration and positivistic
attitude has been of great importance for the first part
of my PhD-studies. Secondly, I want to thank my assisting
supervisor Dr Thomas Porathe for fruitful discussions and
for always providing inspiration. As supervisors, Mats and
Thomas have been great, sharing thoughts and providing
support in fruitful discussions.
I would also like to thank all the people at the department for
their support, especially those who have been supporting
me most: Joakim Eriksson, Anna Granlund, Erik Hellström,
Dr. Sten Ekman, Professor Yvonne Eriksson, Antti Salonen,
Jennie Andersson, Carina Sjödin, Dr. Marcus Bengtsson,
Jan Brandt, Dr. Magnus Wiktorsson, Karin Romvall, Mikael
Hedelind, Professor Lennart Strand, Peter Johansson, Petra
Edoff, Carina Andersson, Åsa Öberg, Yuji Yamamoto and
Lasse Frank.
Also, thank you to all the other participants in the different
projects I have worked on, and a special big thank you
to all students that I have been working with in the idPeo
courses.
Last but not least, I send my love to my family, and
especially my wife Camilla and my wonderful children
Niklas and Tove for all their support and understanding.
Love you!
Publications
Appended Papers
Paper 1
WIKSTRÖM, A. 2008. idPeo a Multidisciplinary Approach to Innovative Product Realization. In: UPA Europe 2008. Turin Italy: UPA Europe.
Paper 2
WIKSTRÖM, A. 2009. A Reference Model for Using Visualization whitin Product Realization Projects. In: International Confe-rence on Engineering Design, ICED’09, 2009 Stanford University, Stanford, CA, USA., 399-409.
Additional Publications
JACKSON, M., EKMAN, S., WIKSTRÖM, A. and WIKTORSSON, M. 2009. Innovation and Design Inspired Product Realization. In: International Conference on Engineering Design, ICED’09, 23-27 August 2009 Stanford University, Stanford, CA, USA. 263-23-274. WIKTORSSON, M., WIKSTRÖM, A., JACKSON, M., EKMAN, S. 2009. Developing idPeo - a Multidiciplinary Approach to Pro-duct Realization. In: International Conference on Engineering Design, ICED’09, 2009 Stanford University, Stanford, CA, USA., 67-77.
WIKSTRÖM, A. 2010. Visualization – a Catalyst for Creativity in New Product Development (NPD). In: International Conferen-ce on Design Creativity. Kobe, Japan: ICDC 2010.
1. Introduction and Background 10 1.1. Problem Statement 14 1.2. My Personal Perspective 15 1.3. Research Objective 21 1.4. Research Questions 22 1.5. Delimitations 23 1.6. Expected Results 24 1.7. Summary 25 2. Research Methodology 26
2.1. The Research Design 32
2.2. The Cases in the Research 40
2.3. Data Collection 45
2.4. Summary 47
3. Frame of References 48
3.1. Design Processes 50
3.2. The Fuzzy Front End of Innovation 54
3.3. Communication and Visualization 57
3.4. Proposal of Conceptual Framework 64
3.5. Summary 69
4. Empirical Studies 70
4.1. Case Study A, Research Clarification Study 71
4.1.1. Problem Statement 71
4.1.2. Empirical Findings 72
4.1.3. Conclusions from Case A 76
4.2. Case Study B, Descriptive Study 1 77
4.2.1. Problem Statement 77
4.2.2. Empirical Findings 77
4.2.3. Conclusions from Case B 80
4.3. Summary of Empirical Studies 81
5. A design Process based on Visualization 82
5.1. Proposal 86
5.2. Summary 95
6. Conclusions, Contribution, and Future Work 96
6.1. Fulfillments of Objectives 98
6.2. Research Contributions 100
6.3. Quality of the Research and Validity of the Results 101
6.4. Future Work 102
7. References 104
Appended paper 1 111
There is a need for research within the area of
product development. The use of visualizations in the
development process is often unstructured and ad
hoc. By focusing on the creative process and the use
of sketches and external representation, it is possible
to develop better tools and methods for realizing new
products in a more efficient, effective way. In this section,
a background of the research will be presented.
Economic growth and future jobs are dependent on how individuals within organizations are able to generate ideas and develop them into competitive and sustainable products and services. Today’s globalized market has resulted in a business environment where change and uncer-tainty challenges industry.
The idea that low cost and quality focus is sufficient for a competitive market position has disappeared. For example, environmental challenges and constant innovation are becoming increasingly important and must be integrated into the development of new products and services, as well as into the organizations and processes, to achieve those results. These facts make the entire product realization process of today more complex than ever.
In organizations that today struggle to compete in the global market, there is a need to find and develop new ways to achieve economic growth and new market shares. Organizations working on qualified, complex, products or qualified unique manufacturing methods today have the ne-cessary order qualifiers for competition.
One way to become competitive is by implementing new and impro-ved concepts, methods and models that will support and strengthen the innovation and product realization processes, as well as the organizations and people pursuing these paths (Jackson, 2009). Combining this with a holistic view of the entire innovation process, which includes the product realization process, is a way to strengthen the performance in presen-ting new products or services on the market. In this project, this means focusing and integrating the areas of creativity, design, design thinking, design methods and design research, in a broad sense, into the innovation and product realization processes.
In the knowledge-based global economy of today, even the nature of innovation is changing (Lengrand, 2002). We can see a change towards a more ´open innovation strategy´, where suppliers, customers, end-users, universities and other external resources and networks are much more involved in organizations’ innovation processes (Chesbrough, 2003, 2009). Most organizations have well-developed strategies for quality and production management systems, for example. But few have developed clear strategies concerning innovation processes and management from an integrated technological, organizational and market perspective (Tidd & Bessant, 2009).
The development and design of new products and services within pro-duct development and engineering design originated from and is often based on problem-solving (Pahl and Beitz, 2007). Research within the area has its origins in systems theory and the design science paradigm influ-enced by Hubka & Eder (1988, 1996), for example. The ultimate goal is to quickly present an economically-produced product to the market. For most producers, this is done by working through a chain of decisions: first establishing clear objectives for the product, then identifying the target market segment and, finally, trying to systematically determine the custo-mers desires or needs. Structured design methods have been developed in engineering design by Ulrich & Eppinger (2003) and Pahl & Beitz (2007), among others.
For the development of integrated and complex products, it is often not enough with the engineering and subject-specific development pro-cesses based on problem-solving. It is uncertain whether problem-solving alone can be the tool for developing even simple products or services as we are less open to the variety of opportunities that arise in the process. When approaching a problem, the cognitive mindset demanded to solve the problem differs from that required when searching for opportunities in creating something completely new. But, of course, we need both thin-king styles in collaboration (Drucker, 1998).
Design, design thinking, design methods and tools are resources that should be better utilized and could be better integrated in future manage-ment strategies (Utterback et.al, 2006; Brown, 2009; Verganti, 2009). This emphasizes the importance of design thinking and methods in realizing new innovative products and services. For example, visual and spatial communication is central in design and development work. Sketches and models are important tools that can facilitate and support the develop-ment work during product realization.
All kinds of visual representations are exceptional since they show ap-pearance of objects. Language does not. A sketch can serve as a common reference for the team. However, to be able to communicate via a sketch, the use of verbal communication is essential. Sketch-based design proces-ses can eliminate communication problems as long as the team members involved during the communication are the same. On the contrary, in handover situations, new team members will interpret the sketches dif-ferently because of a variation in pre-understanding. This is because pic-tures are arbitrary and can be interpreted in different ways; therefore, it is necessary to combine the sketches with verbal information (Kress & van Leeuwen, 1996, 2001; Eriksson & Göthlund, 2004; Eriksson, 2009).
To be able to support industry in their effort to perform effective New Product Development (NPD), we need research within specific activities, as Eckert and Clarkson (2005) explain:
“over the past 20 years, design research has focused on methods for delivering more efficient processes and support tools for design”
and, further, they go on to say that
“the current challenge to the design research community is to provide designers with a wider range of methods and tools to support specific activities within the design process and to improve its overall coordination”.
These activities need support systems and communication systems that are easy to handle and work with.
Research is needed within the field of visual communication concer-ning what is essential for an image to be instructive in general, and for sketches in the design processes in particular. However, images can be divided into two kinds: those that portray essentially visio-spatial things and those that represent things not inherently visual (Tversky, 2006). De-sign sketches can be defined as a combination of the two. This is because they portray objects or parts of objects that should be created and at the same time operate as an instrument for exploration.
1.1. Problem Statement
One challenge within an organization is to develop new innovative products and services and present them to the market. These products must be developed in an economical and sustainable way. They must also answer a desire or need on the market, be technologically and organiza-tionally feasible and financially viable (Brown, 2009).
Design competency in organizations can help to improve the processes of creating innovative, sustainable products and services. A typical design process includes generic steps such as the identification of needs, idea ge-neration and conceptual design, detailed product design, the preparation of production and design of production system, production, marketing and delivery. Defined generic design phases include Idea and Concept De-sign, Product Design and System Design. These phases often differ from each other in objectives and approaches but have the design concept in common. Another aspect these phases share is the use and need of visual communication.
By focusing on the creative process and the use of sketches or models, this research will explore the possibility of developing tools and methods for conducting NPD projects in a more efficient, effective way. If com-munication in the NPD process is unsatisfactory, this implies a need for a deeper and more structured way of using available tools for communi-cating. For example, the sketch is such a tool, and the use of sketches is seen as the real heart of visual communication (Hendersson, 1999). The need for developing supportive tools for using sketches is vital, and the support for management to fully implement sketches in their own pro-duct development process can help improve the perceived performance in NPD. Where performance could be seen as an umbrella term for excel-lence wich is dependent on the efficiency of the process (i.e. input orien-ted) and the effectiveness of external performance (i.e. output) (Tangen, 2005). Where the terms ”Efficiency” in simple words could be described as ”doing things right”, in relation to ”Effectiveness” that means ”doing the right things” (Sink and Tuttle, 1989).
With this challenge in mind, the problem is what aspects of commu-nication within the innovation process are in need of visualization in or-der to continuously improve the overall product development execution. When developing new products and services, using design processes and design skills, different activities are being used in the process. The correla-tion of these activities to visualizacorrela-tion has to be clarified.
The next section will summarize my own interest and knowledge about visualization in the innovation process.
1.2. My Personal Perspective
This section belongs to the frame of references (Section 3) of the the-sis, but I present it early on in this thesis in order to give the reader the necessary information about my context and perspective. Maxwell (2005) points out that the researcher’s own experiential knowledge about the research area as an important and vital part of a thesis.
The use of visualization has always been very close to me. The first time I used it in a way that could be considered a product realization was when I built my first soap car. My parents told me later that I started by making a drawing I called “beritning (In Swedish)”, a combination of des-cription (Swedish: beskrivning) and drawing (Swedish: ritning). However, I never gave much thought to it until I started writing this thesis. I now realize that this new word has followed me during my whole life, in dif-ferent ways.
Like most children, I drew a great deal. Many of my drawings became stories about events I had experienced. However, this storytelling was not for others to look at, but strictly for me. One could say that it was a way of reliving events and capturing moments. These representations of the past became stories of the future, where I as a painter decided what was worth telling. The use of drawings became more and more interesting for me, and I started every new project with a “beritning”. It could be a new tree hut, soap car or a gadget that I wanted to create.
When it was time to choose an education, it was rather simple, because of my interest in drawing and architecture. During this time, I started to use drawings more as a tool for explaining ideas and testing solutions. As a construction engineer with focus on design, the ultimate job was, of course, architecture. My first employment was at an architect firm, working with everything from layout drawings of kitchens, bathrooms and windows, to architectural drawings of apartments, schools and of-fices and of course detailed drawings. The work was done both by hand and in CAD tools for architects. The drawings produced were for the con-struction workers primarily. This meant the drawings should be easy to read, understandable and create meaning. My work as an architect invol-ved designing information without knowing anything about Information Design. When it comes to architect drawings, they are complex and rich in information, as Figure 1 shows. This information has to be communi-cated, and the drawing acts as communicator between the architect and the construction worker.
Figure 1. Tegelviken, architectural drawing.
This specific drawing, Figure 1, contains information about the con-struction of the building, what kind of wall and the exact position of it, where to put the specific doors and windows, kitchen and interior and so on. There is also information of changes in the drawing. A letter in a triangle denotes changes and the changes when new are marked with a cloud.
It all starts with the sketch, this mythical and glamorous answer to a requirements specification. It could be just some sketchy lines on a nap-kin or well-defined ruler lines on film. It is not the characteristics of the line that tell us what kind of representation it is, but its usage. A sketch does not have to be sketchy, and a drawing need not be done with rulers. It is the type of communication that decides what kind of representation it should be. For an architect, as well as for a designer, sketches are for exploring and coming up with ideas and drawings are for explaining and describing the solution.
As my interest in Information Design grew, I started a higher educa-tion with informative illustraeduca-tion in focus. During this educaeduca-tion, I reali-zed that knowledge about Information Design is needed everywhere. The problem is to make people realize this as well. One could discuss whether Information Design is just common sense. If that is the case, the lack of common sense is widespread. You just have to read the instructions on a DVD player or some other home electronic device. They are complex, and that complexity is worsening. This is not only a problem for the instruc-tions, but also the product/service itself. If the product design is made with more focus on the end user, the instructions could be a part of the product/service itself. Information should be as simple as possible but not simpler, and information has to be designed according to the receiver. This means that information has to be handled by Information Design experts.
As a result of my education, my interest in developing information solutions to industry grew. In order to be able to work with this, I started a new company, together with two partners. The scope of the company was to develop 3D-models and animations with a high level of informa-tion for the Internet. The process of developing a new company within a new field was a challenge, but we attracted the customers we wanted. After three years, we had established the company on the market and then made an exit.
Working with information material, you work as a designer with two sets of needs in mind: on the one hand, you have the customer with his/ her information needs; on the other hand, you have the needs of the in-formation receiver. Your competence is much about adapting design met-hods that create the right information at the right time for the receiver the customer chooses.
Working with ideas, trying to create new business and develop new products or services, there is a great amount of information that needs to be handled. This process of developing ideas into innovations is so-mewhat of a communicative process, where stakeholders and associates need to be informed about both the development and the process of get-ting there.
The development of methods using visualization as a tool for purpo-ses of exploring an idea thoroughly and explaining and describing it to stakeholders using visualizations was the next phase in my striving for increased effectiveness and efficiency in business development. Figure 2 shows an example of visualizing the process of idea development. This information graphic tries to explain the complex and iterative way of de-veloping an idea into a business idea. The steps are defined in a process as black areas with gates in between, and the different stops along the way are activities that need attention.
Process Coaching Network Creative methods Action Start process Explore & Describe Development &
Education Implementation & Start up
In this work, I developed methods to solve communication problems, both in the exploring and the communication phase. The focus was in the exploring phase, on creativity methods and tools. The lateral thin-king explained by Edward de Bono (1992) as solving problems through an indirect and creative approach was one source in this work. Lateral thinking is a way of thinking that is not instantly obvious, and it involves creating ideas that may not be reachable by using traditional step-by-step logic. By using these tools, the knowledge gathering and sharing became more effective and the perceived efficiency in each development process increased. This could be one of the success factors behind this process.
In summary, the use of visualization in industrial design is well-esta-blished, and during my time as a industrial designer I used computer applications as a sketch tool with good results. These sketches were al-ways preceded by work with paper and pen and then explored on the computer. One of the advantages of sketching with a computer is exact-ness. Another is the ease with which one can adjust inputs already made, extremely difficult when working with paper and pen. One could argue that the ease in adjusting could also be seen as a disadvantage because the exactness is not important at that specific moment. You need to have good knowledge regarding when and, more importantly, why to use pa-per and pen or computer when sketching. With the advanced CAD tools used in industry today, the interesting thing is how design engineers use paper and pen in their daily work developing new products and services. How they use multi-disciplinary teams within development projects is also of interest.
1.3. Research objective
Based on the background and the described problem area, the overall objective of this research is:
“to analyze how and why visualization can be used and managed to improve product development execution”.
Thus, this research will investigate how visualization methods within the innovation and product realization process can be used and managed. Improvement in product development execution involves the better use of the creative ability among the individuals involved in the process. It is vital for those individuals to understand new approaches, tools, and methods and to then be able to adopt them for practical use in their own model of product development. The research discusses different aspects of competencies needed in the processes.
The intention of this research is to develop a model supporting the use of visualization within the innovation and product realization process. The model needs to be both communicative and supportive in order to achieve acceptance in practice. When developing any model, good know-ledge about the current situation and the best practice in organizations is needed.
1.4. Research Questions
The research questions should lead to an increased understanding of how and why visualization can be used in product development and how visualization contributes to the performance of product development. Th-ree research questions have been formulated.
RQ 1: How and why is visualization used today in product development projects in industry?
The first research question (RQ1) is intended as a motivation for the research and the other research questions. The question has been for-mulated to make sure that the research conducted is focused on a real industrial problem and is vital for organizations in their quest to become more effective in their process of developing new products and services. The focus is to identify and describe the success factors the research pro-ject aims to improve. It is also to identify the key criteria that contribute to the improvement of the success factors in product development. The question is answered in Papers 1 and 2.
RQ 2: What could a common model of visualization as a support to product development look like?
The second research question (RQ2) is based on the result of Research Question 1 (RQ1). In order to develop support for addressing the factors most suitable within different development activities, it is important to investigate what a model using visualization as a support could look like. The aim is to develop a supportive model addressing the criteria identi-fied in RQ1 in order to improve the success factors in product develop-ment. The question is answered in Paper 2.
RQ 3: How should visualization be managed in order to increase the perceived performance of execution in product development projects?
The third research question (RQ3) follows up where RQ2 left off, in or-der to develop support for enhanced performance in NPD processes. The focus is on team members involved in the process and the management level in the organization. To facilitate the process of developing new pro-ducts and services, management needs to have access to the process and understand each meaning of the phases in the process. The question is answered in Section 5.
1.5. Delimitations
This research focuses on SMEs (Small and Medium sized Enterprises) with in-house product development competency. The area of importance is in the use of visualizations in the early phases of NPD. Visualization is defined as sketches, models and drawings with the main purpose to ex-plore ideas, but some results are in the solution phase of the development process. The research is focused on how to improve the performance on NPD projects and strengthen competiveness in SME NPD projects.
This research has been performed with a focus on SMEs. However, the problem description could be found in larger companies as well. The app-licability of the result on larger organizations is not discussed. Nonethe-less, one can assume it is valid for them as well.
The aim is also to create a deeper understanding of the early phases, the value of the information visualization creates and how it effects the phases to come.
1.6. Expected Results
The expected result of this research is to explain why visualization is an important part of the product development process. The research is expected to deliver a series of results with a focus on the impact visua-lization has on the performance of the product reavisua-lization execution. It should explain and map a visualization process for the product realiza-tion process in order to deliver value and benefits to the project partners, the research community and industry.
The expected result is a conceptual framework regarding how visua-lization can be used within a product development project. The model should look into the existing situation and highlight the problem that is relevant in industry, focusing on SMEs. The model should also look into the factors most suitable to take into consideration when improving the situation.
1.7. Summary
The current challenge for the design research community is to provide designers with a wider range of methods and tools to support specific ac-tivities within the design process and to improve its overall coordination. It is uncertain whether problem-solving alone can be the tool for deve-loping even simple products or services, as we are less open to the variety of opportunities that arise in the process. When approaching a problem, the cognitive mindset demanded to solve the problem differs from that required when searching for opportunities in creating something comple-tely new. This emphasizes the importance of design thinking, using tools and methods for conducting Human Centered Design (HCD), empathy, and intuition along with the use of visualization.
By focusing on the creative process and the use of sketches or models, this research will explore the possibility to develop tools and methods for conducting NPD projects in a more efficient, effective way.
As a conclusion, there is a need to develop and implement new met-hods and tools that will support and strengthen SMEs to generate new innovative ideas and develop them into successful products and improved processes. The use of visualization (in the early stages) in the innovation process is the focus of this research.
The next section will explain what research methodology has been used to be able to answer the research questions and reach the expected results.
To be able to answer the research questions and reach
the expected results, which are useful for SMEs and
valid within the research community, different scientific
methods have been used. The scientific approach in
this research has mainly been case studies. In them, the
researcher’s role has been two-fold: as observer and
as an active party in different product development
projects, using self-reflection to develop understanding
and new knowledge.
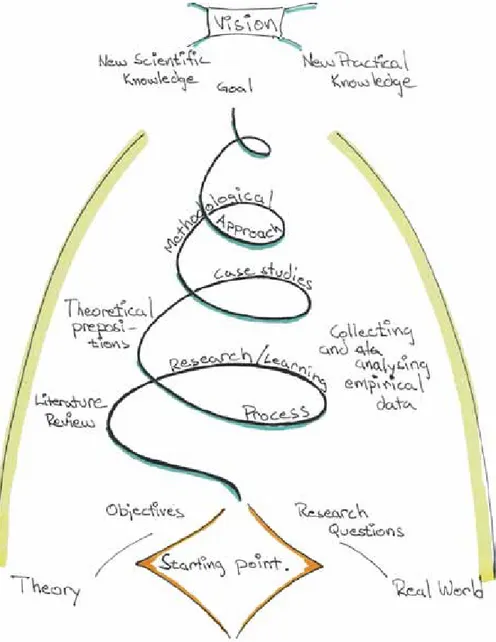
The main focus of this research has been to develop useful methods and tools for industry, in an applied research project. Thus, the research questions are a starting point for both the real problems in industry and the theoretical ones in research.
Figure 3 shows an interpretation of Björn Fagerström’s description of such a research process, highlighting the theoretical and industrial pro-blems and how they interact during the research process in an iterative process (Fagerström, 2004). The approach supports the research where the objective is to contribute both in theory and in reality, solving indu-strial problems. Within this research, it is the induindu-strial world of the SME with its own product development skills and the theories pursued ports in the research design. Trying to describe a phenomenon like this, case studies are most likely to come up with an explanation. Therefore, a qua-litative approach has been used in this research. A quantitative approach could also come up with an explanation, but it does not fit as well in this research.
Maxwell describes the qualitative research in design as:
”an ongoing process that involves ”tacking” back and forth between the different components of the design, assessing the implications of goals, theories, research questions, methods, and validity threats for one another. It does not begin from a predetermined starting point or proceed through a fixed sequence of steps, but involves interconnection and interaction among the different design components.” (Maxwell, 2005)
The researchers are given the opportunity to move interactively bet-ween the various components and in their respective fields to create new knowledge. This leads, in turn, to new questions arising on the way to the overall objective.
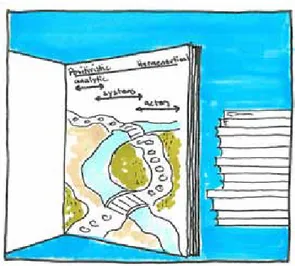
The researcher can apply different world views in the research project. The view selected affects the choice of methods and approaches used in the research. According to Arbnor and Bjerke, there are three approaches in looking at the world (Arbnor and Bjerke, 1997). They are as follows:
the analytical approach the systems approach the actors approach
These methods are linked to the two major paradigms in Social Sci-ence: positivistic and hermeneutical paradigms (Figure 4). The positivistic view could be described as scientific rationality. The produced knowledge should be empirical proved, and it sees human beings as objects. Mean-while, the hermeneutic view could be translated as the way of interpreta-tion. It sees the human and the world related to each other and through the experience of the world, and you interpret tacit knowledge in your analysis.
If using the analytical approach, you search for independent relation-ships, and the approach aims to explain the world as objectively as pos-sible. The world consists of the relationships between cause and effect. The systems approach is based on the world seen with objective eyes and the studied phenomenon is independent of who is watching. In the third and final approach, the actors approach, knowledge is not seen as objec-tive. The view of the world is as social structures, and social structures are studied and understood.
In this research, the systems approach is used to explain or understand components within a system. To do so, the component needs to be within its context (See also Section 2.1). This means that there are both open and closed systems. In the systems approach, one has the possibility to describe systems as reproductions and objective manifestations of reality.
The systems approach is based on the fact that visualization in NPD can be seen as a system, and this system can be divided in several sub-systems, such as different activities and events. Each of these activities or events, sub-systems, can be studied individually. When using the systems approach, the whole is not the sum of all included parts but greater. This is different from the analytic approach. The relationships between the ac-tivities or events are important and will affect the resulting visualization.
This research is mainly focused on the “Research for Design” area, the creating of tools and methods for the continuous development of proces-ses and the performance of NPD. Research in design can be considered as applied research where the goal is to improve for the benefit of industry, and in this case within the product development process (Blessing 1994; Andreasen 1996; Hubka and Eder 1996). Research in Design is a broad field of research applied to many different areas.
Cross describes a classification of design research in three different categories based on how it is performed (Cross 1995). Below, these cate-gories are listed, as well as some interpretations of comments made by Hubka and Eder (Hubka and Eder 1996).
Research into design – descriptive studies, by various kinds of
obser-vation.
Research for design – to create tools and methods that support
desig-ning.
Research through design – abstraction from observation during
de-signing, hypothesizing and testing.
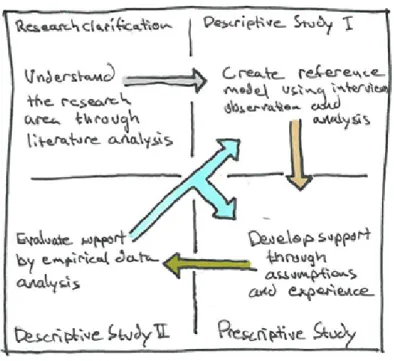
The overall aim of design research is to improve design by support, fo-cusing on their practical use. Blessing et al. argue that descriptive studies are not enough when the aim of the research is to improve the design process (Blessing, Chakrabarti et al. 1995). The descriptive studies only provide the characteristics of existing processes. You need to continue the research process with phases of development of support, testing and refi-ning this support in the manner outlined in Figure 5.
The methodology is based on four generic steps performed iteratively:
Research Clarification – identify and describe the success factors the
research project aims to improve.
Descriptive Study I — use interviews, observation and analysis to
identify the key criteria that contribute to the improvement of the suc-cess factors.
Prescriptive Study – develop a support model addressing the criteria
identified in Prescriptive Study I in order to improve the success factors.
Descriptive Study II – apply the support model and validate it by
as-sessing its impact on the criteria identified and the success factors. The DRM approach is not a sequential process. It builds up with much iteration between the different stages, and some stages run parallel as well (Blessing and Chakrabarti, 2002). This suits applied research, where the involvement of industrial partners is significant and new knowledge is continuously developed.
2.1 The Research Design
One of the success factors for any research project is to design the re-search in an appropriate manner. This designing can be seen as an action plan for getting ”from here to there,” where ”here” may be defined as the initial set of questions to be answered, and ”there” as some set of conclu-sions (answers) about these questions (Yin, 1994).
Maxwell suggests that with all components of the research process, from collection and data analysis, development and modification of the-ories, and the exploration and re-formulation of research questions to the identification of validation need, some components occur simultan-eously and affect each other (Maxwell, 2005). This means that the design of research is difficult to define exactly from beginning to end. As such, continuous evaluation and analysis of the processes is required in case the need to correct the following steps or redo something already done arises. The research has been designed in accordance with a model for the design of research projects Maxwell presented (Maxwell, 2005).
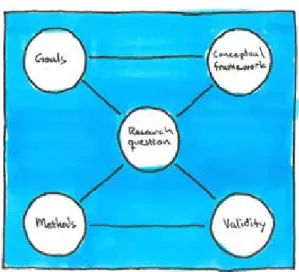
Figure 6 shows the outline of the model Maxwell presented. The model consists of five different focus areas for research: Objectives, Conceptual Framework, Methods, Research and Validation.
Figure 6. Maxwell’s model for the research process.
Goals - What is the purpose of the research project?
The industrial and scientific motivation for this project is described in Section 1.3. The scientific motivation can be found in areas such as the importance of and need for visualization and communication in product development execution. The industrial motivation lies within the deve-lopment of processes, methods and tools to create successful products. The personal aim of the researcher is first and foremost a genuine interest in the subject, a challenge to learn and a desire for personal development.
Conceptual Framework - In which context will the research project
be implemented?
The answer to this question is divided into several sections of this the-sis. First concepts and conclusions of the theoretical framework are defi-ned in Section 3.4. Another important factor is the approach the resear-cher has through the project. Even the delimitations set limits for the theoretical and conceptual frameworks. The four main sources for this module are:
the researcher’s own experiential knowledge existing theory and research
the pilot and exploratory research thought experiments.
Research questions - What is to be illustrated and carried out in the
research project?
Research questions are what keep the project running and establish measurable criteria for the objective of the research. Research questions in this research are presented in Section 1.4. The questions are based on “how” and “why” questions. The goal of these questions is to help focus the study, to give guidance as to how the study will be carried out, to point to what the researcher is trying to understand and to create knowledge.
Methodology - What methods are used to reach answers to the
re-search questions?
Literature describes different strategies necessary for collecting the data needed to achieve the objectives of the research. Yin gives the follo-wing examples: case studies, experiments, surveys, history, and archival analysis. These strategies have their advantages and disadvantages, which depend on: (a) the type of research question we want to answer, (b) the researcher’s control over actual behavioral events and (c) the focus on contemporary as opposed to historical phenomena (Yin, 1994).
Yin also suggests the following five guides as support in choosing the right strategy for the research:
Experiments answer “how” and “why” questions best, focusing on contemporary events in controlled environments.
Surveys answer “who”, “what”, “where”, “how many”, and “how much” questions focusing on contemporary events.
Archival analysis answers “who”, “what”, “where”, “how many”, and “how much” questions for both contemporary and historic events.
History answers “how” and “why” questions, focusing on historic events.
Case studies answer “how” and “why” questions, focusing on contemporary events.
A case study is a preferred research method when a specific phenome-non is to be closely studied within its natural context (Yin, 1994). The case study is almost always used to collect qualitative data (for example, text, figures and images). If one is to collect more quantitative data, it is more common to use a survey or archival analysis (Yin, 1994).
Case studies are often employed when trying to understand when and where a phenomenon actually happens and the knowledge about the con-text or delimitations are unsatisfactory (Yin, 1994). The advantage case studies offer is the possibility to use several sources and different types of data combined with the use of several methods of analyzing this data. This gives case study research the ability to answer complex questions and explain the background to the answer as well. However, this ability of case studies may be a disadvantage when the researcher interprets the data: the subjective opinion may lead to biased or wrong results. When collecting data in case studies, there are six sources to use, according to Yin: documents, archival records, interviews, direct observation, partici-pating observation and physical artifacts (Yin, 1994). In this thesis, the empirical data has been collected through interviews, observations and documents.
Yin describes interviews as one of the most important data collecting
methods in case studies (Yin, 1994). When looking into a system that de-pends on people’s opinions and decisions, interviews with key individuals within the system are regarded as valuable data. The aim of the qualitati-ve interview is to explore and discoqualitati-ver what happens, according to Starrin and Renck (Svensson and Starrin, 1996). Lantz notes that there are four main types of interviews: structured, semi-structured, directed open, and the open interview (Lantz, 1993). The first two forms are more suitable for collecting objective data (more positivistic view). The other two are more related to subjective data, and are therefore associated with a more hermeneutical view.
Yin explains that observations may be conducted casually or formally
(Yin, 1994). According to Merriam (1988), Kidder (1981) claims that if ob-servations are to be scientific, the following criteria have to be fulfilled:
fulfilling a scientific aim planned
systematically registered
controlled with respect to validity and reliability
The observation gives the researcher the opportunity to dismiss or ve-rify data collected from other sources that are considered less reliable (for example, interviews and documents).
Participatory observation is described by Merriam as perhaps the
most important method of collecting information for a case study. It gi-ves a firsthand description of the situation being studied. In combination with interviews and source analysis, if possible, a holistic interpretation of the situation is achieved (Merriam 1994). At participating observation, you can choose to act along with a scale that moves from simply atten-ding to only observing. It is important to find an approach in the observa-tion situaobserva-tion in order to combine the two acobserva-tion principles.
Validation - Are the results inaccurate or biased?
Merriam describes the research aims to produce valid and sustainable results (Merriam, 1994). The results and findings of the research must be examined critically. This is true of the methodology used as well. The methods for this evaluation are associated with the research strategy and must be selected according to this strategy.
The evaluation consists of two components, verification and valida-tion. Verification is the accuracy in relation to the practical use of the findings. Validity is associated with the relevance of the research. Another important part of evaluation is if the method is stable and can repeatedly come up with the same results, known as consistency. Arbnor and Bjerke describe consistency as reliability, and say that “validity requires reliabi-lity.” This means that reliability exists when validity is obtained (Arbnor and Bjerke, 1997).
According to Svensson and Starrin (1996), the validity term is used wi-dely within quantitative research. The term refers to how well you mea-sure the intended meamea-surement. Quantitative methodology is used to nu-merically determine the validity by comparing results obtained with the regarded truth. In the case of qualitative studies, there are many opinions regarding how to look at validity. Some believe it is about authenticity, credibility and understanding, while others believe that validity is a good description.
Cross (2007) means that the characteristics of best practice in design research with validity are:
Purposive – based on the identification of an issue or problem worthy and capable of investigation.
Inquisitive – seeking to gain new knowledge.
Informed – conducted from an awareness of previous, related research.
Methodical – planned and carried out in a disciplined manner. Communicable – generating and reporting results that are testable and accessible by others.
These characteristics do not simply represent good design research; they define good research in any discipline. However, these characteris-tics by Cross are not supported by explanations as to how to value them. Olesen suggests a more concrete description. He suggests that validity can be achieved by the following factors (Olesen, 1992):
Internal Logic – the findings are based on well-known and accepted theories, and the work is stringent from the problem to the finding.
Truth – the theoretical and practical findings can be used to explain “real” phenomena.
Acceptance – the findings serve as tools for professionals, and other researchers use the findings and accept the theories obtained.
Applicability – the use of the tools leads to increased performance, as compared to if the tools were not used.
Novelty value – new findings are presented, or new ways of looking at a specific problem are introduced.
Andreasen describes characteristics for good research design. He also suggests another basis of the evaluation for validity that follows the one above (Andreasen, 1996). Research should be focused, based on theory and a strong research paradigm, conducted according to good research craftsmanship, multidisciplinary, and published. In addition, the findings should be used/implemented. These requirements can be compared with Svensson’s, who suggests that one or more of the following aspects of the expected validity are entered: depositor survey, data collection, data analysis and results (Svensson and Starrin, 1996).
The ability of researchers to repeat the study performed and come up with the same result and conclusion the first researcher did is what relia-bility is about. In systems thinking, reliarelia-bility focuses on what the measu-rements can be used for and not how precise they were during the case study. Consequently, in contrast to the analytical approach, the systems thinking does not consider reliability to be as important (Arbnor and Bjer-ke, 1997). Reliability could be difficult when studying human behavior that is dynamic and not static (Merriam, 1988). Yin discusses reliability. He finds it possible as long as other researchers have all the documents the first researcher had and all the methods used by the first researchers are well-documented. Yin (1994) also suggests that:
“The general way of approaching the reliability problem is to make as many steps as operational as possible and to conduct research as if someone were always looking over your shoulder.”
The methods for collecting data used within this research have been literature studies, interviews, project documentation and observations. Another researcher would find it difficult to repeat the same research and get the same results because of changed conditions and access to the same documentation and situations. However, if another researcher as-ked the same research questions under the same conditions, the findings would be similar in essence (Hedelind, 2008).
Yin points out the need to use an analytical approach for the analysis of research data (Yin, 1994). Merriam describes analysis as a complex pro-cess that moves back and forth between concrete data and abstract con-cepts, but also between inductive and deductive reasoning, and between description and interpretation (Merriam, 1994). What researchers do to create meaningful results is not some logical process; it is more intui-tion and the researcher’s sensitivity for the informaintui-tion. There are several methods for analyzing qualitative data. In this research, the following methods are used:
Pattern Matching logic is one of the better methods for analyzing
case studies (Yin, 1994). This technique is mainly based on comparing the empirically observed patterns with predicted ones. According to Merriam, the human mind quickly and easily finds the patterns that arise. Howe-ver, it is important to note sustainable support for the current pattern (Merriam, 1994).
The aggregation of information, clustering that are similar within
ca-tegories, means that one can do further analysis by conceptualizing the data that shows similar in characteristics or patterns (Merriam, 1994). To deepen this analysis, we can abstract and reorder the information for the highlighted categories and characteristics that may be included in the theory created.
The probable method of analyzing data is an intuitive approach where
the researcher focuses on the conclusions that seem reasonable and logi-cal (Merriam, 1994). The method works as a kind of guide that draws the researcher’s attention to what appears to be reasonable and proper.
Factoring is a categorization of the encoded data done to facilitate
comparison. Development of theoretical concepts is a method to reduce a host of data into meaningful concepts (Merriam, 1994).
This overview of the research design explains different methods and their use within this specific research. However, in order to fully un-derstand the research performed, a description of the different stages in the research and a short description of the performed cases follow.
2.2. The Cases in the Research
When creating a research project in the field of design, the Design Re-search Methodology (DRM) developed by Blessing and Chakrabarti’s (2002, 2009) could be used as methodology for the research. Figure 7 shows the basis of the methodology. According to the objective of this research, the applicability to the DRM methodology is high.
The “Research clarification” and “Descriptive study” phases have been conducted using methods such as literature review, multiple case study research, workshop, open and semi-structured interviews, and internal company document reviews. The “Prescriptive study” phase has been con-ducted using single case study, open and semi-structured interviews, and internal company document reviews.
Figure 7. The Design Research Metodology according to the objectives of this re-search.
Research clarification presented in Papers 1 and 2
The outcomes of the Research Clarification stage are current under-standing, expectations of the research area and an initial reference model that provides some understanding of the use of visualization. An initial impact model was developed using “best practice” studies that gave initial success factors for improving the process of NPD with visualization.
The focus of the research was identified, and the objectives of the re-search were described. This led to the development of a rere-search plan where the problems within industry were identified, along with the area to be consulted. The main research questions, the hypotheses that addres-sed the problem and the research approach were developed. This led to the decision about what kind of research strategies to adopt and what the main stages and methods should be.
Finally, the expected area of contribution and deliverables to industry and science was investigated, and a plan to fulfill these expectations was integrated with the research plan and time schedule.
Descriptive Study I, presented in Paper 2
One outcome of the Descriptive Study I stage is a reference model that highlights the problems in the investigated area, shows the relevance of the research topic, clarifies and illustrates the main line of argumenta-tion, and points at the factors most suitable to address in order to improve the situation. Another outcome is the findings and implications of the developed model for support.
Prescriptive Study, presented in Section 5
The outcomes of the Prescriptive Study stage are an impact model with a description of the intended implementation of the support to address the key factors, an implementation of the actual support, an initial eva-luation of the suggested support and a plan for evaeva-luation in Descriptive Study II.
Descriptive Study II, future research presented in Section 6.4
The outcomes of the Descriptive Study II stage include the following: an application evaluation with criteria for success and implications of the findings for the developed support, the assumption of the developed sup-port and the concept behind it, the description of the impact model and the reference model (along with the criteria used).
In this study, the “how” and “why” questions are in focus. As applied research focuses on the contemporary events, the most suitable strategy involves case studies. Yin explains that case studies are the preferred stra-tegy, with advantages over the other strategies, when trying to answer “how” and “why” questions about contemporary events. The researchers have no or very little control here. According to this, the preferred stra-tegy in this research is case studies.
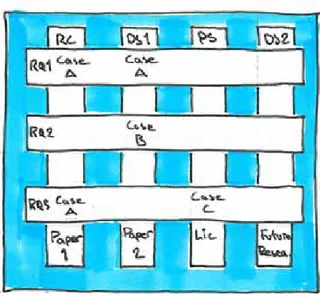
Figure 8 shows the DRM methodology in relation to the research ques-tions and research cases.
Figure 8. The DRM methodology in relation to the research questions and research cases.
In the two cases presented in Sections 4.1 and 4.2, the case studies have sought to identify how visualization is used and can be used to sup-port product development execution and to increase the performance of this execution. Different methods have been used for the data gathering, interviews, direct observations, participatory observations and literature studies. These methods have been chosen for their different aspects of applicability to the research questions.
Case A, presented in Section 4.1.
The purposes of Case A were to get a clear picture of how and why visualization is used in product development projects today, clarify the problem area, find out what expectations you can ask of this research, and identify how current knowledge and theory look. Against this back-ground, the planning of the whole project is implemented with time ma-nagement, research plan, the main issues and approaches in research.
A literature review and a practical examination of best practice were implemented and a general approach developed. The focus was to high-light the design process in a multi-disciplinary manner, with a focus on creativity and innovation. The data collection methods used was semi-structured interviews, workshops, surveys, and literature studies.
Case B, presented in Section 4.2.
By clarifying and exemplifying the problems that exist in the current situation and identifying those factors most suitable to improve the situa-tion. A reference model for the use of visualization in the execution of NPD was developed. The importance of the research area both practically (in industry) and theoretically was demonstrated by clarifying the rela-tionship between different parts of the design process and the implemen-tation of development projects.
A clear description of the important factors in the visualization of the product and the gaps identified in the SME led to the development of a new method for visualizing the product.
Case C, presented in Section 5.1.
The purpose of Case C was to develop a practical model using visualiza-tion, thereby increasing the performance of project execution. Based on the factors listed in Case B, a method was designed for improving the suc-cess criteria in product development execution.
The implementation of the model in a NPD project to verify and eva-luate the method were made.
2.3. Data collection
The conducted interviews in Cases A and B were mainly semi-struc-tured, but during the interviews open questions arose. The respondents were industrial designers, product developers, innovators, innovation consultants and project managers.
The selection of the companies was done according to the criteria of SMEs with 20-200 employees and with in-house design engineers. The final selection was based on the availability and applicability of the com-pany. The number of interviews conducted was 26, and the interviews were performed during a time of six months.
To gain an understanding of how and why visualization is used when executing NPD, the interviews illuminate the subjective experience of the situation, and the use of “the grand tour” is a possibility to reconstruct the significant part of the experience. The directed open interview creates an open climate where insight is gained in a natural way.
The direct observations have been conducted primarily by observing the work of a number of workshops within Cases B and C. There, the aim has been to develop new concepts in a specific field. Notes and pictures have been taken during and after each workshop. The work material has also been copied.
By using Direct Observation, the data can be used to provide additional information about the topic being studied (Yin, 1994). The environmental conditions and the behaviors can be used as evidence and provide useful validation to other sources of data collection.
To be able to collect data from ongoing NPD projects, Participation Ob-servation has been used. This opens up access to otherwise closed events (Yin, 1994). During the development of methods and tools for the support in NPD, the need for direct reconfiguration is important. Participatory Observation provides this opportunity.
A literature study was carried out to get a clear picture of the latest practice and scientific use of visualization. The researchers studied orien-tations of the literature, whose topics included design management, vi-sualization, product development, innovation, design and product reali-zation. The sources studied were books and academic papers published in conference proceedings and journals.
2.4. Summary
The main focus in this research has been on developing useful methods and tools for industry in an applied research project.
The scientific motivation for this research can be found in areas such as the importance and need for visualization and communication in pro-duct development execution. Meanwhile, the industrial motivation exists within the development of processes, methods and tools to create suc-cessful products.
In order to understand how and why visualization can be used in pro-duct development and how visualization contributes to the execution of product development, three research questions have been formulated (Section 1.4). According to these questions, a research design has been made focusing on understanding the area and developing support for the problem findings.
The references and background of this research need
to be defined in order to develop support industry could
benefit from. The theoretical foundation in this research
extends from three different areas: design processes,
innovation and communication. These areas are
merged into a conceptual framework that serves as the
foundation of the research.
The problem with qualitative research where the researcher’s own background and identity affects the study and result is commonly treated as bias. In this research, the view of Maxwell (2005) is embraced:
“any view is a view from some perspective, and therefore is shaped by the location (social and theoretical) and “lens” of the observer”(p. 39).
When constructing the conceptual framework, Maxwell (2005) sug-gests that it contains four main sources for the modules. They are the following:
Your own experiential knowledge Existing theory and research
Your pilot and exploratory research Thought experiments
A background of the researcher’s own experiential knowledge about the area of visualization for product realization is summarized in Section 1.2, and the remaining three sources will be presented below. The next section starts with an introduction and definition of the research fields. These fields will be merged into a conceptual framework in Section 3.4.
3.1. Design Processes
Within the area of design, design science and design research, there is a close relationship between the theoretical base, the methodology and the studied artifact. To be able to meet the new challenges and complexity in products and services, the communities of innovation, art and design are merging. This emphasizes the need for different thinking, whether the products are professional tools, machinery for production, medical equip-ment, daily consumer goods, services or experiences. The importance of industrial design competency is described by Utterback et.al (2006). Indu-strial designers have the necessary competency to integrate customers’ needs into a product with the intended form, functionality and other de-sign values. This competency is necessary for multi-disciplinary teams, giving the possibility to capture “the whole”, focusing on the intended values the product should communicate.
Design means:
“making sense of something, distinguishing it by a sign, giving significance, designating its relation to other things, owners, users and goods” (Verganti, 2009, p.26).
Design can be described in two different ways – as a process of desig-ning or as a designed product or service (Clarkson & Eckert, 2005; Blessing & Chakrabarti, 2009). However, it is difficult to distinguish the design process from the designed product or service, since the design of the pro-cess influences the final product. Design occurs in engineering as engine-ering design or in many other domains as industrial design, visual mana-gement, spatial design, information design or interaction design. Today, a product or service must emphasize more than functionality, esthetic elegance, simplicity, economy of means and low impact. It must also tell us a story that we as customers can identify ourselves with. Conformity between the product and the company message is desirable in this sense. Design is about understanding the users´ need, and through that creating the product´s story as the deeper wishes, values and emotions of the users (Utterback, et.al, 2006; Verganti, 2009; Brown, 2009).
The design process is a model for the application of design in product development. It is part of the company’s entire development process and is used to achieve successful, creative results through the medium of de-sign skills and know-how. The dede-sign process can be applied to many different areas and projects that concern processes, messages, goods, services, or environments. The review of these models has been done thoroughly by Clarkson and Wynn (Clarkson and Eckert, 2005) and Cross (2000), for example.
The process is described and explained by many authors and resear-chers, among those Ulrich and Eppinger (2003), and is commonly used in practice. Ulrich and Eppinger’s model consists of six phases, these phases, and especially phase (1) Concept Development, are presented with detai-led methods and decomposed of their constitutive activities. :
(0) Planning
(1) Concept Development (2) System-Level Design (3) Detail Design
(4) Testing and Refining (5) Production Ramp-Up
Cross (2000) categorizes the different maps or models of the design process into two groups, namely descriptive and prescriptive models. The descriptive models describe a sequence of activities that occur when de-signing. The prescriptive models try to prescribe (and persuade us to em-ploy) a better way of designing through a systematic procedure, a design methodology. The prescriptive model or methodology can be divided into steps that are similar to the descriptive models. However, what characte-rizes the prescriptive models is the fact that they suggest improvement of the descriptive models. The reason for developing new prescriptive models is that the descriptive models of designing tend to come up with solutions early in the process. This can lead to overlooking important ele-ments and not thoroughly investigating the real problem, which in turn can result in a ”solution” that does not answer the real problem.
One problem in communicating this model is the complexity of the iterative process that characterizes the design processes. However, design firms partially solve this problem by communicating the linear stage-gate-model to their customers, but applying an iterative process when designing the solution.
“Swedish design firms claim that they follow processes that are mostly standard and linear: some firms use specific tools and metrics. (In reality, processes are not always linear, but there is a feeling that clients wish to see understandable logic.)” (Utterback et.al., 2006).
However, this usage of stage-gate-models as a communicative strate-gy can lead to misunderstanding, both for the customer and the design team involved with the project. Clarkson and Eckert (2005) explain how a design process should be tailored to the product in development, the competency of the design team and the aspiration of the users. The know-ledge of the product, process and users is vital if the design team is to learn from past successes and failures. One could argue the importance of communicating the process as an iterative learning process, where every step leads to new knowledge about the problem and a new understanding of the solution. This creative learning process is something that charac-terizes the design process and should be held in focus when communica-ting the process.
“there are a few design companies that have developed their businesses from a well-defined concept and product creation process. Typically these companies excel in designing clear processes for creative tasks.” (Keinonen and Takala, 2006)
IDEO, one of the world’s most famous design firms, has developed a process that focuses on the user experience and situation. The “Deep Dive” IDEO created is based upon observations, rapid 3D visualization and modeling of ideas. They are highly creative and use visualization as a method for communicating between all the phases in the process. This is most legible in the iterative cycle of visualizing, modeling, evaluating and refining. However, visualization functions as systematic support th-roughout the process.