THESIS
ANALYSIS OF TRACE AMOUNTS TO DETECT EXPOSURE TO TRICLOSAN AND TRICLOCARBAN IN CROPS GROWN IN SOIL AMENDED WITH HUMAN BIOSOLIDS
Submitted by Mary Gretchen Malberg
Department of Environmental and Radiological Health Sciences
In partial fulfillment of the requirements For the Degree of Master of Science
Colorado State University Fort Collins, Colorado
Fall 2018
Master’s Committee:
Advisor: Howard Ramsdell Marie Legare
Copyright by Mary Gretchen Malberg 2018
ABSTRACT
ANALYSIS OF TRACE AMOUNTS TO DETECT EXPOSURE TO TRICLOSAN AND TRICLOCARBAN IN CROPS GROWN IN SOIL AMENDED WITH HUMAN BIOSOLIDS
A method to detect trace amounts of both triclosan, (TCS) and triclocarban (TCC) using gas chromatography with an electron capture detector (GC/ECD) was created to test compound uptake by dryland corn from biosolids fertilization. Corn was harvested from a field that had been amended with human biosolids since 1982 which was part of a research study being conducted by Colorado State University, College of Agricultural Sciences, Soil and Crop Sciences Department. Both TCS and TCC are lipid soluble and contain functional groups that could be derivatized. Derivatization of the compounds improved chromatography results by making compounds more volatile and stable at higher temperatures and increase detection limits to 0.05 ng/ml for TCS and 0.1 ng/ml for TCC. Derivatization was done with BSTFA
(N,O-bis(trimethylsilyl) trifluoroacetamide) + 1% TMCS (trimethylchlorosilane ). The method described in this paper holds the potential fordetecting other pharmaceutical products, compounds from personal care products, and over-the-counter agents that contain
halogenated phenol groups. Triclocarban was not detected in corn from the control or biosolid amended fields at statistically significant amounts. Triclosan was found in increased amounts in corn that was grown in fields that were amended with biosolids. The mean results for TCS in corn from the control field were 11 µg/ml and for the bio-solid amended field the mean was
iii
140 µg/ml, indicating that corn from bio-solid amended fields had a greater than 10-fold increase in concentrations of TCS compared to fields not amended with human biosolids.
ACKNOWLEDGEMENTS
I would like to acknowledge my advisor, Howard Ramsdell, PhD and the Department of
Environmental and Radiological Sciences in the College of Veterinary Medicine and Biomedical Sciences at Colorado State University in Fort Collins, Colorado, for the opportunity to be involved in research and contribute to our understanding of the toxicology of biosolids in agriculture.
I would like to acknowledge Marie Legare, DVM, PhD, Sybil Sharvelle, PhD and Ann Hess, PhD for their contributions to this project.
v DEDICATON
I would like to dedicate this work to my parents. Marilyn and Philip (Dutch) Malberg for believing in me and loving me through this transition in my life. With your love and support, I know I am moving in a positive direction. Thank you for your prayers! I love you!
To my children, Elenya Grant, Isabelle Grant and Myles Grant, thank you for your love and patience! This transition has taken much longer than previously expected and you have been patiently waiting. You were the reason I kept moving forward! Without your presence and inspiration, I would not be where I am now. I love you! I am proud to be your mother.
TABLE OF CONTENTS ABSTRACT ... ii ACKNOWLEDGEMENTS ... iv DEDICATON ... v INTRODUCTION ... 1 BACKGROUND ... 3 HYPOTHESIS ... 4 OBJECTIVE ... 5 LITERATURE REVIEW ... 6
Human Biosolids and Use in Agriculture ... 6
TCS and TCC in the Environment ... 7
Metabolism of TCS ... 11
Metabolism of TCC ... 12
TCS and TCC Endocrine Disruption ... 14
TCS ... 14
TCC ... 16
EXPERIMENTAL PROCEDURE ... 18
Derivatization ... 18
Sampling Location, Conditions, and Harvesting... 19
Preparation of Chemicals ... 21 Extraction ... 22 Derivatization Method ... 23 Injection Technique ... 23 GC/ECD Instrument ... 24 GC/MS Analysis ... 24 RESULTS ... 25 Method Validation ... 27
Corn Residue Data ... 29
Exposure Assessment Data of TCS and TCC ... 31
DISCUSSION ... 33
vii LIST OF TABLES
Table 1: Half-Life of TCS and TCC. ... 10 Table 2: Physical Properties of TCS and TCC (pubchem.ncbi.nlm.nih.gov/compound/triclosan,
pubchem.ncbi.nlm.nih.gov/compound/triclocarban). ... 10 Table 3: Quantification of TCS in µg TCS/g fresh weight of corn. ... 29 Table 4: Measurements of TCC in ug/ml per gram of corn in control and experiment fields. ... 31 Table 5: Acceptable Daily Intake values based on plants grown in manure, biosolids or lands irrigated with wastewater . ... 32 Table 6: Exposure values for corn grown in human biosolids ... 32
LIST OF FIGURES
Figure 1A and 1B: Chemical Structures of TCS and TCC. ... 9
Figure 2: Biotransformation of TCS: metabolism of TCS into glucuronides and sulfates. ... 12
Figure 3: TCC Metabolism . ... 13
Figure 4: the silylated compounds of TCS and TCC after derivatization with BSTFA-TMCS ... 18
Figure 5: Flow Chart of solid waste treatment at the South Platte Water Treatment Facility in Colorado. tysongriswold.com/what-happens-when-you-flush-your-toilet ... 20
Figure 6: The chromatogram of BSTFA-TMCS after being filtered through a Florosil column. ... 25
Figure 7: Analysis of TCS and TCC standards by GC-ECD. ... 25
Figure 8: Chromatogram of an extract of a corn sample from a plant grown in biosolid amended soil. ... 26
Figure 9: The same corn sample as above, spiked with both TCS and TCC. ... 26
Figure 10: Chromatogram of an extract of a corn sample from the control plot (without biosolid amendment). ... 26
Figure 11: Chromatogram 1 ug/ml standards of TCC and TCS. ... 27
Figure 12: Mass Spectrum of TCS standard. Molecular ion at 288 and 360. ... 28
Figure 13: Mass spectrometer of TCC spike. Molecular ion 314 for parent TCC, at 386 for TCC + TMS and 458 molecular ions for TCC + 2 TMS. ... 28
1
INTRODUCTION
Human biosolids and animal manure are commonly used to amend agricultural lands to compensate for nutrient loss from crop growth in place of commercial fertilizers. The practice of irrigating lands with wastewater to help compensate for moisture loss and allow crops to be grown on lands not originally suitable for agriculture has also become a common practice. In all these practices, contaminants have been found from both pharmaceuticals and personal care products in soil and plants (Aust et al., 2008; Colderon-Preciado et al., 2011a; CCME, 2010; USEPA, 2009a). In many areas of the world, livestock are dosed with sub-therapeutic levels of antibiotics to promote growth. Subsequent analysis of livestock manure has shown traces of antibiotics applied as part of animal husbandry in addition to compounds found specifically in human personal care products (Aust et al., 2008; Awad et al., 2014; Ben et al., 2013; Sura et al., 2014; Wang et al., 2014). This paper addresses the pathways by which these compounds may enter livestock food sources.
Originally, the use of biosolids to amend farmlands was implemented as part of the amended Clean Water Act of 1972 (USEPA, 2007). Over the years, the scientific community became concerned about the pharmaceuticals, personal care products, and over-the-counter
medications that are not being removed by our current water treatment systems and which might ultimately end up not only in our drinking water (Haldon and Paull 2005) but also our agricultural land and the food grown in biosolid amended agricultural soils (McClellan and Halden 2010).
Studies have shown that chemicals from personal care products can accumulate in plants that are grown in biosolids, manure and/or watered with wastewater (Boxall, et al., 2006). Uptake of these chemicals by plants could pose a potential health risk to humans as direct consumers of plant products. The extent to which this uptake by plants is passed to domestic livestock and then on to humans as secondary consumers is not well documented. Little is known about TCS and TCC uptake in dryland corn that is grown in biosolid-amended soil which is a primary feed source for cattle.
Common sources of endocrine disrupting compounds entering the waste water stream are personal care products containing antibacterial compounds TCS and TCC. Both TCS and TCC have been identified in biosolids with a gas chromatograph coupled with an electron capture detector (GC/ECD)(Prosser, Lissemore, et al. 2014). This paper examines the uptake of TCS and TCC into corn grown on soils amended with human biosolids.
3 BACKGROUND
Prior to September 2016, both triclosan (TCS) and triclocarban (TCC) were found in many cosmetics, toothpaste, laundry detergent, soaps, and incorporated into toys (Witorsch and Thomas, 2010). On September 2, 2016, the United States Food and Drug Administration issued a ruling to have products that contained these antibacterial compounds removed from over- the-counter products. However, this ruling did not include hand sanitizers, antibacterial wipes or any products used in a hospital setting (USFDA, 2016).
The lipophilic nature of both TCS and TCC suggests that these compounds could be found in corn as corn has a lipid profile of 11% fat (see https://ndb.nal.usda.gov/ndb/). As it is difficult to obtain access to commercial farm fields where biosolids are used, this study was conducted on an experimental plot maintained by the Colorado State University, Department of Soil and Crop Sciences where biosolids were currently being applied to grow dryland corn.
HYPOTHESIS
Elevated levels of TCS and TCC are present in corn grown on biosolid-amended soils when compared to corn grown without biosolid amendment.
5 OBJECTIVE
The objective of this study was to develop a method that is low cost, efficient as well as effective in detecting trace amounts of TCS and TCC in food crops. The method will optimally be designed to use common laboratory equipment with minimal chemicals and not demand time in setting up special apparatus or require large amounts of space or benchtop surface area.
LITERATURE REVIEW
Human Biosolids and Use in Agriculture
The practice of using human waste (biosolids) as an amendment to agricultural lands has been practiced in China for thousands of years. The farmers in China used “night soil” from
surrounding communities to maintain soil fertility (USEPA, 1979). By using “night soil,” the farmers closed a nutrient cycle by returning nutrients to the people through the crops that were exported back to the cities. The Chinese were advanced for their time in avoiding a potential contamination of water supplies by recycling the waste of the communities in their agricultural areas.
In contrast to China, Europe built sewage pipes to drain the waste to waterways (USEPA, 1979). Heavily contaminated wastewater was discharged into rivers without treatment. Some waste was taken to farmlands outside of cities for soil amendment, but as populations increased, not all of the waste that was being generated could be transported to the farmlands. The
remaining waste was transferred to waterways, which later became the source of cholera outbreaks that plagued Europe in the 19th Century (USEPA, 1979).
About 150 years ago, preceding the introduction of the flush toilet and sewer systems,large scale application of sewage to croplands was introduced in Western Europe and North America. The lands that were receiving sewage became overloaded and soil pores became clogged,
which led to soil waterlogging and contaminated crops (USEPA, 1979). Eventually, the amount of waste from the cities overwhelmed the sewage farms and the farms were phased out as technologies were developed for the removal of wastes from the sewage water (USEPA, 1979).
7
In 1899, the United States began passing federal legislation to control water pollution. Coming full circle in 1972, the Federal Water Pollution Control Act Amendment increased restrictions on waste water discharges to waterways and encouraged biosolids to be applied to the land. Increased restrictions on disposing of waste to the oceans or landfills have now made land application the only option for many municipalities (USEPA, 1979).
Biosolids are an end-product from the wastewater treatment process. Biosolids are
concentrated organic matter that are nutrient dense solids that can be in found in many forms, depending on the treatment process. Using biosolids on crop lands was viewed as a logical advancement from using human excrement, untreated sewage, and animal manure. The use of biosolids as an agricultural amendment has been occurring in the United States since 1907 (USEPA, 1979).
TCS and TCC in the Environment
As nutrient deficiencies have increased in agricultural land, it is becoming essential to sustain nutrients such as phosphorus by applying commercial fertilizers or, more recently, biosolids (Clarke, 2011). Land application of biosolids is a common and internationally favored
management practice for the use of human waste (Clarke, 2001). However, compounds found in personal care products and pharmaceuticals are being found in agricultural lands where biosolids had been applied (Prosser, Lissemore et al., 2014). Approximately 50% of biosolids produced in the United States are applied to farmland (USEPA, 2007). It has been suggested that the pharmaceutical TCC, once applied to agricultural lands, will persist in soil, soil
understand that crops that are grown in biosoilds have the potential to take up these pharmaceutical residues and translocate these compounds into the above-ground tissue of plants (Wu, Spongberg et al. 2010).
Two compounds that are consistenly found in biosoilds areTCS and TCC, (see figure 1A and 1B (Prosser, Lissemore et al. 2014). Triclosan and TCC were once commonly used in personal care products as antimicrobial compounds (Witorsch and Thomas, 2010). Triclosan and TCC were historically found in 45% of bar and liquid soaps, as well as in mouthwashes, toothpaste, cosmetics, fabric, plastics, pharmaceuticals, and toys (Witorsch and Thomas, 2010). Triclosan was developed in Switzerland and used as a pesticide and was then introduced to the United States in the 1960s intially in deodorant soaps (Giuliano and Rybak, 2015). Triclosan initially was used in hospitals as an antiseptic in surgical scrubs and later gained popularity due to the ease by which it could be incorporated into products as the result of its high boiling point (Giuliano and Rybak, 2015). Due to the wide scale use and increased use of TCS in consumer products, concerns of microbial resistance wereraised in the scientific community (Giuliano and Rybak, 2015).
9
TCS TCC Figure 1A and 1B: Chemical Structures of TCS and TCC.
Triclosan and TCC are found at greater concentrations in biosolids compared to other chemical constituents in peronal care products (Prosser, Lissemore, et al. 2014). Because TCS and TCC are hydrophobic and persistant, they partition into the biosolid portion of human excrement (Prosser, Lissemore, et al. 2014). The half life of TCS in the biosolid fraction ranges from 182 days to 193 days, and for TCC, the half life ranges from 87 days to greater than 1000 days. The ranges in half-lives (see table 1) of both compounds in the environment depends on the type of soil where the biosolids were applied as well as whether the environment is aerobic or anerobic (Ying, et al., 2007). These long half-lifes gives plants the opportunity to be exposed to these two compounds over the majority of their life cycle (Prosser, Lissemore, et al. 2014).
Table 1: Half-Life of TCS and TCC.
Blood Soil Water
TCS 29 hoursa 182-193 daysc 10 days e
TCC 8.6 hoursb 120-540 daysd NA
a
Siddiqui and Buttar, 1979 b
Scharf, 1975 c
Walters, McClellan, Halden, 2010 d
Haldon and Paull, 2005 e
SCCP (Scientific Committee on Consumer Protection), 2005 NA: Not available
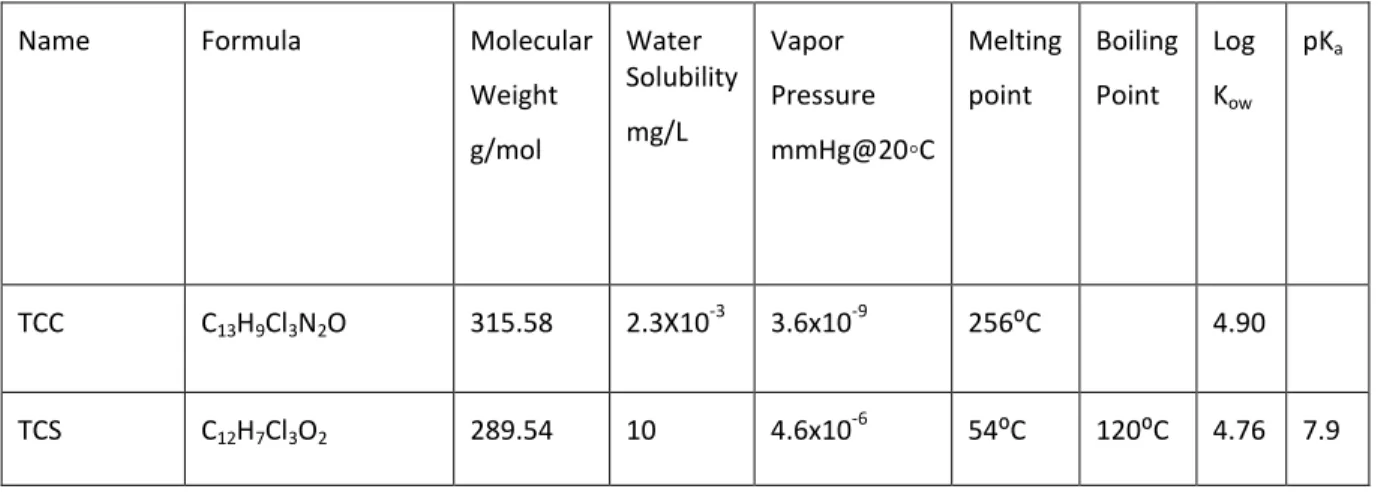
Table 2: Physical Properties of TCS and TCC. pubchem.ncbi.nlm.nih.gov/compound/triclosan, pubchem.ncbi.nlm.nih.gov/compound/triclocarban.
Name Formula Molecular Weight g/mol Water Solubility mg/L Vapor Pressure mmHg@20◦C Melting point Boiling Point Log Kow pKa TCC C13H9Cl3N2O 315.58 2.3X10 -3 3.6x10⁻⁹ 256⁰C 4.90 TCS C12H7Cl3O2 289.54 10 4.6x10 -6 54⁰C 120⁰C 4.76 7.9
TCS is lipophilic and accumulates in the fatty tissue of mammals as well as in the urine, breast milk, amniotic fluid, and blood (Giuliano and Rybak, 2015). It has low water solubility and has been found in wastewater and biosolid material (Gatidou, Thomaidis, et al. 2007). Triclosan reaches the sewage treatment facilities through both the liquid (urine) and solid (feces) form.
11
TCS is not completely removed by the wastewater treatment process and is discharged in the effluent matrix (Sanchez-Prado, 2008) in addition to being found in biosolids. Triclosan has been found in wastewater, surface water, seawater, and sediments in both Europe and the United States (Sanchez-Prado, 2008).
Metabolism of TCS
Triclosan is most commonly absorbed through the skin with the use of lotions, shampoos, soaps and toothpaste (Fang, et al., 2010). Once applied to skin or absorbed into the mucosal
membranes of the mouth in mammals, TCS can be detected in urine and feces within 1 to 3 hours of application to mice (Fang, et al., 2010). TCS has been measured at high quantities in the gall bladder, liver, body fat, lungs, kidneys, blood, heart, testes, spleen, and brain in mice (Fang, et al., 2010). TCS is quickly metabolized to its glucuronide and sulfate conjugates. Four hours after the application of lotions containing TCS to skin of human volunteers, the sulfate conjugate was the only detectable metabolite. Both the sulfate and glucuronidated metabolite were present 8 to 24 hours after application (Fang, et al., 2010). In humans, the major fraction of TCS was excreted in the urine within 24 hours with a median of 54% being excreted over 4 days in the form of its sulfate and glucuronide conjugates (Fang, et al., 2010).
Figure 2: Biotransformation of TCS: metabolism of TCS into glucuronides and sulfates.
Metabolism of TCC
TCC has previously been used in antibacterial bar soaps and is absorbed through the skin (Schebb et al., 2012). After the initial Phase 1 metabolism which forms a hydroxylated TCC, the metabolites undergo Phase II metabolism in which TCC undergoes N-glucuronidaton at the urea nitrogen, resulting in TCC hydroxylated glucuronic acid conjugates (Birch et al., 1978). TCC is eliminated by humans through both biliary and renal routes after glucuronidaton (Schebb, et al., 2012). It was discovered that 54% of TCC cleared the blood in 8.6 hours through the feces
and 21% of the dose was eliminated through the urine (Scharpf, 1975), which leaves 25% unaccounted for in the above study. However, clearance of TCC from the human body is not 100%. A recent paper by Yang et al., suggests that glucuronidaton does not allow for complete clearance of compounds from the body and that glucuronidaton allows for an enterohepatic
13
cycling mechanism to take place in the gastrointestinal tract. Therefore, the half-life of TCC is increased (Yang, G., 2017).
Figure 3: TCC Metabolism. Major metabolites of TCC in mammals are the glucuronides: 2’OH-TCC, 3’-OH-TCC and 6’-OH-TCC (Birch et al., 1978).
According to the European Commission: Health and Consumer Protection Directorate-General: Scientific Committee on Consumer Products (SCCP, 2005), TCC is lipophilic and absorbed through bacterial cell walls, subsequently interrupting the function of proteins and causing a
discharge of ions and organic molecules from the cell. The antibacterial effects of TCC depend on the concentration that is used. Triclocarban inhibits the growth of both gram-positive and gram-negative bacteria, by disrupting the function of the interstitial proteins as well as increasing the permeability of the cell membrane and thus, allowing for loss of the ions and proteins through the cell membrane, thus increasing risk of microbial resistance in humans (Heath et al., 2000; SCCP, 2005).
TCS and TCC Endocrine Disruption
Both TCS and TCC have been shown to disrupt the endocrine system by interacting with the aryl hydrocarbon receptor (AhR), estrogen receptor (ER), the androgen receptor (AR), as well as the thyroid receptor (Witorsch and Thomas, 2010), albeit in different ways.
TCS
Triclosan at a 106 molar excess (400 µM) has been reported to displace estradiol from estrogen receptors of human breast cancer cells MCF-7 (Gee et al., 2008). Proliferation of MCF-7 cells stimulated by 10-10 M estradiol was blocked by TCS at a concentration of 10-5 M (Gee et al., 2008). Triclosan also up-regulated the pS2 gene, which is marker of hormone dependent breast cancer cells; and down-regulated the expression of ERα at the mRNA and protein levels of the MCF-7 cells (Huang, 2014).
Anti-androgenic activity of TCS was observed in cell proliferation and reporter gene expression at concentrations of 10-6– 10-7 M (Gee et al., 2008)
15
TCS does bind to the androgen receptor with high affinity, however, the ability of TCS to affect testosterone levels is dose dependent. TCS displaced testosterone from binding to the
androgen receptor in rats; since the androgen receptor was antagonized, the increased testosterone in the blood stream lead to an increase of tumor growth in mouse mammary glands (Witorsch and Thomas, et al., 2008). When TCS concentrations were at 10-7 M,
testosterone was inhibited by 40 to 50% (Witorsch and Thomas, et al., 2008). A study done by Lan et al., showed that exposure of Sprague-Dawley rats to TCS decreased sperm production, morphed sperm cells and damaged the tissue of the epididymis of the rats (Lan et al. 2013). When TCS was given to rat pups for 30 days, the livers and pituitary glands were enlarged (Zorrilla et al., 2009). TCS activity with the Ah receptor was measured and compared to a positive control of 2,3,7,8- tetrachlorodibenzo-p-dioxin (TCDD) which is a known endocrine disruptor and its mechanism of actions have been well documented. At a concentration of 10nM, TCS increased AhR activity by 40% which indicates an agonist activity, which was similar to that of TCDD at a concentration of 1nM (Ahn, et al., 2008). However, at the same
concentration TCS displayed an increase of antagonist activity by 30% by inhibiting the expression of AhR (Ahn et al., 2008), thus making TCS a partial agonist(Ahn et al., 2008). The effect of TCS on the thyroid showed decreased concentrations of thyroxine (T4) from 28% to 53% (Croften et al., 2007). After Wistar rats were feda 31-day diet that was supplemented with TCS, the authors reported an erratic pattern of the thyroid hormone triiodothyronine (T3). T3 levels in the blood were increased at the 3 mg/kg dose of TCS and decreased at the 200 mg/kg dose of TCS (Zorrilla et al., 2009). The side-effects of endocrine disruption in aquatic animals exposed to triclosan included: loss of secondary sexual characteristics, decreased egg fertility,
femininization of males, masculinization of females, an increase in intersex, and finally an increase of embryo fatality and deformities (Giesy et al., 1998).
TCC
Triclocarban interferes with the regulation of the aryl hydrocarbon receptor by decreasing the effect of transcription of both CYP1A1 and CYP1A2 while in the presence of estrogen (Tarnow et al., 2013). Triclocarban concentrations of 1 and 10uM decrease the influence of AhR by 35%
and 45%. which is similar to the effect of 1nm concentrations of (TCDD) (Ahn et al., 2008). Triclocarban concentrations of 1 and 10 nM potentiated the effect of estradiol (Ahn et al., 2008) and was able to amplify the effect of estradiol in a cell mediated bioassay involving human ovarian cancer cells by 20% at a concentration of 0.1 µM. When TCC concentrations were increased to 1uM there was a greater than 40% increased effect of estradiol and at an increased concentration of 10 µM TCC was found to decrease estrogen activity. (Ahn et al., 2008). When estrogen levels are low there is an increase in weight, depression, weak bones, irregular periods, hot flashes and infertility (Hunter and Carek, 2003). Triclocarban does not bind to the androgen receptor; however, TCC does increase the effect of testosterone (Chen et al., 2008). At testosterone concentrations of 10uM, there was a 25% increase in testosterone
in the presence of 1uM of TCC (Chen et al., 2008) which shows the co-stimulating effect that TCC has on testosterone (Tarnow et al., 2013) When rats were fed a diet supplemented with TCC (0.25% w/w) and testosterone propionate (0.2mg/kg), there was a 50% increase in prostate weight (Chen et al., 2008). Higher than normal levels of testosterone in women have been associated with increase facial hair, abnormal changes to genitalia as well as infertility (Hunter
17
and Carek, 2003). When testosterone levels in adolescent human males increased, there was an increase of infertility, early puberty and a precocious sex drive (Bagatelle and Brenner, 1996).
EXPERIMENTAL PROCEDURE
Derivatization
Derivatization was used in this procedure to aid in the detection of trace amounts of TCS and TCC extracted from the corn. To increase the gas chromatographic analysis of both and TCS and TCC, it was necessary to increase the volatility of both compounds. BSTFA with 1% TMCS was chosen as the derivatizing agent to increase the volatility and stability of the compounds and to obtain narrower and more symmetrical peaks in the final analysis (Katoka, 2005). BSTFA is a widely used reagent for silyation derviatization since it is efficient and effective with the derivaitzation of amides (Orata, 2012). BSTFA and TMCS reacts quickly with organic acids and can be done directly in a mixture (Orata, 2012). TMCS acts as a catalyst and helps the reaction in the presence of amides, as in the case of the TCC. To ensure good silylation, the compound to be derivatized needs to have a good leaving group with an active hydrogen (OH, -NH). The active hydrogen is replaced with the trimethylsilyl group as shown in Figure 4 below.
Trimethylsilyl Tricolsan Trimethylsilyl amideTCC Figure 4: The silylated compounds of TCS and TCC after derivatization with BSTFA-TMCS.
19 Sampling Location, Conditions, and Harvesting
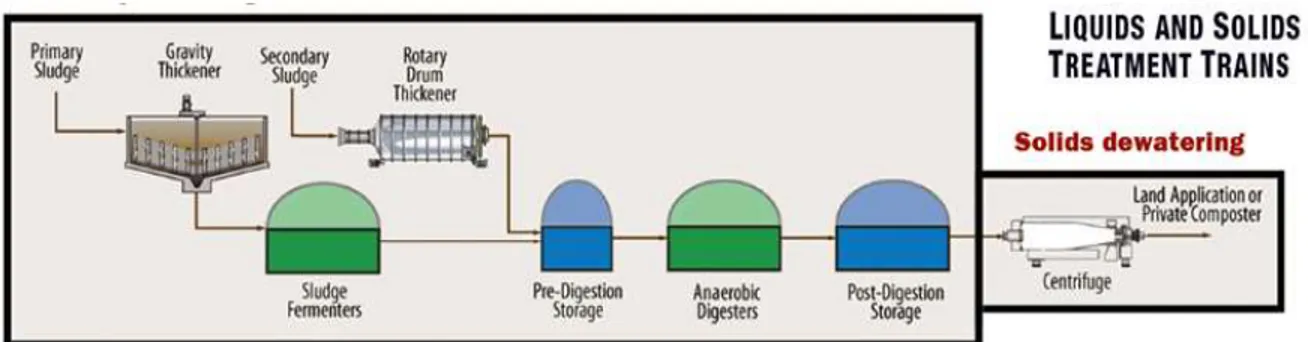
Since 1982, the Department of Soil and Crop Sciences at Colorado State University in Fort Collins, Colorado, had been growing corn in soil amended with biosolids from the cities of Englewood and Littleton, Colorado. The Englewood and Littleton waste water treatement facility is The South Platte Water Renewal Partners (SPWRP). This facility uses a dissolved air floatation tank that allows air to come into contact with the watered sludge (see figure 5 for a flow chart of the solid waste treatment process used at South Platte Water Renewal Partners). This process removes about 90% of the water with a final solid portion about 5%. After the air floatation tank, the sludge travels to an anerobic digestion tank. The anerobic digestion tanks help reduce bacteria and pathogens from the solid fraction, makes the solids less likely to become a food source vector, decreases odor, makes the biosolids inert, decreases the amount of solid fraction and, therefore, reduces the cost of handling and disposal of the biosolids (SPWRP, 2018). The anerobic digestion occurs for 15 days at a temperature of 95°F, which destablizes pathogens and allows the solids to stablize. Methane gas is produced as a by-product and is collected and redistributed within the facility to help generate electricity and heat water for the digesters. After anerobic digestion, the solids are then referred to as “biosolids” and are centrifuged to remove water and then transported and applied to agricultural lands (SPWRP, 2018).
Figure 5: Flow Chart of solid waste treatment at the South Platte Water Treatment Facility in Colorado (SPWTF, 2018b).
The corn crop was being grown in Byers, in Eastern Colorado at 39°45’58.47 N, 103°47’34.90 W. The fields are not irrigated, and the dryland corn is dependent on natural precipitation for moisture. The control fields receive commercial fertilizer andthe biosolid fields receive only fertilization from biosolids. The corn crops were rotated every other year within the treatment plots, with some years having corn and other years having wheat grown as well as some years the plots laid fallow. The control field was next to the biosolid field to ensure identical
environmental conditions. The resulting corn and wheat have been analyzed for the presence of nutrients and metals. However, these experiments had never investigated the presence of pharmaceuticals or compounds from personal care products in the corn (personal
communication, Jim Ippolito, PhD, Department of Soil and Crop Sciences, Colorado State University).
Unfortunately, in the season when collections were planned, a hail storm prior to the
maturation of the corn caused serious damage to the plants. The immature corn was harvested soon thereafter, as no further development of the kernels was going to occur. In spite of the
21
lack of maturity, it was expected that detectable levels of TCC and TCS would be present in the corn at this pre-harvest stage.
The corn was harvested on August 29, 2016. Ears of corn were harvested from each individual field and placed into a labeled 5-gallon bucket. Fresh gloves were worn during the harvesting of each field to eliminate any cross-contamination. Each 5-gallon buckets was placed into a separate, unused 30-gallon trash bag for transportation to the Colorado State University analysis lab in Fort Collins. Once in the lab, husks were removed and the corn was cut off the cob using a knife and cutting board previously cleaned with hexane. Kernels from individual ears were placed in individual plastic sandwich bags. The bags were sealed, labeled, and placed into a 1 gallon freezer bags and placed in a freezer at 4.0°C.
Preparation of Chemicals
TCS (5-chloro-2(2,4-dichlorophenoxy)phenol) was obtained from Alfa Aesar (Tewksbury, MA) and dissolved in hexane to make a stock solution of 1 g/ml. Subsequent lower concentrations of TCS were made from the 1 g/ml stock solution. TCC (3,4,4-Trichlorocarbanilde) was purchased from TCI (Portland, OR) and dissolved in acetone to make a stock solution of 1 g/ml; serial dilutions of TCC were made in hexane.
All pasteur pipets and glassware used for this experiment were cleaned by soaking in acetone for 24 hours, then hexane for 24 hours, baked in an oven at 400◦ C for 24 hours, and then wrapped in aluminium foil and placed in a sealed drawer. Prior to extraction, Florosil (MgO3Si)
columns were made from cleaned Pasteur pipets. These columns were used to help filter out impurties from the supernatant.
To make the columns, Florosil was first heated in an oven for 2 hours at 240 °C to make it anhydrous and then allowed to cool to room temperature. While the Florosil cooled, clean glass wool was inserted into the pasteur pipets using a wooden skewer. After the glass wool was pushed down to the bottom of the pipet, 0.5 grams of Florosil was poured into the top of the pipet. The pipet was gently tapped on a clean bench cloth to pack the Florosil and remove air pockets.
Extraction
A modified method of Geens, et al. (2009) was developed to extract TCS and TCC from corn samples. The control corn samples were analyzed first to eliminate possible contamination from the biosolid corn. Approximately 5.0 grams of corn was weighed using a Sartorius Scale, Model B310 S; the weight was recorded. The corn sample was then transferred to a mortar with 5.0 grams of potassium bromide (KBr) crystals, purchased from Mallinckrodt Chemical Works (Washington, DC). The potasium bromide was ground into the corn to form a paste. The corn/KBr paste was transferred to a labeled 50 ml glass conical tube; 10 ml of methylene chloride was added to the corn/KBr paste in the conical tube, which was then vortexed for 1 minute. After all corn was weighed, crushed, solvent added, and vortexed; the conical tube lids were checked to make sure that they were tightly screwed on and corn samples were placed in a heated ultrasonic bath (Sonicator Branson 1800) and sonicated for 1 hour at 60°C. After sonication in the hot water bath, the concial tubes containg the samples were allowed to cool and then centrifuged using an International Portable Refrigerated Centrifuge, Model PR-2, at 3000 x G for 20 minutes. After the samples were centrifuged, the supernatant was removed
23
using a clean pipet. The supernatant was pipeted into a column that contained glass wool and 0.5 grams of Florosil. The filtered extract was collected in a clean 15 ml conical tube and the solvent was evaporated under nitrogen using an N-EVAP Organomotion Associates, Model 10610. The residue was resuspended with 1.0 ml of acetonitrile. A screw cap was then attached and the tube was vortexed for 1 minute and then set aside for derivitization.
A solvent blank was prepared by running 15 ml of DCM through a Florosil column, followed by evaporation, dissolution in acetonitrile and derivatization of an aliquot.
Derivatization Method
A 100 µl aliquot of the sample was placed into a clean 2 ml glass vial, 50 µl of BSTFA (N,O-bis(trimethylsilyl) trifluoroacetamide) with 1% TMCS (trimethylchlorosilane), purchased from Regis Technologies (Morton Grove, IL), was added to the corn extract, the vial was capped and vortexed, and then placed into a Thermolyne Heat Block, Type 16500, at 90°C for 30 minutes. After heating, the vial was allowed to cool to room temperature, then vortexed before manual injection into the gas chromatograph electron capture detector (GC-ECD), a Helwett Packard GC/ECD 6890 with a 63Ni detector.
Injection Technique
Samples were introduced into the GC-ECD by a manual injection method using a 5µl GC syringe. A 1 µl aliquot of acetonitrile was drawn into the syringe, then 1 µl of air was drawn, followed by a 1 µl aliuot of sample and finally another 1 µl of air. The total 4 µl was injected into the
GC/ECD Instrument
The separation of TCS and TCC was achieved using the following conditions on the gas
chromatograph. The injector temperature was 275°C and the detector temperature was 300°C. The carrier gas was nitrogen at 25 ml/min. The column oven was programmed from 200°C to 290°C at a rate of 10°C/min and the final temperature was held for 3 minutes. The column was a Restek, Rtx-5, 30m, 0.53mm, 1uM film thickness, Bellefonte, PA.
GC/MS Analysis
The GC/ECD method was validated on the GC/MS using a Quattro Micro GC by Micromass MS Technologies. The injector temperature was 275°C. The carrier gas was nitrogen at 25 ml/min. The column oven was programmed from 200°C to 290°C at a rate of 10°C/min and the final temperature was held for 3 minutes. The column used was a Restek Rtx-5, 30m, 0.25 mm I.D, micron film thickness column, Bellefonte, PA. The analysis was done in postive electron mode.
25 RESULTS
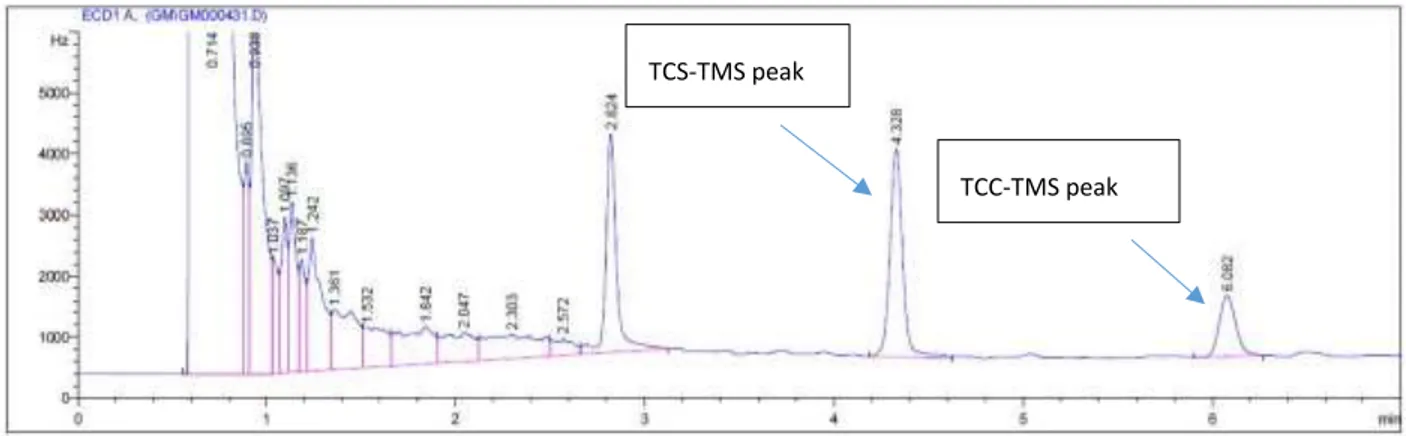
The identification of TCS and TCC was based on the retention times of standards that were run and analyzed along with each set of corn kernel samples. The chromatogram in Figure 6 shows the background signal of a solvent blank treated with BSTFA-TMCS and DCM. A typical
chromatogram for the standard containing TCS and TCC (Figure 7) shows retention times of 4.3 and 6.1 minutes, respectively.
Figure 6: The chromatogram of a solvent blank derivatized with BSTFA-TMCS.
Figure 7: Analysis of TCS and TCC standards by GC-ECD.
TCS-TMS peak
Figure 8: Chromatogram of an extract of a corn sample from a plant grown in biosolid amended soil.
Figure 9: The same corn sample as above, spiked with both TCS and TCC.
Figure 10: Chromatogram of an extract of a corn sample from the control plot (without biosolid amendment).
In the figures above, figure 8 is a chromatogram from the GC/ECD analysis of the corn grown in biosolids; there is only a small TCS peak and no TCC peak. Figure 9 shows the same sample of
TCS-TMS peak
TCC-TMS peak TCS-TCM peak
27
corn as seen in figure 8 that was spiked with standards of both TCS and TCC. Figure 10 is the chromatogram of the corn grown in the control plot. The chromatogram indicates that TCS and TCC were not detected in corn from the control field.
Method Validation
Extraction and derivatization of TCS and TCC were validated by analyzing the corn kernel extracts as well as a 1 µg/ml standard that contained both TCS and TCC on a gas
chromatograph-mass spectrometer (GC/MS) in the Analytical Toxicology Laboratory at
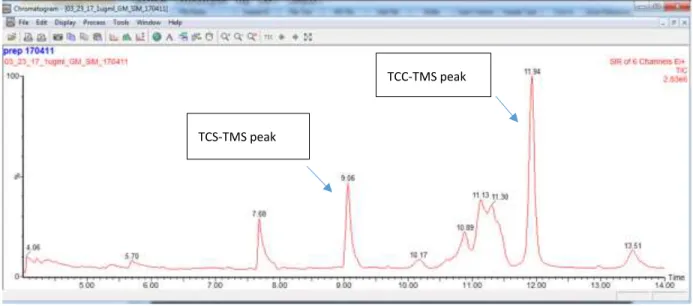
Colorado State University. The chromatogram of the TCS and TCC 1 µg/ml standards is shown below in Figure 11. The TCS peak is at 9.06 minutes and the TCC peak is at 11.94 minutes.
Figure 11: Chromatogram 1 µg/ml standards of TCC and TCS.
In Figures 12 and 13 the mass spectral results are shown for the TCS standard (Figure 12). The fragment at 288 m/z is the TCS parent compound and the peak at 360 m/z is the TCS + TMS molecular ion, which is the result of the derivatization. Figure 13 is the analysis results for the
TCS-TMS peak
TCC spike of a corn sample. The peak at 314 m/z is from the parent compound of TCC, 386 m/z for TCC + TMS and 458 m/z for TCC + 2 TMS.
Figure 12: Mass Spectrum of TCS standard TMS derivative. Molecular ion at 360.
Figure 13: Mass spectrum of a TCC spike extract TMS derivative. The molecular ions at 386 for TCC + TMS and 458 for TCC + 2 TMS are visible along with the fragment ion at 314 corresponding to the parent TCC.
29 Corn Residue Data
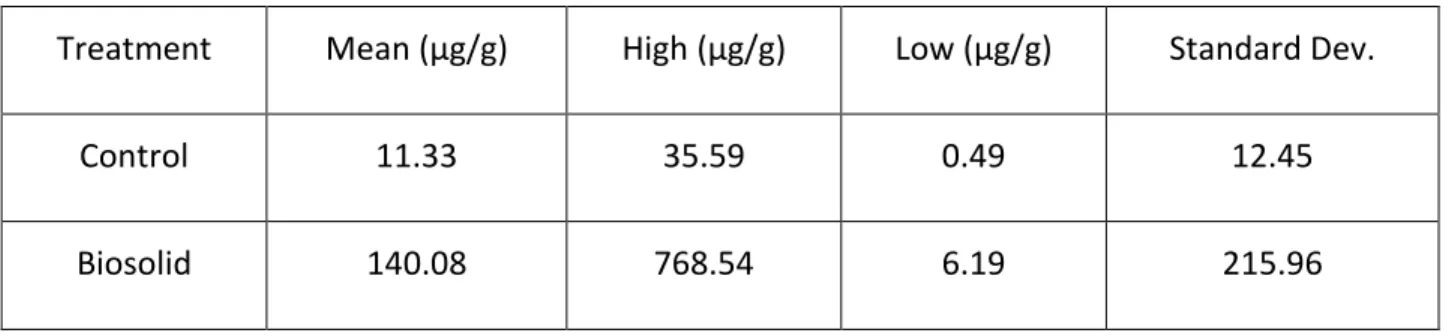
The data were collected by analyzing the standards of TCS and TCC and creating a standard curve. The integrated area for peaks of the analytes was converted to a concentration of TCS in µg or TCC in µg per gram of corn using the line formula for the standard curve. This value was then converted into µg/g as shown in Table 3 for TCS and Table 4 for TCC. The results were then analyzed using R statistical programming software. The control data were for corn that was grown in a field that had only commercial fertilizer applied. Comparing the corn grown in the control field to the corn grown in a field containing human biosolids using the Wilcoxon calculation indicates a significant increase in the concentration of TCS of the corn grown in biosolids (Figure 14) compared to the corn grown in control field (p = 0.038).
Table 3: Quantification of TCS in µg TCS/g fresh weight of corn.
Treatment Mean (µg/g) High (µg/g) Low (µg/g) Standard Dev.
Control 11.33 35.59 0.49 12.45
Figure 14: Boxplot of Biosolid treated plots compared to Control plots. The solid line in each category represents the median and the upper and lower bounds of the box represents the upper and lower values. The C represents an outlier for the biosolid data and the C2 represents an outlier of the control data.
TCC concentrations in the corn were lower and this was expected. TCC is not used as frequently in commercial products. TCC is not as prevalent in antibacterial cleaning or personal hygiene products as compared to TCS. The limits of detection for TCC using this method was 0.1 ng/ml.
Biosolid Control 0 50000 100000 150000 C C2 n g T CS/g fre sh w ei g h t co rn P value=0.038
31
Table 4: Measurements of TCC in ug/ml per gram of corn in control and experiment fields.
Mean
(µg/g)
High(µg/g)
Low(µg/g)
Std. Dev.Control 0.00 0.00 0.00 0.00
Biosolid 0.00 0.01 0.00 0.00
Exposure Assessment Data of TCS and TCC
In 2005 the European Commission Health and Consumer Protection Directorate -General established the No Observed Adverse Effect Level (NOAEL) values for TCS and TCC from studies that were done on rats for 90 days and a 2-year oral toxicity study performed on rats (European Commission Health and Consumer Protection Directorate -General, 2005; Health Canada and Environment Canada, 2012). A safety factor of 300 was assigned to both TCS and TCC which represents factors of 10 for inter and intra- species variability and a factor of 3 for the limited database of information (European Commission Health and Consumer Protection Directorate -General, 2005; Health Canada and Environment Canada, 2012). Table 5 shows the acceptable daily intake (ADI) values for TCS and TCC.
Table 5: Acceptable Daily Intake values based on plants grown in manure, biosolids or lands irrigated with wastewater (Prosser, et al., 2015).
Personal Care compound Use Lowest therapeutic dose (mg/day) No observable adverse effect level (mg/kg/day)
Safety Factor Acceptable Daily Intake (µg/kg/day)
TCC antimicrobial NA 25 300 83
TCS antimicrobial NA 25 300 83
Not Applicable(NA)
The average weight of corn from a cob is 90 grams. At a mean amount of 140 µg of TCS per gram of corn and an average body weight of 70 kg, the TCS exposure calculated for this corn grown in biosolid-amended soil would be 180 µg/kg which exceeds the ADI recommendation if the corn were to be consumed directly by a human instead of livestock for which this corn would normally be intended. Note that the ADI calculation is based upon a lifetime daily exposure. TCC was not detected in the corn, so there is no basis for concern.
Table 6: Exposure values for corn grown in human biosolids. Personal Care Compound Use Lowest therapeutic dose (mg/day) Average concentration in corn from field where biosolids were applied (µg/g) Safety Factor Acceptable Daily Intake (µg/kg/day) Exceeds ADI TCC antimicrobial NA 0 300 83 NO TCS antimicrobial NA 140 300 83 YES NA Not Applicable
33 DISCUSSION
With an increased use of human biosolid augmented soil in agricluture, there is an increased possibility that agricultural products will incorporate halogenated compounds from the biosolids into their biomass. It is hypthesized that the halogenated compounds in biosolids, particullary TCS and TCC, originate from compounds in personal care products. Wu, et al. (2010) analyzed lettuce, spinach, radish and pepper roots, leaves, and stems for the presence of chemical compounds found in personal care products, including TCS and TCC. Macherius et al. (2012) looked at the depth of carrot cells and the uptake of TCS through the entire carrot. Wu et al. (2010) and Macherius et al. (2012) were both able to investigate and confirm that TCS, TCC and other compounds found in personal care products were in fact able to translocate through the soil into the plant.
This study looked specifically at TCS and TCC levels in corn kernels. A method was developed to extract and detect micromolar levels of TCS and TCC in the grain. The results of this
investigation corroborate the data of both Wu et al. (2010) and Macherius et al. (2012) by detecting measureable amounts of TCS in corn kernels from corn grown in soil augmented with human biosolids.
With the positive presence of TCS in the control corn that is shown in Table 3, other factors may need to be investigated in the future. For example, the control corn field was located next to the biosolid corn field; there could be a possibility of TCS leaching through the soil and contaminating nearby fields (Kinney et al., 2008). Another possible explanation for the presence of TCS in the control is that TCS has been monitored and measured in ambient air
(Geens, 2009); the air in the lab and possibly the entire building might have been contaminated with TCS due to several other students working with TCS as well as the custodial staff using products that contained TCS. With the consideration of the possible contamination that was beyond my ability to control and avoid, the amount of TCS in the biosolid corn was much greater than the control and the blank, which indicated that TCS is transferred from the soil of a biosolid treated field to the edible portion of the corn. The limits of detection for TCS using this method was 0.05 ng/ml.
The half- life of TCS in soil is 193 days (Walter, 2010). The corn samples from this study had a growing period of 110 to 140 days, well within that timeframe. Therefore, it is likely that the detection of TCS in corn kernels is a result of TCS contaminated soil. The presence of TCS in the corn indicates that TCS is capable of translocating from the soil into the edible portion of the plant.
According to the EPA, although approximately 61% of biosolids are applied as soil amendments and/or fertilizer to agricultural land in the U.S, less than 1% of the total acreage of agricutural land is amended with these human biosolids (USEPA, 2007). It is advisable that the food grown in these fields is assessed for pharmaceutical drugs, compounds in personal care products and over-the-counterdrugs that are currently not removed through our water treatment facilities.
35 WORK CITED
Ahn KC, Zhao B., Chen, J, Cheredenichenko G, Sanmarti E. 2008. In vitro biological activities of the antimicrobial TCC, its analogs and TCS in bioassay screens: Receptor-based bioassay screens. Envrion Health Prespect 116: 1203-1210.
Bagatell,CJ, Brenner, WJ. 1996. Androgenginis in men: uses and abuses. New England Journal of Medicine 334: 707-714
Birch CG, Hiles RA, Eichhold TH, Jeffcoat AR, Handy RW, Hill JM, Willis SL, Hess TR, and Wall ME.1978. Biotransformation products of 3,4,4-trichlorocarbanilide in rat, monkey, and man. Drug Metab Dispos 6:169–176.
Cha J, and Cupples, AM. 2009. "Detection of the antimicrobials TCC and TCS in agricultural soils following land application of municipal biosolids." Water Res 43(9): 2522-2530.
Chen J, Ahn KC, Gee NA, Ahmed MI, Duleba AL, Zhao L, Gee SJ. 2008. TCC enhances testrosterone actin: A new type of endocrine distruptor? Endocrinology 149:1173-1179.
Croften KM, Paul KM, DeVito MJ, Hedge JM. 2007. Short-term in vivo exposure to the water
contaminant TCS: Evidence for disruption of thyroxine. Environ Toxicol Pharmacol 24: 194-197 Fang JL, Stingley RL, Beland FA. 2010. Occurance, efficacy, metabolism and toxicity of TCS. Journal of
Environmental Science and Health, Part C, 28:147-171.
Fang JL, Vanlandingham M. 2014. Absorption and metabolism of TCS after application to the skin of B6C3F1 mice. Environmental Toxicology need complete reference
Gatidou G, Thomaidis NS, Stasinakis AS, and Lekkas TD. 2007. Simultaneous determination of the endocrine disrupting compounds nonylphenol, nonylphenol ethoxylates, TCS and bisphenol A in
wastewater and sewage sludge by gas chromatography-mass spectrometry. J Chromatogr A 1138(1-2): 32-41.
Gee RH, Charles A, Taylor N, Darbre PD. 2008. Oestrogenic and androgenic activity of triclosan in breast cells. J. App Toxicology. 28:78-91.
Geens T, Roosens L, Neels H, Covaci.2009. A. Assesment of human exposure to Bisphenol-A, TCS and Terabromobisphenol-A thorugh indoor dust intake in Belgium. Chemosphere 76:755-60. Geens T, Neels H, Covaci A. 2009. Sensitive and selective method for the determination of bisphenol-A
and TCS in serum and urine as pentafluorobenzoate-derivatives using GC-ECNI/MS. Journal of Chromatography B, 877 p 4042-4046.
Giesy JP, Snyder EM. 1998. In R.J. Kendall, R. L. Dickerson, J.P. Giesy and W.A. Suk (Eds), Principles and
processes for evaluating endocrine disruption in wildlife (pp 155-237). Pensacola SETAC.
Giuliano C A, Rybak MJ. 2015.Efficacy of TCS as an antimicrobial hand soap and its potential impact on antimicrobial resistance: a focused review. Pharmacotherapy 35(3): 328-336.
Gottschall N, Topp E, Metcalfe C, Edwards M, Payne M, Kleywegt S, Russell P and Lapen DR. 2012. Pharmaceutical and personal care products in groundwater, subsurface drainage, soil, and wheat grain, following a high single application of municipal biosolids to a field. Chemosphere 87(2): 194-203.
Haldon RU, Paull DH. 2005. Co-Occurance of TCC and TCS in US water resources. Environmental Science & Technology 39, 1420-1426
Heath RJ, Rubin JR, Holland DR, Zang EL. 1999. Mechanism of TCS inhibition of bacterial fatty acid synthsis. Journal of Biological Chemistry 274, 11110-11114.,
37
Kataoka H. 2005. Gas Chromatography of amines as various derivatives. Quantification of amino acids and amines by chromatography - methods and protocols. Jouranl of Chromatography Library 70:364-404.
Kinney CA, Furlong ET, Koplin DW, Burkhardt MR, Zaugg SD. 2008. Bioaccumulation of pharmaceuticals and other anthropogenic waste indicators in earhtworms from agriculture and other
anthropengenic waste indicators in earthworms from agriculture soil amended with biosolid or swine manure. Envrion Sci Technol. 42:1863-70.
Lan Z, Kim TH, Bi KS, Chen XH. 2013. Triclosan Exhibits a Tendency to accumulate in the epididymis and show sperm toxicity in male Sprague Dawley rats. Environmental Toxicology. 10:81-91.
Macherius A, Eggen T, Lorenz W, Moeder M, Ondruschka J, Reemtsma T. 2012. Metabolization of the bacteriostatic agent TCS in edible plants and its consequences for plant update assessment. Envrion Sci. Technol. 45:10797-10804.
McClellan K and Halden RU. 2010. Pharmaceuticals and personal care products in archived U.S. biosolids from the 2001 EPA National Sewage Sludge Survey. Water Res 44(2): 658-668.
Orata F. 2012. Derivatization reactions and reagents for gas chromatography analysis in: advanced gas chromatography - Progress in Agriculture, Biomedical and Industrial Applications. Interchopen. p 89-100.
Prosser R S, Lissemore L, Solomon KR, and Sibley PK. 2014. Toxicity of biosolids-derived TCS and TCC to six crop species. Environ Toxicol Chem 33(8): 1840-1848.
pubchem.ncbi.nlm.nih.gov/compound/triclosan pubchem.ncbi.nlm.nih.gov/compound/triclocarban
Sanchez-Prado L, Llompart M, Lores M, Garcia-Jares C, Bayona JM, Cela R. 2006. Monitoring the photochemical degradation of TCS in wastewater by UV light and sunlight using solid-phase microextraction. Chemosphere 65: 1338-1347.
Schebb NH, Franze B, Maul R. 2011. In Vitro Glucuronidaton of the antibacterial TCC and its oxidative metabolites. Drug Metabolism and Disposition. 40 (1) 25-32.
Scharpf LH, Mailbach H. 1975. Percutuneous penetration and dispostion of TCC in man: body showering. Arch Envrion Health 30:7-14.
Scientific Committee on Consumer Products, 2005. Scientific Committee on Consumer Products. SCCP. Opinion on TCC for other uses than as a preservative. European Union. SCCP/0815/04.
ec.europa.eu/health/ph_risk/committees/04_sccp/docs/sccp_o_016.pdf
Siddiqui WH, Buttar HS. 1979. Pharmacokenics of TCS in rat after intravenous and intravaginal administrations. J. Environmental Pathol Toxicology 2:861-871
South Platte Water Renewal Partners (SPWRP). spwaterrenewalpartners.org/wp-content/uploads/2018/07/RESOURCES-Water-Renewal-Process-Detailed.pdf
Tarnow P, Tralau T, Hunecke D. 2013. Effects of Triclocarban on the transcription of estrogen and androgen and aryl hydrocarbon receptor responsive genes in human breast cancer cells. Toxicology in-Vitro. 27; 1467-1475.
USEPA, 1979. A History of Land Applicaton as a Treatment Alternative (acccess April 2016) USEPA, 2007. http//www.epa.gov/owm/mtb/biosolids/genqa.htm (access April 2016).
Witorsch R J, and Thomas JA. 2010. Personal care products and endocrine disruption: A critical review of the literature. Crit Rev Toxicol 40 Suppl 3: 1-30.
39
Wu C, Spongberg AL, Witter JD, Fang M and Czajkowski KP. 2010. Uptake of pharmaceutical and personal care products by soybean plants from soils applied with biosolids and irrigated with contaminated water. Environ Sci Technol 44(16): 6157-6161.
Ying, G.G., Yu, X.Y., Kookana, R.S. 2007. Biological degradation of TCC and TCS in soil under aerobic and anaerobic conditions compared with environmental fate modeling. Environmental Pollution 150, 300-305.
Zorrilla LM, Gibson EK, Jeffay SC, Crofton KM, Setzer WR, Cooper RL, Stoker TE. 2009. The effects of TCS on puberty and thyroid hormones in male Wistar rats. Toxicol Sci 107: 56-64