The dynamics of health and welfare:
a methodological study analysing the two phenomena
in five populations during the early 2000s
Tema Health and Society, Linköping University, Sweden, and
Santé, Population, Politique Sociales, l'École des hautes études en sciences sociales (EHESS), France
Supervisors: Prof. Dr. Sam Willner, Prof. Dr. Richard Rechtman
Nermin Ahmetagić nerah915@student.liu.se
ABSTRACT
This paper aims to describe the dynamics of objective health and welfare in five populations, from the year 2000 to 2009, qua a methodological study. It proposes a three step approach to ensure the validity criteria in the conducted research process:
(1) firstly, to identify the relevant variables as predictors of the two phenomena, empiric studies and sociological theories by Esping-Andersen (1999) Nussbaum (1999, 2000, 2011), were consulted. This (with the data availability) frames the study to include five related categories of objective health and welfare indicators, including (1) demographic (e. g. life expectancy (LE), total fertility rate (TFR)), (2) child-welfare (i. e. under-five mortality rate (U5MR),(3) welfare services (immunization coverage and prevalence of tuberculosis (TB)), (4) education, and (5) indicators on health expenditure (HE). The applied theoretical frame–in a combination with the four posed research questions– indicates a need of an overall methodological approach that is primary quantitative. The data analysis follows an observational epidemiological type that is descriptive study, to analyse the indicators in five populations and two control groups.
(2) The study obtains descriptive data from three data bases, which are selected upon a qualitative analysis, to account for their validity and reliability.
(3) Further data analysis is strengthened qua the inclusion of the two control groups of populations, when appropriate. Since it wasn’t possible to compare data on populations across time, due to different data production methodologies.
Main findings indicate that HE, immunization, TFR, male and female LE, U5MR and school enrolment, tend to diverge between and within the five populations, expressed in absolute and relative terms. The comparison of the estimated data for the five populations with the two control groups of populations, shows that most objective health and welfare indicators tend to converge, (within categories 1, 2 and 3, except TFR) when expressed in absolute and relative terms. When estimated data is analysed in the light of two sociological theories, it is evident that the existing gap between male and female LE, U5MR, and HE indicators can improve further.
ACKNOWLEDGEMENT
First and foremost gratitude goes to the Board of the Phoenix EM: Dynamics of Health and Welfare, and for enabling realisation of this paper. This paper benefited from critical and inspiring comments from professors at the EHESS, ENS and Linköping University, and invited lecturers alike, who were approached regarding this thesis, and in particular supervisor Professor Sam Willner and his time and patience, then Professor Richard Rechtman, and my colleagues at these institutions, who unselfishly contributed with their advices, all which is truly appreciated. The staff at the libraries of Linköping University and Randers, has been most helpful during the entire research process. Further gratitude is expressed to staff at DIIS and Danida, in Denmark, who always responded comprehensively to data requests and queries and thus came up with valuable information to this paper.
All the unquoted views expressed in this paper are of the author, who holds full responsibility. Randers 2011, Nermin Ahmetagic
(Randers is UNICEF city 2011, announced by UNICEF Denmark)
Conflicts of interest
CONTENTS
ABBREVIATIONS
6Delimitations 7
1. INTRODUCTION
81.1 Structure of the paper 9
1.2 Purpose and aim of the thesis 9
1.2.1 Basic justification of problem and perspectives 9
1.3 Principal research questions 11
2. BACKGROUND
122.1 Objective health and welfare indicators 14
2.1.2 Semi conclusion 15
2.1.3 Relevance of empiric evidence to four research questions 16
2.2 Literature on economic variables and welfare 17
2.2.1 Relevance of empiric evidence to study populations 20 2.2.2 Relevance of empiric evidence in relation to research questions (d) 20 2.3 The context and background on populations of study 21
3. RESEARCH APPROACH AND METHODOLOGY
243. 1 Methodological considerations 25
3.2 Bias in descriptive study type 26
3.3 Sources of uncertainty and methodological differences 28 3.3.1 Methodological differences in the Bank and UN-agencies 28
3.3.2 Semi conclusion 29
3.3.3 Methodological differences in the applied data bases of WHO 29 3.3.4 Methodological differences in used data bases, OECD 30
3.3.5 Semi conclusion 30
3.4 Data sources 31
3.5 Data collection 32
3.6 Data analysis approach 32
3.7 Why is this not an evaluative study of the ODA intervention or welfare state? 33
4. THEORIES
354.1 Theoretical considerations 36
5. CENTRAL CONCEPTS
385.1 Indirectly analysed concepts 38
5.1.1 Democracy 38
5.1.2 UN Resolution 2625(XXV), ODA, UN Resolution 55/2, and MDG 38
5.1.3 Development discourse 39
5.2 Directly analysed 41
5.2.1 Demographic variables 41
5.2.2 Welfare indicators 42
5.2.3 Child-welfare indicators 42
5.2.4 Access to welfare services (immunization) indicators 43
Part II
6. PRESENTATION OF RESEARCH
467. PRESENTATION OF RESULTS
477.1 Basic health and welfare indicators for the year 2000 to 2008 47 7.1.1 Data analysis of basic health and welfare indicators 49 7.1.2 Semi conclusion on basic health and welfare indicators 49 7. 2. Immunization related welfare indicators for years 2000 to 2009 50
7.2.1 Semi conclusion on immunization trends 51
7. 3 Education related welfare indicators for year 2000 to 2009 52 7.3.1 Data analysis of education related indicators 53
7.3.2 Semi conclusion on education trends 54
7.4 Expenditure on health from the year 2000 to 2009 54 7.5 Per capita expenditure on health increase from the year 2000 to 2009 55 7.5.1 General data discussion of HE in relation to LE, U5MR 56
8. DISCUSSION
588.1 Discussion of results in the light of Capabilities Approach 58 8.2 The importance of government’s investment in health 58 8.3 The importance of objective health and child-welfare indicators 61
8.4 The importance of education indicators 62
8.5 The importance of immunization indicators 63
9. ANALYSIS AND CONCLUSION
65LITERATURE
69Appendix 1 77
Appendix 2 93
Endnotes 95
List of table and figures:
Figure 1.2.1 11 Table 2.3 23 Figure 7.1 48 Figure 8.1 59 Figure 8.2 60 Figure 8.3 64 Figure 8.4 64
ABBREVIATIONS
AIDS Acquired immune deficiency syndrome BCG Baccille Calmette Guérin vaccine CPRC Chronic Poverty Research Centre CRS Creditor Reporting System
DAC Development Assistance Committee DALE disability adjusted life expectancy DHS Demographic and Health Surveys
DTP3 three doses of diphtheria, tetanus toxoid and pertussis vaccine GER gross enrolment rate
GR growth rate
GDP Gross domestic product
GGHE General government expenditure on health
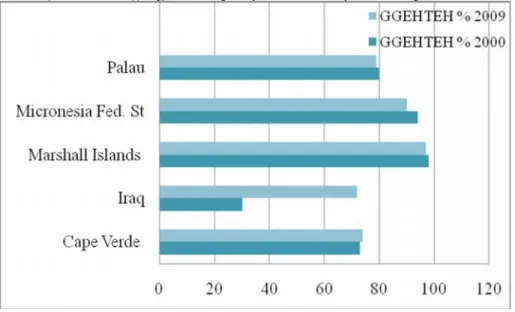
GGHETEH General government expenditure on health as a percentage of total expenditure on health
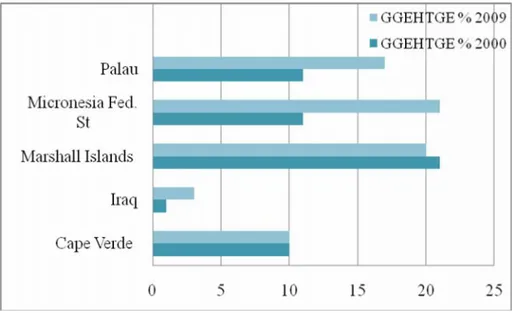
GGHETGE General government expenditure on health as a percentage of total government expenditure
GNI Gross national income GNP Gross national product HDI Human Development Index HepB3 three doses of hepatitis B vaccine
Hib3 three doses of Haemophilus influenzae type B vaccine HIV Human immunodeficiency virus
IBRD International Bank for Reconstruction and Development IGME Inter-agency Group for Child Mortality Estimation IMR infant mortality rate
LE life expectancy
MCV measles-containing vaccine MDG Millennium Development Goal MICS Multiple Indicator Cluster Surveys MMR maternal mortality rate
NGO Non-governmental organization ODA Official development assistance
OECD Organisation for Economic Co-operation and Development Pol3 three doses of polio vaccine
PPP Purchasing power parity
TB tuberculosis
TEHGDP total expenditure on health as a percentage of gross domestic product TFR total fertility rate
THE total expenditure on health
UN United Nations
UNAIDS Joint United Nations Programme on HIV/AIDS U5MR under-five mortality rate
UNDP United Nations Development Programme
UNESCO United Nations Educational, Scientific and Cultural Organization UNICEF United Nations Children’s Fund
USD United States dollar
Delimitations
The initial master thesis proposal, had a qualitative methodological approach (on youth and their dental care habits), which was abandoned for the sake of a more broad methodological study, including data analysis according to the epidemiological study type. Thus the new focus is put on objective health and welfare in five de facto populations, who are comparable in that they live in democracies and have endured poor health and welfare ex-ante the period of this study, and finally, are among top recipient of the ODA in the years of this study, (but the nature of democratic regime wasn’t analysed in detail). This approach enables a descrip-tive study type, on health and welfare, based on descripdescrip-tive statistics. All these considerations influenced the study, and they are explained below. In addition, the paper will show that both the selected methodology and theory frame the study, while the consulted data sources constrain the data analysis across time, but not otherwise.
Firstly, it wasn’t possible to analyse the descriptive data across time, due to different esti-mation methodologies applied by databases for each year and data incompleteness. On the other hand, the theoretical background to the subject calls for the study of the phenomena within and between selected populations, in spite of non-random selection, again due to the data incompleteness. Thirdly, the data in analysis is quantitative, which frames and restricts the research of phenomena’s complexity. Neither did the available data allow to assess the internal inequalities in populations, nor rural versus urban, but male to female difference was accounted for some indicators (e. g., LE, U5MR, GER).
However, different approach could have been chosen to introduce and to demonstrate the relevance of this research. Indeed, the paper attempts to ensure this, in that it proposes two sociological theories that help to identify the variables. But the theoretical fundament of the study, consequently represents a delimitation, in that it also excludes other relevant aspects of the studied phenomena. Finally, the theories also influences the approach to data analysis and discussion, because they are conducted according to the criteria dictated by these theories. Thus, included theories were selected, on the best knowledge available to the author at the time, in a relation to their ability to add a more comprehensive approach to describe the phe-nomena. Finally, this paper doesn’t claim any expertise in the five populations.
1. INTRODUCTION
Because health and welfare in populations may change more rapidly than the field of Socio-logy can follow, the sociological researcher may find himself incapable to analyse these dynamics in their acute phase. Nevertheless, even in such situation an immediate response –based on a well described research–may be required. But the researcher may not have the needed time to engage in a long-term research, in situations that call for an instant response. According to American Philosopher M. Nussbaum (2000), a continuous reflective approach may enable a more rapid reaction, in such acute situations. This entails the research that continuously; assembles, analyses and reflects on the information from the past, and thus enables to propose relevant interventions for an instantaneous dilemma. Herein lays the significance of sociological research conducted in a retrospective design. Hence, the study is conducted in this spirit, (and is thus preceding an action-oriented research). Naturally, the primary ambition of this study is to describe the dynamics of health and welfare.
Firstly, two sociological theories constitute the primary theoretical background here. These argue for importance of capabilities and government’s role to support objective health and welfare in all groups of populations (Esping-Andersen, 1999; Nussbaum, 2000). The theories provide a more nuanced view, in that they also help to identify relevant indicators for study. This paper also investigates the third argument, namely the role of economics, in that the study also includes the data on the government expenditures on health and welfare.
Secondly, two recent UN Resolutions also supports the focus in this study. While the inter-national legislative background to protect health and welfare erga omnes human beings is old and unique, (since it is expressed in numerous UN resolutions besides the Universal Declara-tion of Human Rights (1948), and equally taken into consideraDeclara-tion that the compa-rable jus cogens towards protection of health and welfare of other life forms is non-existent), this paper identifies two UN Resolutions that directly accentuate health and welfare in populations – Resolution 2625(XXV), (1970) and Resolution 55/2 (2000). These are also consulted in order to strengthen the focus. Still, it isn’t given that all populations may be enjoying all-protection at all time in the spirit of these two Resolutions, due to their recommendatory non-binding nature. This paper shall explore why this is a problem, and describe and discuss how it affects the health and welfare in populations.
1.1 Structure of the paper
The introductory chapter opens the paper qua arguments for the relevance of the problem. Thereafter the thesis is divided in two. In part I, initiates a general discussion on welfare, and gives a presentation on relevant theories and research approaches to measure welfare (chap. 3 and 4), followed by a presentation of the most central concepts in the thesis in chapter 5, which holds the arguments for the selection criteria of the variables in this study. Obviously, the arguments presented here are based upon the selected theoretical background. Finally, part II holds a detailed description of conducted research and final product: data collection;
presentation, analysis, discussion, and conclusion. 1.2 Purpose and aim of the thesis
The overall objective of the study is to describe and analyse the dynamics and trends in health and welfare in selected five populations, from the year 2000 to 2009, and put them in relation to the two control groups of populations (whenever applicable).
This paper holds an instant study and exploration of the dynamics of objective health and welfare in five populations during the early 2000s. In order to do so empirically the epidemio-logical study type namely descriptive study is followed, which enables analysis of variables on health and welfare: the objective health and welfare indicators.1(While data discussion
holds its support in proposed sociological literature (e. g., Esping-Andersen, Nussbaum). The period of study is from the year 2000 to 2009. A ten-year-period is sufficient because, “Past experience has proven it is possible to dramatically improve human development indicators at low cost over a ten to twenty year period.” (Boone, 1996, p. 322). Units of study: de facto populations in five countries that are concurrently emerging democracies and World’s top recipient of the per capita net official development assistance (ODA).2
1.2.1 Basic justification of problem and perspectives
The study is based on the contemporary, established consensus–within the social sciences and the bilateral organisations (e. g. OECD), and multilateral institutions (i. e., the UN, the Bank, et c.)–that an accumulating imbalance in welfare across and within populations requires a incessant universal action; because the contemporary globalization has made it impossible to relent to ignorance and carelessness towards suffering and poor health and welfare conditions of populations in any part of the world. American Medical Anthropologist, M.D., A.
Afghanistan are made over from national and regional disasters into transnational tragedies” (cited in Kleinman, Das, & Lock, p. xii), thus projecting the excess imbalance in health and welfare of any local populations across World (cf., Abrams & Gungwu, 2003), like water rings. This necessitates global consensus and approach to solution:
We have seen that many people around the world are healthier, wealthier and more educated than ever before. But progress over the past 40 years has been uneven, with people in some countries and regions experiencing far slower advances, and, in a few
places, deteriorations.4 (United Nations Development Programme [UNDP] & [RBAS], 2010,
p. 45)
This situation is explained more precisely by A. Alesina and B. Weder (2002), who rely on the data from the Bank to coin the following statement, and accentuating the role of income: The differences in well-being across the world are staggering: income per capita in the United States is 60 times larger than in Ethiopia and about 50 times larger than in Mali.[1] Not surprisingly, there is a demand for transfers of income from rich to poor countries. (p. 126)
(Disregarding that authors here link well-being to wealth), the form of transfers they refer to are specified in UN Resolution 2625(XXV). Qua the Resolution the member countries of the Secretariat of Development Assistance Committee (DAC)–in the Organisation for Economic Co-operation and Development (OECD)–commit to the annual ODA outflow of 0,7%/GNI to defined (non-DAC-member) recipient countries. The DAC-member countries administer the ODA outflow to meet the Resolution’s key pledges, which is, “the objective of promoting economic development and welfare of developing countries”; (Organisation for Economic Co-operation and Development [OECD], 2009b, p. 48). And in the year 2000 the OECD-countries have obliged themselves to strengthen ODA intervention according to the proposed Millennium Development Goals (MDG),5 qua UN Resolution 55/2 (see Fig. 1.2.1). In this background, it is necessary to describe the dynamics of the objective health and welfare indicators, which in some cases correspond to the MDGs.
Thus the specific objective of the study is a multi-country analysis of the objective health and welfare indicators in populations in: Cape Verde, Federal States of Micronesia, Iraq, Marshall Islands, and Palau. But this study isn’t evaluative nor is it a study of social inequ-ality. The acquired approach here is much more naïve, because the aim is to describe health and welfare dynamics by the help of descriptive statistics. The study is free of pre-judgements
about the studied object in the sense of a Husserlian phenomenological tradition, which neces-sitates immediate closeness to the studied phenomena. The acquired approach however, is an attempt to avoid potential bias in a qualitative study of welfare, which in addition may give results that aren’t immediately suitable for a comparative analysis.
_____________________
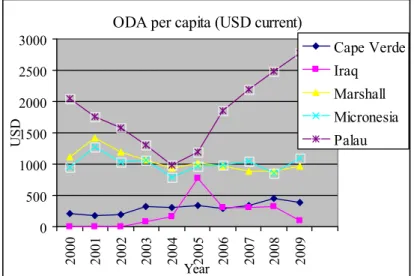
Figure 1.2.1 Net ODA per capita received (USD current), in populations of Cape Verde, Iraq, Marshall Islands, Federal States of Micronesia, and Palau, from the year 2000 to 2009.
ODA per capita (USD current)
0 500 1000 1500 2000 2500 3000 2000 2001 2002 2003 2004 Year2005 2006 2007 2008 2009 U SD Cape Verde Iraq Marshall Micronesia Palau
Source: Creditor Reporting System (CRS), obtained online 2010. 1.3 Principal research questions
The study has potentials to describe the short-term dynamics and trends of the objective health and welfare indicators. The study aims to,
(a) describe trends in the objective health and welfare indicators in the five populations, when compared to the two control groups of populations in the period from the year 2000 to 2009. (b) describe whether specific categories of the indicators changed more, in the studied populations, when compared to the two control groups of populations.
(c) discuss whether the dynamics of the objective welfare indicators in the five populations, are coincidental with welfare indicators on the expenditures on health.
(d) finally, explore and discuss the relevance of indicators in a relation to Esping-Andersen’s and Capabilities theory, and also the MDGs (i.e. acc. to UN Resolution 55/2 ).
2. BACKGROUND
This chapter holds a general discussion based on research in welfare, development and aid. The final section holds an ultra short background to welfare situation in the five populations.
Studies on welfare in populations aren’t underrepresented in sociological research, but sociological studies on objective health and welfare indicators in and on populations in new democratic countries are.6However this trend is converging. Furthermore, more studies put
focus on the relationship between the ODA inflow and welfare.
Danish Sociologist G. Esping-Andersen (1999) discussed how welfare or initially the principle of social policies7–that are irreplaceable fundaments to the welfare model per se–
were introduced and established as relevant components of the democratically governed state.8
This process (“modern social policy”=modern welfare state), is traceable to the earliest acknowledged examples of modern social policy, in the form of Bismarck’s social insurance laws that were introduced in the late nineteenth century Prussia. (Not that the late nineteenth century Prussia was a welfare state by that act, as it is understood today; since Bismarck’s ideology involved monarchy type of governance,9 as oppose to democracy,10). Nevertheless,
the Bismarck’s model of social state also included principles of social policies that ensured a range of social benefits for population, as oppose to the Rechtsstat (German: Rule of Law) that primary ensured the legal rights of citizens, Bismarck’s model additionally helped to ensure stability in the state (p. 247). Namely, the Prussian social insurance laws of the 1880s remain a good example of the first steps that–in parallel with the later transition to democratic governance–enabled the early twentieth century European countries to adapt the welfare model, in the decades following the two post-World War periods.
While the birth of welfare states themselves takes place with different progress in different European countries over next three decades, the establishment of the contemporary welfare model per se is traditionally dated back to either one of the two post-World War periods. Also, it is important to appreciate the socio-economic, historical and geographical contexts in which this process took place (p. 33). The explanation is to be found in the fact that the state chooses to become welfare state in a particular historical moment and engages in the construction of its key welfare qualities – that is welfare policies (what Esping-Andersen refers to by Polany’s concept of de-commodification, as cited on pp. 43-4) and transformation from ‘merely’ a state
into a welfare state, qua this the newly constructed welfare state becomes a ‘role model’ or, “an explicit redefinition of what the state is all about.” (p. 34):
As T. H. Marshall (1950) put it, this implied a recognition of citizen’s rights and a promise to bridge the division of class. We cannot separate the welfare state ideal from its historical context.
Roosevelt’s New Deal and Swedish social democracy’s ‘Peoples’ Home’ were parallel efforts to rewrite the relationship between citizen and state, an affirmation that welfare and capitalism need not be incompatible. Western nations became self-proclaimed welfare states in the post-war decades, perhaps to underline their social reformist enthusiasm, but certainly also because the Cold War rivalries necessitated a visible attention to equality, full
employment, and social welfare. (as cited in Esping-Andersen, p. 34).
This exemplifies two important factors for the establishment and progress of welfare state and its services (a) the role of the population, and (b) the demographic transition during the post-Second World War period.11 For an example, the Swedish example of demographic transition
can help to explain the background to the present Swedish Welfare Model (which rests on the three principles of (a) commitment to full employment, (b) centralized wage bargaining, and (c) the universalism (Earles, 2011)), and the Nordic model in general, (in that we remember how demographic transition evolved similarly in neighbour populations). K. Earles explains, “During the 1960s–70s, declining fertility rates as well as women’s increasing labour force participation rates, were both important factors in the development of Sweden’s public child-care system and the introduction of parental leave.” (p. 181), and the population’s demands forced government to provide welfare services, (e. g., the Swedish Act on Child Care in 1995, see pp. 182-3). Here it necessary not to underestimate that their introduction, was facilitated in the absence of other welfare opposing factors (like an internal or an extern political stress).
And although the founding of the contemporary welfare model is commonly dated to the early twentieth century Europe, today, its ideas and values are distributed trough the geogra-phical and political borders of Europe and beyond. (This trend has also lead to research that investigates the potential role of the ODA in an initial democratization, see below).
Finally, Esping-Andersen emphasises a win-win strategy, according to Rawlsian principle of justice, “We must also assume that the basic societal objective is to reconsolidate the ‘democratic class struggle’; to prevent the emergence of an ever-deepening abyss between the A-teams and B-teams of postindustrial society.” (1999, p. 168).
This is welfare theory in its condensed form. Then how to measure welfare based on this knowledge, and which indicators are relevant to describe and analyse welfare in a population?
Again studies on the phenomenon distinct between the subjective and objective welfare, and both present some difficulties in measuring, (for objective see e. g., Pacek & Radcliff, 2008, pp. 182-3). In that the focus here is on objective welfare, the text below summarises the first explanation of relevant indicators to this study. This presentation also largely outlines the selection criteria for included populations.
2.1 Objective health and welfare indicators
British Economist and Historian A. Maddison (2001) and American Economist C. Kenny (2006, 2005) refer to a vast literature on the subject. They both rely on the empiric evidence that welfare indicators improve (e. g. child mortality, life expectancy, school enrolment, in Kenny, 2006) and converge world-wide (Maddison, 2001). This trend became clearer by the late twentieth century, “Although there are some studies that suggest the reverse,[5] most analyses of the issue of relative growth in quality of life variables find evidence of conver-gence in their chosen measures.” (Kenny, 2005, p. 2). This process happened in a significant way in “developing” countries when compared to ”developed” (Maddison, 2001, p. 24).12
Although, the information on the living conditions and welfare in the past is valuable–if only to contextualise the studied population, since predisposal to illness and poor health can also be inherited and environmental factors can provoke a phenotype to be presented, (cf. Kristenson, Eriksen, Sluiter, Starke, & Ursin), 2004–this study doesn’t analyse the data pre-year 2000, that is before the introduction of UN Resolution 55/2. The proposed explanations to this observance came from a variety of methodological approaches and perspectives. And it is now established that the general determinants of health in combination with the context-bound health determinants do have an affect on the health and welfare indicators. Here the literature operates with three to four categories of general health determinants: age, gender and personal constitutional factors (i.e. the genotype).13
In addition to these, the literature identifies four categories of context-bound determinants of health (1) lifestyle (attitude, knowledge, behaviour; exercise, hygiene, avoiding smoking and alcohol, diet, maintaining a healthy weight and enough sleep, stress), (2) environment (psychical environment and physical environment water quality, neighbourhood), (3) poor socio-economical status (poverty, social deprivation, social exclusion), and (4) public inter-ventions and policies (governance type and institutions, legislation, social support and welfare benefits, access to healthcare services, education, sanitation, employment and housing, friendly urban landscapes, and others, see Wilkinson & Marmot, 2003; Whitehead, Dahlgren
& Gilson, 2001, p. 314. The later can also be categorised in social structures, cf., Williams, 2003).14Thus public policies (e. g., public health spending) may give higher outcome in
countries with a good governance,15 when compared to those without a good governance,
Rajkumara and Swaroop state, ”As the level of corruption falls or the quality of the bureau-cracy rises, public spending on health becomes more effective in lowering child mortality.” (2008, pp. 108-9). On the other hand, they conclude that public health spending at the margin may be relatively inefficient to improve outcomes even in many countries with a good gover-nance, but in their study they didn’t take private spending into calculation.
In stead, Easterlin (2000) argues for a more even allocation of resources and access to improved preventive methods, especially vaccination programmes being more significant to increase the objective welfare indicators (p. 15). These alternative associations between health and welfare indicators are more significant than their relationship with the income indicators. Subsequently, this study includes the data from both categories. (In spite of the suggested association between welfare indicators and higher physician and hospital bed ratio (Burnside & Dollar, 2000) this data isn’t included in this study, due to incompleteness.
Also child-welfare indicators16 are suitable in a descriptive study of welfare, (and they
might be used in an analysis as the primary indicators of changes in population particularly, “Since infant mortality indicators respond quickly to higher consumption and improved health services, infant mortality can be considered a flash indicator of improvements in economic conditions of the poor.” (Boone, 1996, p. 293). UNICEF confirms this view, “Child mortality is a sensitive indicator of a country’s development and telling evidence of its priorities and values.” (2007, p. vi). Finally, the literature points out premature death as the most de-reso-urcing factor for the society (Shkolnikov et al., 2004, p. 68).
School enrolment is another acknowledged non-income related welfare indicator both in empiric (Kenny, 2005), and sociological literature (Nussbaum, 2000, 2011), and therefore an useful variable in a quantitative research on objective welfare. ”Education is a basic condition for the […] progress of the country as well as for the development of a fuller cultural life and the sound growth of democratic institutions.” (The International Bank for Reconstruction and Development [IBRD], 1952, p. 62).
2.1.2 Semi conclusion
While the socio-demographical premises of welfare state may constantly be changing over time, it seems that literature agrees on the prerequisite core politico-demographical principles
as prerequisite to establish and maintain the welfare state. While Esping-Andersen points that the welfare state is primarily relevant for the government, it is also worth to note why Kenny (2005) emphasises technologies, and contests government’s part in the final welfare payoff: The extent of the role that governments have had to play in improving quality of life remains arguable. Literacy appears to be an important factor and government efforts to expand schooling must have played a role here. It seems plausible to argue that even though some government health expenditure is wasted, efforts to (for example) spread vaccines and improve primary care can have a significant payoff.
Whatever the role of government, literacy and vaccine programs surely helped only in combination with technologies that the skill of literacy or the vaccine programs helped to spread. These technologies, which appeared to have done little in increasing Third World income, have at least improved other measures of the quality of life. (2005, pp. 10-1) 2.1.3 Relevance of empiric evidence to four research questions
Thus the sociological researcher needs to incorporate several categories of welfare indicators, in order to study welfare in a population, versus the government’s role (health expenditure). The sociological literature agrees on the impact of health and poor health status to the phenomenon. It is central that welfare is interdependent with contextual health factors, and requires a multidisciplinary approach, in terms of evaluation and intervention (UNDP, 2009, p. 145). Here several health variables are applicable to describe and measure the objective welfare. But due to selected theory and data availability this study is restricted to includes five categories of objective welfare indicators (1) demographic variables, LE, TFR, (2) child-welfare U5MR, (3) access to child-welfare services (immunization coverage, and communicable diseases, e. g. prevalence TB, (4) education related welfare indicators, and (5) indicators on health expenditure. This approach can enable to reach new perspective and knowledge. Despite the comprehensive literature on general and context-bound factors that influence health indicators (Wilkinson & Marmot, 2003, pp. 10-12, 16-26), this study doesn’t include further categories, because of the above mentioned restrictions. In 2005 Kenny established low calorie intake to be a significant factor for IMR and LE in poor countries, the same study revealed further important empery.17Egyptian Sociologist A. El-Ghannam (2002) emphasised the positive role of demographic variables (e. g., small populations, low TFR and higher urbanisation) on the objective welfare indicators (p. 51). In 2002 El-Ghannam interprets the data in more developed countries according to the demographic transition theory, put by R. Freedman (1979).18And also in 2003 El-Ghannam finds a, “positive associations between
mortality rate, population per physician, and child malnutrition and mortality in the whole world regions.” (p. 1). Finally, in 2005 El-Ghannam also presented an association between a decreased TFR and an increased participation in labour force and more number of years of female life expectancy, among women in more developed countries. In a relation to child-welfare, Roggero (2007) presented evidence on significant and positive associations between child labour and health and child-welfare indicators.
Regretfully this study doesn’t include all these indicators, although above stated empiric evidence are acknowledged and inclusion of many more indicators would be relevant. But the background theories to focus on the five selected categories of indicators is clarified below. 2.2 Literature on economic variables and welfare
First of all, the literature proposes two central arguments to include the ODA in the welfare research. Both arguments are summarised below:
(a) until recently, most of the research on objective welfare has had a focus on the link between the objective welfare indicators and economic variables of a total population (e. g. household income; per capita real income; GDP; GNP, PPP; et c., cf. Deaton, 1981, p. 1; UNDP, 2010, p. 51; World Bank, 2005, p. 32). But such research is mostly suitable to assess the mean ‘economic development’.19 This is the approach in the Human Development Index (HDI), (Anand & Sen, 1994).
Hence, when the above mentioned variables are correlated to the non-income health and welfare indicators, it becomes clear that per capita GDP variables represent only a part of explanation, primarily because the GDP describes country’s overall economic output. Thus, Ranis, Stewart, and Samman (2006) criticised HDI method, and lately researchers doubt: whether economy wide income growth is instrumental in furthering health and education at low and medium levels of human development. And as we explore below, high rates of growth can coincide with environmental degradation and worsening income
distribution, which are grave concerns. (UNDP, 2010, p. 49)
In order to adjust for this bias the Bank adapted a new way to measure welfare in the 1980s: The distribution of the benefits of economic growth in developing countries is a subject which has received much attention since at least the early 1970’s. It is generally accepted that the success of any economic policy is in part measured by the extent to which it promotes equity. (Glewwe, 1985, p. 1)
This suggests the insufficiency to rely exclusively on the GDP and Gini indexes in a research on welfare (Engineer, Roy & Fink, 2010, p. 62). Recently French Economist F. Bourguignon and colleagues, conclude that the correlation between the GDP per capita growth and non-income welfare indicators (e. g. LE, U5MR) is practically non-existent (as cited in UNDP, 2010, pp. 47, 58).20 Thus, Olaskoaga-Larrauri, Aláez-Aller, and Díaz-de-Basurto (2010) call
for another type of measure, the so-called welfare effort – the social spending as a percentage of GDP (p. 114). This adjusted third type of measuring of welfare, resembles a second, in a sense that the distribution of spending is analysed. Authors point that even this method is inadequate to give insight in the distribution of welfare in a population (p. 115). Two other types of welfare measure are also based on the economics variables, however they both have serious drawbacks (ibid). Also the Chronic Poverty Research Centre (CPRC) warns on research that has exclusively foci on income-based measure of welfare (Anderson, 2009, pp. 3, 16), the same did Indian Economist A. Sen (1999). While Esping-Andersen expressed scepticism on aggregate measures of welfare spending as a valid indicator of state’s commitment to welfare, already in 1988:
Most of these studies claim to explain the welfare state. Yet their focus on spending may be irrelevant or, at best, misleading. Expenditures are epiphenomenal to the theoretical substance of welfare states...by scoring welfare states on spending, we assume that all spending counts equally. (as cited in Pacek & Radcliff, 2008, p. 182)
Hence a new method was developed to measure welfare, namely the ‘growth-incidence curve’ (Anderson, 2009, p. 5). Its relevance is worth investigating for succeeding studies.
Then how to conduct a research on welfare that isn’t based on the GDP-variable, if it is simultaneously recognised that the government’s expenditure on health is linked to health and welfare indicators? Hence this calls for investigation of the relevance of a second economic indicator in research on welfare, namely the ODA.
However, in 1996 Boone suggests and opposes this link in a regression analysis on infant mortality and aid/GNP ratios in Chile and Costa Rica:
These two countries are famous for their directed health programs aimed at improving infant mortality and general health indexes. 28 The World Bank (1993) estimates similar programs would cost 3.1% of GNP in low income countries. The lack of correlation between aid and health indicators shows that foreign aid does not introduce incentives into recipient countries to improve human development indicators. It also shows that financing is not the main constraint barring countries from improving human development indicators. (pp. 318-9)
Therefore the purpose of this study is neither to adapt the above discussed approaches in research, nor to attempt to establish the association between the ODA and welfare. Rather the focus is primarily on the objective welfare indicators, per se, and to frame these by proposed sociological theories and UN resolutions, which constitute unavoidably the background to the ODA intervention and MDGs. This two sided approach should eventually help to contextua-lise the data analysis and discussion and bring a new perspective to the problem.
Thus the non-consumption approach to welfare is central for this study, which in this way allows inclusion of several indicators, appose to the HDI-index. Since the ODA aims to develop and distribute welfare in the target population, the need to include the ODA, rather than the GDP or HDI, is more relevant, if only as one of selection criteria.
(b) The second reason to include the ODA variable, is a clear trend of its increase, during the 2000s (UNDP, 2005, p. 75, cf. Fig. 1.2.1). This is a positive trend, after a decrease during the 1990s (OECD, 2009, p. 72). However, Piva and Dodd (2009) point that the research hasn’t yet fully analysed, whether the ODA inflow is sufficient to help countries to meet the short-term welfare goals, the MDGs, or even the Paris Declaration on Aid Effectiveness (p. 930). Nevertheless, the UNDP recognises the link between the ODA and the MDG (2005, pp. 90-1). Several studies indicate this trend, except Boone’s (1996), but supposedly Boone’s study didn’t allow for the ODA affecting the allocation of government spending (p. 317). By incorporating government expenditure on social sectors, more recent studies conclude this to be the transmission mechanism for the effect of the ODA on aggregate welfare (Mosley, Hudson & Verschoor, 2004, pp. F227, F236). (Studies which take these precautions find that the ODA did had weak role on e. g. infant mortality, which was more evident in low income countries, cf. Gomanee, Morrissey, Mosley & Verschoor, 2003, 2005, p. 363).
UNDP (2006) further points the necessity, ”For overcoming financing constraints, the dis-tribution of aid flows is important.” (p. 67). For countries that introduce new constitution and governance, it is reasonable to presume that social and welfare provision needs to be restored (cf. Dubois, 2003, p. 4), probably in a completely new way (a potential change in social and welfare provision may be partially examined by descriptive analysis of included variables on HE). Therefore the inclusion of the ODA in the study has a potential to bring fresh input to help us to understand the progress towards the MDGs in populations that receive relatively high ODA inflow per capita.
2.2.1 Relevance of empiric evidence to study populations
Recently, quantitative studies suggest recent improvements of welfare across and in popula-tions (Kenny, 2005, 2006; Maddison, 2001). This is a paradigm change, after a trend of an uneven distribution, during the post-Second World War period, or so-called inequality in: economic growth, human capital, social capital, and political institutions.
Still, it is a paradox that current estimates indicate a record high total number of people living in extreme poverty (and thus in a risk to perceive constrained access to welfare)–that is, good one billion people, out of World’s total population of seven billion (FAO, 2010, p. 8)–in spite of World’s fifty years of experience with development industry (as cited in Edelman & Hagerud, 2005, p. 129), and the repeated proclamations of bilateral and multilateral agencies to eradicate extreme poverty. At the same time the international community is obliged and has dedicated itself to achieve the Goals in a global cooperation, separately from political and strategic interests.21 (Because no country can lift this task independently, cf. UNDP, 2005).22
But, on the growing importance of foreign political relations between states see the views put by French Anthropologist L. Atlani-Duault (2007b) for a post-Soviet case, “After 1991, for the first time in the history of East/West relations, international development aid was one of the principal vectors of massive change – change that is still under way.” (p. 590).23 But this observation may seem surprising and contradictory to the stated aims in UN Resolution 2625(XXV) on the principle of sovereign equality.24
Furthermore, Boone didn’t either found that the impact of the ODA would vary in liberal, democratic or highly repressive regimes (1996, pp. 289, 319). Finally, Knack’s multivariate analysis (2004), on the role of the ODA in a relation to the strategic objectives, gave no evidence that aid promotes democracy. Another paradox is expressed earlier in this paper, regarding the lack of–or at best, an unclear–correlation between the needed ODA inflow and the actual ODA inflow in the recipient countries (see above). The above may justify the expectation of an improvement of some welfare and health indicators, but hardly all of them. 2.2.2 Relevance of empiric evidence in relation to research questions (d)
The above also adds to the relevance of research questions (d); to analyse a set of reliable descriptive data that may enable an examination on the progress towards the MDGs, if it is accepted that some of the MDGs depict many aspects of objective welfare indicators analysed in this study (along with the goals of the two UN Resolutions).
2.3 The context and background on populations of study
The welfare in the five studied populations was neglected, or at least most evidently during the 1970s and 1980s. This is concluded upon spectacularly poor health and welfare indicators for the same period (WHO Global Health Observatory Data Repository).25But as the five
populations made the transition to a democratically inspired governance in the late twentieth century (or the 2000s for Iraq), it seems that the welfare has been given a new chance in these five populations, (presupposed that the implemented new democratic constitution isn’t only formal, and that the governance in a combination with UN Resolutions, is properly admini-stered). Thus it is extremely important to analyse their welfare during the 2000s. This is also in the interest of the international community; qua the MDGs and high ODA inflow.
The paragraph below summarises historical background to the objective health and welfare indicators in populations in: Cape Verde, Federal States of Micronesia, Iraq, Marshall Islands, and Palau, while the situation on control groups of populations was mentioned throughout the paper (see above). It is relevant to mention that the selected five populations, have less years of continuous experience with democratic governance, in particular when compared to Nordic countries (Navarro et al., 2006 ), and for this reason their different socio-historical contexts make them hardly comparable to the Nordic populations, nor is it valid to expect comparable values in indicators between the five population. More comparable values could exist between the two control groups, although even such reference populations are too general, and only included for reasons of overview and contextualising.
Starting with Cape Verde, it enters into the European history when Portuguese navigators discover it around the year 1445 (Maddison, 2001, pp. 57-8). But Cape Verdeans live in the independent Republic of Cape Verde, since the year 1975. Its democratic governance is a mixed system with both President and Prime Minister, with 72 seats (population seats ratio is 5 847), ”In Cape Verde the entire 72-person legislature is popularly elected.” (Rich, 2008, p. 227), and government instability (defined as 0 coup attempts) is ”very low” (pp. 221-2): Cape Verde was Portugal’s first colony to have schools of higher education, resulting in one-fourth of the population being literate at the time of independence. […] Since independence, Cape Verde has maintained more of commitment to education, with literacy rates reaching nearly 80% in recent years, […] Today Cape Verde is one of Africa’s most stable democracies. Even before democratization in 1991 the country was remarkably stable. Whereas contested elections in newly democratized countries can often lead to government instability, Cape Verde transitioned smoothly, even when the 2001 Presidential election was decided by only twelve votes. (p. 230)
Cape Verde is an Atlantic archipelago of ten islands (spread across an area of 4033 km², thus ranking World’s 165th), of which Santiago has its capital Praia. Population density per km² is 104,38 (ranking World’s 70th), (pp. 221-2). The 1980s and the 1990s were less prosperous period in terms of child-welfare. This can be concluded form higher U5MR and sustainable stunting, among children aged 0-5 years, remained above 20% during this period, which is spectacularly high, when compared to 0 % in established welfare states like Australia (cf. WHO data base). In the same period, ”over 600,000 Cape Verdeans were living abroad, more than the number living in the country (Carling, 2002).” (p. 228). According to T. Rich, Cape Verde is an island microstate (p. 217), and in general Rich explains that populations in microstates are:
Economically vulnerable, international aid traditionally has been crucial for most island microstates, partly explaining why many opted to remain under a colonial umbrella longer than other states. Poirine argues that the strategic importance of many island microstates justifies why they receive far more aid per capita than their continental counterparts (Poirine, 1999). International aid to microstates presumably can reduce domestic tension by increasing public services and diminishing inequality. Furthermore, dependence on international aid may persuade states to make reforms that encourage future aid packages. Similarly, foreign
investment allows for greater public goods and a higher per capita income, creating more economic opportunities than would otherwise be available. (p. 219)
And according to this Marshall Islands, Federal States of Micronesia, and Palau can also be categorised island microstates, nothing that:
What makes microstates different is the potential degree of instability. With little of an economic base and heavy reliance on foreign assistance, many island microstates have difficulty responding to popular demands and providing even basic government services. Furthermore disruptions in aid or what little exports they have can leave the governments of island microstates incapacitated. (p. 220)
Rich further explains how the above stated also applies to the population in Cape Verde (p. 223). Secondly, it is worth to be aware of the contribution of the Cape Verdean diasporas to remittances in their home country, finally, ”In Cape Verde remittances equal more than 20% of GDP (CIA World Factbook, 2007).” (p. 228).
In this study, Iraq is an exception, because it fits neither the criteria for an island nor a microstate, but its population fits the proposed study criteria, in that it belongs to the World’s top recipients of the ODA per capita during the 2000s, and has recently adapted democracy, which replaced the former governance that had left a foreign debts of USD 383 billion
(Abrams & Gungwu, 2003, p. 44). On the other hand, the export of country’s main good remains high during the 2000s. (Thus in 2001 Iraq was World’s 5th producer of crude
petro-leum with 116 700 000 t. p. a. In 2002 Iraq was World’s 6th producer, since its production fell
below its year-2001 production, and thus behind the Kuwaiti production, too, Hetherington et al., 2007, p. 54. The year-2001-production level was finally surpassed in 2008, Brown et al., 2011, p. 70).
_____________________
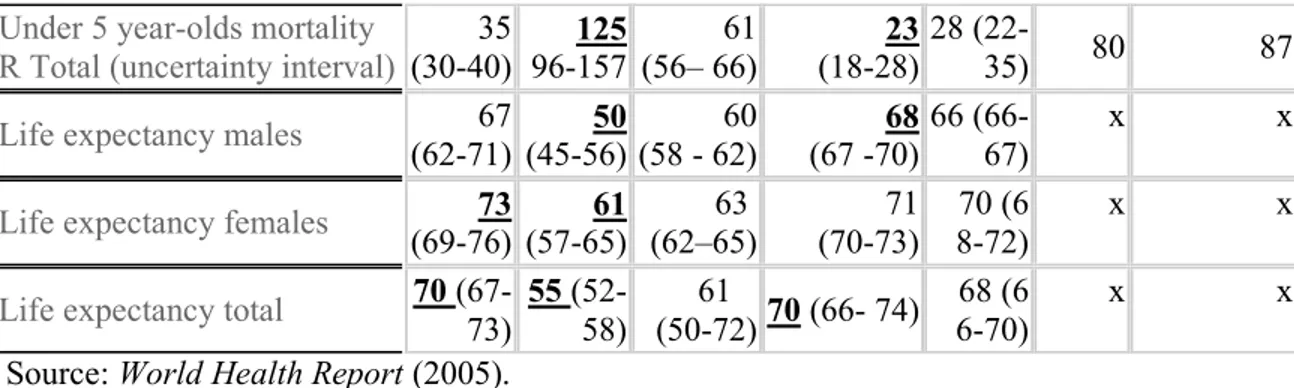
Table 2.3
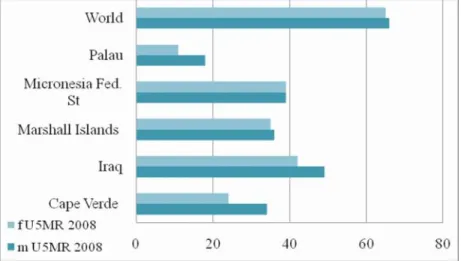
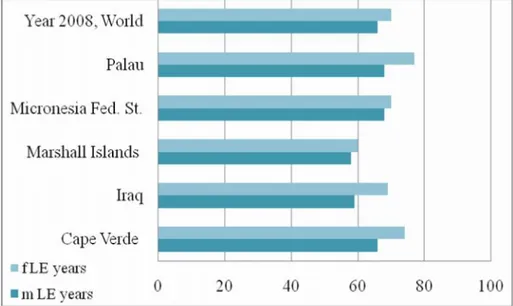
An overview in of the ODA per capita (USD current), estimated population, indicators on male and female U5MR and LE, in populations of Cape Verde, Iraq, Marshall Islands, Federal States of Micronesia and Palau, during the year 2008. (The lowest and highest values are underlined).
Country Cape Verde Iraq Marshall Is. Micronesia, Fed. St. Palau
ODA Population m U5MR f U5MR m LE f LE 445 499 000 34 24 66 74 322 30096000 49 42 59 69 891 61 000 36 35 58 60 853 110 000 39 39 68 70 2487 20 000 18 11 68 77 ______________
3. RESEARCH APPROACH AND METHODOLOGY
Again, the data obtained in this study is primarily based on quantitative methodologies, which were developed during the late nineteenth century by statisticians and dynamicists, and helped the sophistication of demographical and sociological research during the twentieth century (Berlivet, 2008; Bonah, 2003, Bowker & Star, 1999, pp. 110-1, 137; Beaglehole, Bonita, and Kjellström, 1993). Consequently, these methodologies represent the reiterate, strong empiric evidence for their efficiency to describe the objective welfare and health in populations. Ideally, the four pre-posed research questions should decide the selection and implemen-tation of methodological theory. The a priory selection of research methodology is strived to be avoided. And it was first after proposing research questions and experimental pilot-studies (supervised by Dr. Prof. N. Bonneuil) it became evident that the quantitative methodology was the most appropriate to answer the research questions. Hence, the final data analysis is conducted according to the principles that are described in the literature mentioned above.
It is requisite to select carefully among several epidemiological study types, according to such specific aims of the study, and other factors. The selected observational study design, namely a descriptive study is most relevant to this study, since it permits the collection of objective, relevant data via principles of the descriptive study type. A. Agresti and B. Finlay (1997) suggest that an optimal amount for small dataset consists of 5-10 explanatory variables anything above that number would difficult to untangle the complexity of relationship among variables (p. 528).
To conclude; the posed questions require a descriptive study that supports collection of secondary descriptive data and other relevant quantitative information that can help to answer the posed research questions.
Next step may be an ecological study that is primary useful to generate a hypothesis about populations (Beaglehole et al., 1993). Hypothesis generating requires testing and controlling, to exclude all the potential confounders, before a hypothesis can be proposed. This study with its posed focus and question however doesn’t invite to such study. Instead data on all five categories of indicators is compared between and within populations and between the two control groups, although for each year separately.
3. 1 Methodological considerations
To select one methodology over another, would impact the ability of the study to explore the complexity of studied phenomenon; for an example this study has exclusively focus on objective welfare, studied qua quantitative methods, whereas it may also include qualitative methodology to study the complexity of subjective welfare. Actually, the research on welfare does increasingly adapt qualitative methods (thus recognising these to be suitable to measure the complexity of the phenomenon). On the other hand it is crucial to explain specific criteria for reliability consistency and validity during the qualitative research process. Here reliability would be achieved when the relevance, transparency and adapted theory can promote similar result by repeating the study (these are the criteria for the objective of the reproducibility of data registration in another comparable context, cf. Riis, 2001, p. 89), as oppose to e. g. in a hermeneutic interpretation, where the researcher is a part of the process of interpretation and his understanding and knowledge horizon are continuously expanding, one can’t require the exact same result of another researcher. Reliability must be read in its relation to the concept of validity, which is also linked to the analytical process in qualitative research. Kvale (1996) explains that the analyzing process starts already during the first qualitative interview, or even during the transcription-process (chap.9). This qualitative research type would affect rese-archer’s understanding gradually, or promote his horizon expanding, (cf. Gadamer).
However this doesn’t imply that the quantitative methods are less relevant in the research on welfare. The empiric value of quantitative methods is still relevant, (presupposed that the criteria of validity and reliability are met adequately, see e. g., Yin, 1994; Beaglehole et al., 1993).
Indeed here it is recognized that both methods are equally suitable to explore key questions and produce new knowledge on the phenomena, at the same time it is necessary to keep awa-reness of drawbacks in both methodologies. Further, this study is open to the possibility of methodological triangulation (Stake, 2005), (if this turns out to be a relevant approach). In this case the study might extend to include a qualitative method – a qualitative-research interview. This method goes beyond descriptive methodology, and enables an immediate understanding, via its closeness to the object of research, as the hermeneutical and phenomenological inter-pretation traditions prerequisite (Husserl, 1893/1918[2009], 1927). Qua it the scholar explores the object, which even P. Bourdieu calls for:
The thought objects constructed by the social scientist in order to grasp this social reality have to be founded upon the thought objects constructed by the common-sense thinking of men, living their daily life within their social world. (1989, p. 15)
This methodological triangulation might support the study of phenomena’s subjective repre-sentations (e. g. subjective welfare), as well as its objective structures (objective welfare indicators), and in the end bring an understanding of the multi-dimensionality and the dialec-tical relationship of phenomena’s two moments, as Bourdieu proposed. But initially this study founds on quantitative methodology, because it is the most suitable to harvest the types of data that are necessary to inform the posed research questions.
Although a validation of descriptive data isn’t clear-cut, like it is in a qualitative research, (where the researcher can validate the collected data immediately, during the qualitative research-interview), on the other hand, a distanced researcher, in the quantitative research design, is preferred, because it can minimise the subjective interpretation bias, (Howell & Prevenier, 2001, pp. 146-8). Further, Pacek and Radcliff (2008) highlight improved validity in the research on objective welfare, because the researcher here relies on national averages as oppose to data on individual-level, which may produce imprecision bias (e. g., response error) and influence the researcher, thus increasing the risk of individual judgments, and ideally these bias will, “tend to balance out in large samples” (p. 181).
These are the primary considerations that were taken, prior the initiation of this research. Therefore the selected quantitative approach will at least eliminate these mayor biases. On the other hand it will carry other bias into the research process. This will be further elaborated in the text below.
3.2 Bias in descriptive study type
The high standard that is required in a quantitative research design, is meant to eliminate sys-tematic error and ensure the low bias. Although Beaglehole et alii (1993) identified over thirty different types of bias in epidemiological types of studies, the primary bias of concern for this descriptive type of study is the selection bias. While this is related to the population sizes in the databases used, it is also relevant to the five populations studied here. This bias can also be accounted for by the two control groups of populations. Finally this research isn’t a cohort study and this bias doesn’t present serious problem.
Measurement bias presupposes a correct and consequent use of definitions and classifications. In that all classifications are adapted from the databases and should correspond to the units of measurement, this bias is hereby minimized.
On the validity criteria in a quantitative research design, the literature explicitly empha-sises following criteria for the quality of research designs: validity and reliability (Yin, 1994),
and the degree of uncertainty of the data. Since this study relies on secondary data, previously conducted bias is out of any influence now. Therefore it is of most importance to be familiar with the research processes and backgrounds to this bias that can be traced to the complex methodology of the data production by respective agencies (e. g. UN, WHO and Bank). And researcher needs to understand any potential sources to bias in the data production, in order to account for this in the data interpretation, analysis and conclusions. This is accounted for by a methodological study of consulted databases.
The text below shall account for the statistical uncertainty of obtained statistical data. (These data uncertainties have been included in the tables in appendix 1, on e. g. LE and U5MR and are presented in brackets). There are several approaches to examine the degree of uncertainty. The most straight-forward manner is to consult the official databases themselves (in deed they are very open and transparent about their data estimation methodologies, et c.). Naturally, another approach is to consult the existing external literature that relates to this problem, (cf. Das, 2009; Robinson & Wharrad, 2000). The both approaches are used to examine this bias, and this is explained in the text below.
Finally, to evaluate epidemiological data and processes of data collection, several biases need to be taken into the account in a relation to this study, too, for an example confounding, (which is primarily related to correlative study types, unlike this study, Beaglehole et al., 1993, p. 46). Since, “It is not possible to study the entire population in which one is inte-rested.” (pp. 48-9), it is therefore necessary to rely on data samples of population that can support estimation (p. 58). For the possibility to account for how large part of the population was included in the data estimation method by WHO, it is possible to find this information in the applied databases (e. g., WHO literature, see below). Also it should be clarified that the WHO’s data estimates in this study refer to de facto populations and not de jure populations. Secondly, Beaglehole et alii point out the many techniques to ensure the general validity in the study, but those that are most relevant in the chosen design type, will be discussed more in the part data discussion (see below). But first of all it is necessary to explore the potential bias and uncertainties in the data sources applied in this study, the question of estimated values and estimation methods, but also it is a question of general approach to the research methodo-logy and collaboration between involved agencies.
The next sections shall account for potential bias in the data estimation methodologies of applied data sources and their data uncertainties. The text below holda a short description of the research process in general, to clarify how are the statistical databases of the UN-agencies,
the Bank, et cetera, constructed and updated. This is conducted by a qualitative analysis of primary and related literature that was published and publicly available for the studied period. Data were judged by their sources, reporting procedures, strengths and the degree of uncerta-inty. This approach helps to examine the validity and reliability of chosen data bases to this study in general, and the validity and reliability of the obtained data estimates in analysis and in relation to answer the posed questions.
3.3 Sources of uncertainty and methodological differences
Uncertainties arise in various stages of the research process. WHO classifies uncertainty into three broad categories (1) scenario uncertainty, (2) model uncertainty, and (3) parameter uncertainty, which is related to the specification of numerical values, and thus is relevant in this study, primarily due to the data estimation methods. The section below shall devote some attention to this major bias, and likewise to a second important aspect of parameter uncerta-inty, namely the degree of comparability (cf. Bowker & Star, 1999, p. 240). In order to be confident in the comparability of applied indicators, and their equivalencies across analysed populations, it is necessary to establish a consensus in the definition of indicators and measuring methods. This would ideally push away any local terminology and methods. But on the other hand, “Striving for comparability in a standardized language across settings conflicts with the need for visibility within local settings” (ibid). Therefore the requirements to the judgment of equivalence and comparability shall be explained in the section below as they have been defined by the consulted data bases.
3.3.1 Methodological differences in the Bank and UN-agencies
T. Das (2009) explains that the Bank collaborates with the relevant UN-agencies to sophisti-cate the research procedures that lead to the production of data estimates, “These processes include collaboration with other UN-agencies, such as the WHO and the Joint United Nations Programme on HIV and AIDS (UNAIDS), on knowledge production.” (210). Therefore Das proposes to analyse carefully the multilayered organisational and research procedures by which the Bank26 creates information, especially when publishing is dependant of financial
resources (p. 217), in order to ensure criteria of transparency and reliability.
Das additionally observed a similar hierarchy in the information disperse within the UN, too, (where the staff is responsible to coordinate information sharing and collaboration on specific issues, internally in the UN). Thus Robinson and Wharrad (2001) note that, “Caution
is required regarding the validity and reliability of the UN data sources used in these
analyses.” (p. 446). Authors point out that notably data estimates for the MMR-indicators in the UN database are predisposed to low reliability. Consequently, the MMR-indicators isn’t included in this study, although it is essential to child-welfare.
The Bank’s research team also compares the output of Bank publications with those from other agencies, which also accounts for the Bank’s use of WHO and UNAIDS arguments. Also these often rely on information produced by national household surveys, (e. g. DHS).27
Based on experience, familiarity with the HIV/AIDS literature and collaboration, the Bank focal points review where they lack to put an organisational stamp on UNAIDS. Das’s methodological inquiry reveals how the decision to publish is inconsistent (pp. 217-8). Das distinguishes between two categories of power (a) informational and (b) financial which mutually reinforce each other, “By identifying issues as social problems and representing them in specific ways through information dissemination, lending requirements and projects, the World Bank significantly influences country public debates and policymaking.” (pp. 209– 10). Here Das refers to Colombian Anthropologist A. Escobar’s arguments, “Development discourse has created an extremely efficient apparatus for producing knowledge about, and the exercise of power over, the Third World.” (as cited in Das, 2009, p. 210). Das’ approach to this discourse was in a relation to the close corroboration between the Bank and the UN-agencies. Finally, Das’s study indicates a gap in the scientific procedure and the practice of the Bank. Das can conclude that, ”This top-down process is crucial to justifying why Bank information is so similar over the years and across publications by different authors.” (p. 219). 3.3.2 Semi conclusion
The Bank and the UN compete for attention of the same audience of stakeholders: clients, researchers, decision-makers, NGOs, and others. Thus Das’ study calls for further research on the validity of such alliances and interdisciplinary collaborations, and finally Das questions whether such interdisciplinary collaboration has scientific purpose or power-related benefits.28
Recently, the Bank has even softened its policy and standpoint to qualitative studies (World Bank, 2005, p. 26), which strongly indicates the recognition of this approach.
3.3.3 Methodological differences in the applied data bases of WHO
In spite of the introduced problems above, many studies rely on data from the Bank and UN-agencies. So how do they explain their sources and methodology? This is analysed via a
review of World Health Reports. Their objective is to present data series, to be used in a decision-making. Since the year 2000, the Reports have repeatedly introduced new estimation methodologies (WHO, 2000, pp. 144-150). Reports state that estimates for, among other, populations of Iraq, should be read with caution, as these are derived from limited sources (mostly macro data that are publicly accessible). But even ratios for Japan have been esti-mated (WHO, 2003), and when no estimates could be made, then n/a (not applicable) is indicated, and sometimes, “Figures are computed by WHO to assure comparability; they are not necessarily the official statistics of Member States, which may use alternative methods.” (WHO, 2006, pp. 185-6). All additional biases in the WHO database that are directly relevant for this study are explained in detail in the recent World Health Report:
The ability to monitor progress towards the Millennium Development Goals (MDGs) depends primarily on data availability. There is a stark contrast between the data available about the under-five mortality rate, the indicator for MDG 4, and the maternal mortality ratio, against which MDG 5 is monitored….For monitoring, it is important to distinguish between corrected and predicted statistics.5,6 Corrected statistics use adjustments made for known biases and, if needed, are based on a systematic reconciliation of data from multiple sources using established, transparent methods. Predicted statistics use a set of assumptions about the association between other factors and the quantity of interest, such as maternal mortality, to fill gaps in the data over time (projecting into the present or future) or space (from one population with data to another with limited or no data). (2007, p. 10)
Further World Health Report highlights bias in predicted statistics due to incomplete data and deficient measurement strategies for certain statistics (ibid). All these information shall be taken into account in the data discussion section.
3.3.4 Methodological differences in used data bases, OECD
In regard to the statistics of the OECD, to which the question of monitoring process is central, they are more reliable due to their descriptive nature, namely the statistics in question describe economical values, and therefore are primarily described in absolute terms. The uncertainty that arises here is immediately negligible, and related to the successful reporting and whether the selected currency exchange rates affected real values.
3.3.5 Semi conclusion
The importance to question and investigate the production of knowledge is (hopefully) communicated above. To sum up, the production of knowledge, in this case, the descriptive data collection and analysis, is a complex procedure that holds many potential biases. It can