The Effect of Education on
Disposa-ble Income Distribution
Bachelor’s thesis within international economics Author: Joe Lahoud 881221-1558
Bachelor’s thesis within international economics Author: Joe Lahoud 881221-1558
Davor Bosnic 880429-7615 Tutor: Börje Johansson, Lina Bjerke,
Viroj Jienwatcharamongkhol
Date: 2012-01-26
Abstract
The purpose of this thesis is to examine the education level and its role on income distribution in the member states of the European Union (EU). The data are assem-bled given the period between 2005 and 2009 with a cross-country data analysis. Knight & Sabot argue that high schooling level narrows income distribution, due to “wage compression”. Our analysis denotes that education is an important contributor to changes in income distribution. Higher educational levels usually refer to more equal distribution, and vice versa. Also, welfare regimes role on income distribution is an important factor.
The results indicate that higher education leads to narrower income distribution be-tween the rich and poor. It is significant without taking into account the socialdemo-cratic welfare regimes. This can be explained by the benefits received by the unem-ployed citizens, which increases the consumption of the quartile with lower average income level. Yet, education increases the income level of the poor and decreases the income level of the higher income quartile due to the availability of more specialized labor, the “wage compression” effect.
It is in exchanging the gifts of the earth that you
shall find abundance and be satisfied. Yet unless
the exchange is in love and kindly justice, it will
but lead some to greed and others to hunger.
Table of Contents
1
Introduction ... 1
2
Background ... 3
3
Theoretical Framework ... 5
3.1 Income Level ... 5 3.2 Income Distribution ... 6 3.3 Education ... 93.4 The effect of Education level on Income Distribution in EU ... 12
4 Method & Data ... 16
4.1 Theil Index ... 17
4.2 Measuring the hypothesis ... 19
4.3 Concluding the section ... 20
6
Results & Discussion ... 22
7
Conclusion ... 27
Figures/Graphs/Tables
Figure 2.1 Average income across the EU in 2009 ... 3
Figure 3.1 Income distribution across the EU in 2009 ... 7
Figure 3.2 Index of health and social factors relative to income inequality ... 8
Figure 3.3 Tertiary education across the EU in 2009 ... 11
Table 4.1 Descriptive Statistics ... 21
Tables 4.2.1 Descriptive Statistics for 2005 ... 23
Tables 4.2.2 Descriptive Statistics for 2009 ... 24
Table 4.3 Res: Dependent variable is income inequality TS (Theil)...24
Appendix
Hausman Test ... 331
Introduction
The purpose of this paper is to analyze the effect of education on income distribution across the member states of the European Union. A microeconomic approach is used to understand the relationship between both variables. Since the enlargement of the EU, the income distribution gap between the rich and poor countries has widened as the de-veloped countries in the EU are moving further ahead of the less dede-veloped. The intro-duction of the new member states ensured the inclusion of countries at different stages of development. Furthermore, the ability to move to different states within the EU, due to better opportunitites for higher living standard, may lastly decrease the income distri-bution across countries. Many may choose to migrate for higher earnings and improved education (Dauderstaedt 2010).
Policymakers mention education as a factor of decreasing income inequality, yet the re-lation between education and income distribution remains unclear. Previous studies mention the income distribution effect on education as a factor of growth (Farber S et.al 1989) and the wage differential based on education (Reilly 1991). Others have investi-gated the relationship between education and income inequality (Ram,1989). Yet the education level in different countries and its effect on national average disposable in-come and its distribution has not been discussed. We examine theories of the impact of education in income (Schultz 1961, 1963, 1975, 1981; Mincer 1958, 1974) in order to analyze the proposed hypothesis of the correlation between the education level and in-come distribution: how does the education level affect the average inin-come and its distri-bution between the EU member states?
The advancement in technology requires specialized labor adequate to adapt to the change in sectorial development, hence the importance of education. The sectors de-manding specialized laborers are increasing in proportion of the sectors that are not re-quiring specialization, as in service sector etc. High education leads to attractiveness within specific markets, depending on the degree achieved (Hummels et al. 2001). Compensations for educated citizens through higher wages than the non-educated are required to encourage others to fulfil their studies. People are willing to earn a costly degree due to promises of a better future. The productivity of the educated are assumed to be higher, hence the raised wage and decreasing income gap. It is understood that the
EU labour market is determined by the skills and qualifications of educated laborers (Schultz 1975).
Focus of this paper is on how the education level, included in human capital, affect the distribution of average disposable income across the EU. The assumption is that if edu-cation increases, “wage compression” occurs since more specialized laborers are availa-ble, hence increasing the wage of the ones with lower income, and decreasing the wage of the ones with higher income, leading to less income inequality (Knight & Sabot 1983).
The paper investigates these issues with a linear regression model which will offer the results necessary to understand the effect of education on the disposable income distri-bution. Cross- country panel data for all member countries of the EU is utilized between the period of 2005- 2009. The data required is provided by the official site of the Euro-pean Union statistical base Eurostat.
2
Background
In the events of further enlargement of the European Union, different economical, polit-ical and social problems came into the lights to ensure the equality of all. The expansion widened the gap between the rich and poor across Europe (Fahey et al. 2003). Figure 2.1 shows the average disposable income in all EU member countries. The average in-come to spend on goods and service for an EU citizen in 2009 is 14600 euro. The high average income EU states as Luxembourg enjoy approximately more than ten times the size of the average Romanian income as shown in the graph below. Furthermore, the as-sumptions of poor and rich differs between most countries, as the citizen beneath the poverty threshold in Sweden may be suited as above middle class in Bulgaria etc (Eurostat 2011)
Figure 2.1 Average income across the EU in 2009 (Eurostat 2011)
The level of educated citizens available in the regions could explain the increasing gap of income distribution. Human capital is understood as the availability of educated labor force, through education and experience in the working field. It is the attributes and knowledge possessed by laborers to enhance production of goods and services, and in-crease the economic value of the state or firm (Sullivan 2003).
While much of this research focuses on the relationship between the education level and income distribution, it is significant to mention the link between education and growth.
0 5,000 10,000 15,000 20,000 25,000 30,000 35,000 Average Income
The economic growth can be measured as the relative change of the value of all goods and services produced in a country. It is a source to higher income which enables the inhabitants to enjoy increased living standards and more freedom in consumption. Im-portant factors such as savings, population growth and human capital affect the perfor-mance of a country. Economic growth is strongly associated with education and train-ing, where the former is the essence of this paper. Higher education within the working field increases the level of income recieved. The distribution of income differs across the EU member states. The income gap in countries like Portugal and Greece is signifi-ciantly higher than in the higher average income states such as Sweden, Germany and Norway. In accordance with Schultz (1963), an increase in education level will narrow the gap of the income distribution, due to its effect on the different income receivers within the population. The rich will earn less due to “wage compression”, and the poor will enjoy higher wages, due to more specialization within their field of interest (Knight & Sabot 1983). The reasons and policy implications will be discussed further in the theoretical framework.
3 Theoretical framework
The theoretical framework in this paper covers education which is one of the main com-ponents of the human capital and its effect on the income distribution. The income dis-tribution and economic performance has become a key area of research in economics. The framework includes an extension of the correlation between the education and the income distribution across the EU. Considering the theoretical predictions about this re-lationship, the paper will look for empirical evidence based on cross-country data set. The spread of the income distribution is determined by the level and distribution of schooling, it can be reduced with higher education levels across the whole population. Economic growth increases with higher education level, which in turn decreases the gap of income (Schultz 1963).
3.1 Income Level
The income in this paper includes the sum of all taxable and tax free income minus tax-es and negative transferals. The affection of various variabltax-es on income distribution are discussed by multiple authors. There exist many theories on how income is affected, with regards to social, heritage, regional and cultural backgrounds. Income levels are of-ten determined by previous generations due to receival of heredity and contacts in the fields of work (Checchi 2000). Social status and economic wealth is descended from a generation to another. According to Cooper (1998), poor and wealthy families are stabi-lized within their social statue and level of income, as they are trapped at these levels for at least a generation. Families belonging to the average income earners are more af-fected by the fluctuations of the market, as some may earn more or less and belong eventually to another income community, depending on their achievements, in less than a generation. This is acknowledged in the paper, hence the significance of education on income distribution is the essence of it. Education is considered the main source for en-hanced productivity and “skills deepening” (Williamson 1991).
The average income level differs between the European Union members, shown in Fig-ure 2.1. Luxembourg has a much higher average income (31800) than Romania (around 2000 Euros). It is evident that the countries in Eastern Europe are at the bottom of the scale regarding income average, shown in Figure 2.1, mainly due to new inclusion with-in the EU. The average with-income of the rich with-in these member states may equal the average income of average earners in France, Germany, Great Britain etc. (Eurostat 2011).
The paper differs in the essence of explaining the role of education, with regards to Schultz model (1963), indicating that increased education level narrows income distri-bution. The “wage effect” by Knight and Sabot (1983) is crucial to understand why education changes the spread of income.
3.2 Income distribution
Income distribution indicates the allocation of earnings, from investments, salaries, sales etc. The income distribution is often misunderstood since there are different pers-pectives regarding it. From a humanitarian point of view, an unequal distribution may be suppressive within societies, since it causes social clashes. From an economical perspective, income distribution could affect different factors of growth positively, such as human capital, savings, investments etc. Income inequality is acknowledged as a re-warding mechanism, where the best fitted are allocated the toppaid jobs and suitable roles within society. It adds a supplementary motivation for the lessfortuned to reach another “social class” (Ray 1998 p.169-170).
Figure 3.1 shows the difference in income distribution between the richest 20% and the poorest 20% in 2009 with focus on the European Union member states. From the figure 3.1, one can acknowledge the income gap between the rich and poor within the EU countries. The richest 20 % in Latvia are more than 7 times richer than the poorest 20 %. Romania’s top class has 6.7 times more income than the bottom. The richest in Luxembourg, France, Germany, Cyprus have approximately 5 times more than the poor. The social-democratic regimes are more equal and enjoy around 3-4 times richer than the poorest 20 %. Sweden, Denmark and Finland may be more even due to free educa-tion system, free health care and other social benefits that increases the equality between the citizens, such as unemployment benefits for the lower average income quartile. Lat-via, Romania and other with high inequality between the rich and poor can be explained by the lack of social benefits such as free education system at the higher levels, e.g. uni-versity level.
Figure 3.1 – Income Distribution across the EU in 2009 (Eurostat 2011)
The unequal income has a negative effect on the civil society (Krueger 2002). This is an important factor explaining the exclusion of some with regards to education. The coun-tries with higher inequality have higher rates of homicides and other criminalities, along with lower life expectancy for the economic bottom. Countries with high GDP do not reflect the wellbeing of the mass, rather the high income received by the top shift. Por-tugal has the highest index of health and social problems, and also the highest stretch between the top 20% and the bottom 20% economically. UK has the second spot, fol-lowed by Greece, Italy, Ireland, France etc.
0.0 1.0 2.0 3.0 4.0 5.0 6.0 7.0 8.0 Income ratio
Figure 3.2 - Index of health and social factors relative to income inequality from The Spi-rit Level (Wilkinson 2009)
The health factor has an impact on income distribution as the healthier are more ade-quate for work (Wilkinson 2011). Also, the costs of medical care are also important to account for since high percentage of the income are flown into it. High income inequali-ty usually tends to hold back growth in poorer countries or developing ones, while boosting growth in the developed economies. This is due to social cohesion in the less fortuned societies, where the poor citizens do not have the potential of climbing up the economic ladder due to suppression or imprisonment. Some are required to actively par-ticipate in crimes to support their families etc. Higher unemployment rate is also an in-triguer of social injustice and increased inequality (Wilkinson 2009, Sen 1997). In de-veloped economies, as social-democratic regimes as in Sweden, these factors are not necessary since social benefits are promised and education may be free. In other words,
tunity is lacking, the people will remain suppressed and other ways to survive will be prioritized and the risks would be taken (Schultz 1981, Barro 1999).
3.3 Education
Human capital has been distinguished recently from the factor of labor, since it indicates the knowledge possessed by the labor force. It is acknowledged as the level of attributes, knowledge and competence such as intelligence of the labor force to enhance economic values, by increasing the level of production. The knowledge is a direct effect of education or experience within the working field. In some member states within the EU, there exist a labor-surplus market. This indicates that the amount of available hu-man capital exceeds the capital resources, referring to high unemployment level. Devel-oping the educational and health sectors could exploit this, since they require more hu-man capital than capital resources. Increased education improves the social structure, along with the level of knowledge within a population. It improves human development and the standards of production, by increasing the quality and quantity produced (Mah-bub 1996).
Education is the key component of human capital and the main source of general human capital, opposing job-specific human capital that includes experience and other compo-nents. The basic findings in Schultz’ work is that education investments lead to direct increase in human capital, hence an increase in productivity and economic growth. Ac-cording to Schultz (1981), experience is left out due to its difficulty in estimating the right parameters and data. Education contributes to easier accessibility to information, improvements in sanitation and health, investments in future generations and increased equality. It reduces poverty since more education offers better jobs, without accounting for racial, gender or social discrimination. It also increases the social statue of individu-als and their families. Sufficient level of education enhances entrepreneurial talent and specialization required in the field of labor. Yet be aware that education itself is not suf-ficient and the benefits of it do not appear immediately as self-motivation, experience, personality and other factors are taken into account. Often, changes are only seen in the generations to come, as more income is available for consumption and investments. The price effects of education play a major role in the distribution of education, as the lack of affordability is often the reason of being left out from the educational system (Schultz 1975).
Checchi (2000) explains education as the main source of upgrade within economical communities. By lowering tuition fees and offering financial benefits for students, the incentive to study increases, leading to lower income inequality. Quality of education is also an important factor for improved competitiveness. Education offers increased spe-cialization, preferences and choices within the preferred workfield. The possibility to work within the field of interest enhances productivity (Heshmati 2004).
Factors affecting the level of education negatively include:
Level of illiteracy due to work at early age or lack of affordability
Unequal regional coverage, some regions are alienated due to high migration, high criminality or located in rural areas
Low quality in the educational system
Insufficient funding of educational institutions or other public institutions that offer economical help for the less fortuned
Gender and racial inequalities
Arrow (1973) and Spence (1973) argue that the final degree received at university or upper secondary school matters more than the amount of years required for graduation. This is known as the sheepskin effect, higher income due to fulfilling your degree, and not for the time period. It remains unanswered whether time can justify the qualification of some, yet the efficient student may have an advantage over the less efficient in the labor market due to higher productivity in less time constraints (Weiss 1983). The as-sumption used in the model is that everyone with a degree is compatible for the same achievements, yet the ones who finished in shorter time are more skilled.
European standards on education, as the Bologna Process, compares the level of educa-tion applicable for different jobs. The agreement between the European states enhances the mobility of the labor force, competitiveness and appropriate matchmaking (Swedish Education ministry 2011). These comparisons do not properly take into account the quality of schooling or the type of education, rather the degree level on tertiary
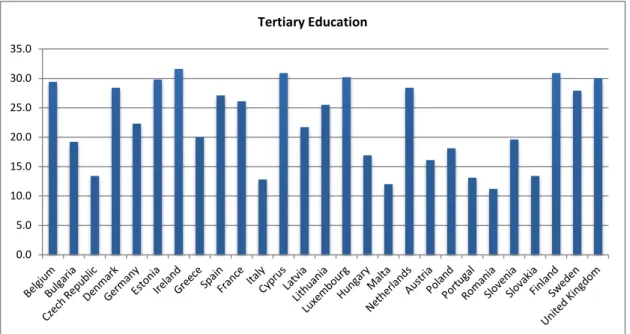
educa-Schultz defines education as a non-tradable life-long “stock” with no transportation costs. Education is costly and hence is acknowledged as an investment in you. This in-vestment should occur at early age to benefit from it for a longer period (Schultz 1981). Figure 3.3 shows the tertiary education attainment across the EU member states. The level of education is accounted in percentage, indicating the amount of the population with completed tertiary education. Rep. of Ireland has the highest education level with over 30 % followed by Finland, Luxembourg and U.K. Italy, Malta, Greece, Portugal are at the bottom. This could be due to the large share of the population leaving school at early age to work in the service sector, which does not require higher education level.
Figure 3.3 – Tertiary education across the EU in 2009 (Eurostat 2011)
The mobility of educated laborers, since the imposition of the European Union, has in-creased due to the possibility of receiving work permission easily between the member states. This has lead to an increase in the spread of income throughout the EU due to the willingness of educated citizens from the less developed countries to seek better futures for themselves and their families. The ability of education abroad, in a member state where the education level is higher and the fees are cheaper or for free along with a promising future, has the tendency to attract the less fortuned, yet willing student, to move to countries such as Sweden, Great Britain, and Germany etc.
0.0 5.0 10.0 15.0 20.0 25.0 30.0 35.0 Tertiary Education
3.4 The effect of education level on income distribution in EU
The spread of income distribution across the EU has increased the incitements to better education, as the main idea is that the better education you possess, the more likely you will receive better salary. The willingness to earn higher salaries and reach higher posi-tions within the market drives an individual to endure with the level of education. This is known as the wage effect. With a high level of the educated within a population, “wage compression” may occur due to increased supply of educated workers, hence de-creasing the salaries and benefits of high-educated workers (Knight & Sabot 1983). Ac-cording to the human capital theory, which emphasizes the role of schooling, the higher the education and experience of workers (the two major components of human capital), the higher the income received due to the assumed increased productivity. In order to invest more years in a higher education, it is critical to receive, once the working life starts, a compensation for the lost income throughout the years as a student. The satis-faction of possessing more knowledge after university does not cover for the lost in-come, hence the importance of a higher salary than for the non-educated (Mincer 1974). In the case where the level of salaries are similar between the educated and non-educated, or experienced and non-experienced, the incitements to invest more years into an education program decreases, since there exist no guarantees of compensation and hence the people would rather work immediately after high school. This shows that an unequal income distribution has a positive effect on human capital, and an equal income distribution may affect it negatively (Graham et al. 2002).
Is the gap of the income distribution healthy to enact human capital or does it affect it negatively? To offer an example suitable for human capital’s effect on income distribu-tion, it is not required to look further than the educational system in Sweden, where tu-tors earn low salaries in comparison with jobs with no educational requirements. Teach-ers usually study for at least four years to receive a degree which will offer them ap-proximately 25 500 crowns per month (17 850 after taxes). Many may argue that this salary is high, which is the case in many countries, yet in Sweden, an average worker
for students to leave their educations and instead invest, at early age, in the working field where they may earn money and experience, which is also considered a part of human capital. As a conclusion, the comparison of different incomes, for educated and non-educated, may be the difference between a positive or negative shift in human capi-tal development. The assumption is that the increased level of education has direct ef-fect on the income distribution, as more experienced and educated workers’ productivity are enhanced, which is reflected in the wage differences.
Income distribution is affected by the transferals of technology and educated laborers from the less developed states towards the leading economies of the world, and in the topic’s case, the European Union. The non-educated citizens are disfavored by the sys-tem in contrary to the highly educated (Tamura 1991). Education has two distinct ef-fects on the economic performance on regional and national levels, the first is the prod-uctivity of each employee, due to the level of knowledge. The second is the ability to adjust to new technologies and fast-moving industries due to experience (Mincer 1958). Education is indispensible to modern labor markets due to the increased requirements at work. These requirements are direct effects of modernized technologies and specializa-tion needs. Multiple studies conclude the fact that the higher educated are compensated more, shown in their wage level, their prominent social status and the level of employ-ment of the educated (Cohn & Addison 1997). Higher educational attainemploy-ment is reached by simplifying the access, through lowering tuition fees and public financing, also by raising the quality of tutors and books.
In the occurence of high human capital, which offers an incentive of increased unequal income distribution, part of the population may be excluded from the education system. This could be due to higher requirements to apply, or simply due to the lack of afforda-bility. It also depends on the national system of each member states, as Sweden has less spread in the income distribution due to the free educational system and higher taxes for high earners, while Great Britain has a higher spread due to the high fees for universities and lower taxes for high earners. Education is important in order to reduce the spread of different income levels in an economy in addition to its direct impact on labor produc-tivity (Schultz 1963, Becker 1964, Tilak 1989). Usually, the income distribution spread is higher in developing countries due to the large amount of poor citizens. Also, in de-veloping countries’ rural areas, where farms are still maintained by whole families, the
opportunity cost to send a child to earlier stages in school could be costly, even though the education at that level is usually free (Todaro & Smith 2009 p.394-396).
Some theorists argue that inequality is suitable for increasing incentives for citizens to innovate and invest. They mention the increase of income inequality as a direct effect of increased wage differentials based on jobs requiring education, and vice versa. The ca-pitalistic influence by these authors is about rewarding the educated and influencing the less fortuned to invest in a stable education. The problem lays in the affordability, in which solutions are lacked (Goldin & Katz 2007). Public spending on education may offer access to everyone, yet the problem lays in affording materials and attending school. Also, the income gap may widen since raised taxes will be imposed to fund the public education. The necessity of affording education for low-income families is priori-tized, as citizens should strive to invest in their own human capital. Public policies should emphasize this assumption, by promoting free educational system and design policies suitable for the poor as it is healthy for economic growth. Tax cuts and other benefits could raise the incentives of low-income takers in prioritizing such invest-ments. Also, the banking system should be remodelled, as the less fortuned are neg-lected the possibility of receiving credits, leading to no education affordability (Sylwe-ster 2000).
Highly developed countries as Sweden, UK and Germany necessitate a higher educa-tional level for most of its citizens, since their economies prioritize technological manu-factures and banking systems that need specialized laborers. Workers at corporations are usually highly educated in order to understand the underlying process required to im-prove the efficiency of production. On the other hand, education is less required in ser-vice concentrated sectors, such as touristic countries. In southern Europe, the level of education is low, shown in Greece, Spain, Portugal, Italy etc. due to the availability of jobs that does not prioritize education as in restaurants, hotels, bars and other touristic sectors. Yet the income distribution is more severe in these countries, since the educated gain much more than the non-educated. Take into account that the average income does
often less unequal to others, with emphasize on the word “often” and not always (Schultz 1981). According to Schultz, inequality in education widens the income distri-bution as the top earners enjoy bigger share of income and bottom earners will increase in proportion, yet their income share is smaller. On the other hand, increased level of education affects the two tails of the rich and poor, as the bottom earners will enjoy more disposable income, and the richer will have less due to decreased wage level as a direct cause of more competition (Schultz 1963).
The balance between “wage compression” and “wage composition” may explain the impact of education on income receival. “The composition effect” indicates that an in-crease in education level leads to higher income gap within the population due to im-proved productivity, hence the higher wage for the more effective employees. Yet with high education, “wage compression” may occur due to increased supply of educated workers, the premium of higher skills is less valued, hence decreasing the salaries and benefits of schooling. It also raises the salaries of the low-educated, which in turn nar-rows the income distribution. In other words, wage effect is determined by the supply and demand of laborers, hence the fluctuation of income distribution (Knight & Sabot 1983).
As a conclusion, income distribution is explained by the level of disposable income for the population of a state. Due to difficulties in measuring the whole population, the av-erage income of quintiles are taken into account and compared. Also, human capital’s main component is education since it develops and specializes laborers within their field of work. Schultz (1981) argues that the gap of income is narrowed by an increasing lev-el of education, since the poorer receive higher wages and the rich are victims of the “wage compression”. This assumption will be tested further in the empirical analysis section, with regards to the European Union.
4 Method & Data
This section investigates the theories presented in section two and three and their appli-cation in regression analysis. This offers the results necessary to understand the effect of the fluctuations of education on income distribution, with regards to the findings of Schultz. The model indicates that income distribution is narrowed down by increased education level. The paper will test the hypothesis by measuring the level of education and the average disposable income and its distribution. Cross-country data for the mem-ber countries of the EU are utilized in order to continue with further research between the period of 2005-2009. The dependent variable is stated as the income distribution, the main explanatory variable is the level of education of each country. The residual term will take into account all other components that affect the income level.
Income is denoted as the sum earned from wages, profit from private firms, social bene-fits and other income sources. Income distribution is explained by the gap between the richest and poorest, with regards to the different average income quintiles.
All member states are included within the years 2005-2009, regardless of their official entrance into the European Union. The paper provides the national differences of the member states with regards to the education level and income distribution. Bulgarian and Romanian average income in 2005 is lacking, also 2006 for the latter, hence the ex-clusion of Theil Index calculation for the mentioned countries that year. The combina-tion of cross-country data with time-series offers range of data suitable for explaining the hypothesis to be tested (Gujarati 2003). Due to data shortage of the richest income quintile, its average is calculated by substracting the average income multiplied by five, due to five income quintiles, with the summation of the four lowest quintiles.
Welfare regime reflects the amount of welfare offered to the public in order to enhance consumption and ease the costs of education. The multiple welfare regimes available within the EU are social-democracies (Sweden, Denmark etc.), liberal (UK, Ireland), conservatists (Belgium, France, Germany etc.), East-European (Post-communist) states (Slovenia, Slovakia, Poland etc.) and others belonging to the Mediterranean (Spain,
pected to include narrower income spread than other regimes since they offer benefits for the ones in need. These benefits differs from financial to educational benefits, such as unemployment monthly payments or free education. Also, conservative regimes have a tendency to offer benefits to its citizens (Esping-Andersen 1990).
The results of Schultz (1981) indicating that increased education level narrows the in-come distribution gap is empirically tested with a panel data regression analysis with least squares regression on all the member states of the EU between the years of 2005 and 2009. Eurostat provides us the data required for the empirical analysis section, as it is the official site of the European Union statistical base.
The utilized data of interest shows the percentage of the population enrolled in tertiary education (including university and non- university studies) in the education system in each country. This provides an indication of the number of persons expected to com-plete their studies, contribution to the increase of the education level. In the age of mid-20s, it is expected that most students have fulfilled at least a bachelor degree. This as-sumption is due to the willingness of students to make transitions between full time and part time studies and jobs before completing their education, at approximately age of 25. The reason of taking into account the tertiary education is due to the ability to spe-cialize within a field of interest. Nowadays, the tertiary education is needed in order to stand out in the competitive labor market.
The definition of income in this paper regards the disposable income, indicating the in-come available for consumers after taxes. The level of taxes may differ across the Euro-pean countries, as Sweden has a higher tax rate (30 % in average and maximum of 56.6 %) while other countries, such as Czech Republic, has an average income tax level of 15 %. Other taxes are induced as VAT, but this will not be taken into account since dis-posable income is the main focus. The level of taxes may also be deceiving since Swe-dish citizens enjoy more benefits from the welfare system than others, as the average Swede receives free health care, free education, social benefits for housing, unemploy-ment benefits etc, while other countries receive barely any benefits from taxation except of the infrastructure improvements etc (Eurostat 2011).
4.1 Theil Index
The usual measure for income distribution across regions is the Gini coefficient, which is estimated from the Lorenz Curve. Due to major criticism of the coefficient, since it often offers the same coefficient for two regions with different income distribution, an entropy measure is needed, in this case the Theil Index. Theil Index is a form of genera-lized entropy index that measures the spread of data, in this case, the income distribu-tion. The suitability of an entropy measure is due to its ability to decompose large quan-tities of data. Theil Index takes into account information theory and endures interpreta-tions of the income distribution; it measures the divergence from perfect income equali-ty within and across states (Theil 1967).
Since income distribution is difficult to perfectly measure it between the whole popula-tion, the statistics is limited instead calculated with the income quintiles, allowing the measure of the ratio between these extreme points. The measure of the skewness be-tween quintiles and two extreme points, the rich and poor, is the basic assignment of an entropy measure. This is why the Theil Index is preferred rather than the Gini coeffi-cient (Nelson 1984). The advantages of Theil Index is its ability to compare two differ-ent population sizes, since it only takes into account the proportion of rich and poor, the percentage size and not the actual amount. Also, the income distribution average of two countries may be compared, due to the importance of the total income within the coun-try, and not the individual income. The Theil Index ranks the income from rich to poor, rather than taking into account the earnings of each citizen, regardless of what citizens A or B earn (Theil 1967 p.91-134).
The formula used for competing the basic Theil Index is:
(1)
where xi is the income average of each quantile, is the average income of the whole population, N is the number of observations (Ullah 1998). The previous formula has a
The average of and are used to account for equal changes in all quintiles hence: (3) The Theil Index has the range between 0 and 1, with the former indicating perfect dis-tribution and 1 expressing perfect inequality. In other words, if individual i earns all in-come, then we reach complete inequality, and if all individuals have similar inin-come, perfect equality is established. If all individuals enjoy the same share of income, then everyone should share the same average, indicating 0 value for the distribution. If the income differs, then the bigger the deviation is from the average, the more will the dis-tribution fluctuate (Ullah 1998).
4.2 Measuring the hypothesis
This section presents the regression model, a description of how the cross- national data was collected and computed to measure the impact of the average disposable income. This paper takes into account different data measures, yet they all reach to the same re-sults, the effect of education on income distribution. Partial correlation is suitable for measuring the association between the dependent and independent variables. The bene-fits of partial correlation are its straightforwardness in calculating and explaining the re-sults from comparing data. Income distribution is used as the dependent variable and the main explanatory is education level. Education as the only explanatory variable is not sufficient, hence the inclusion of other factors that affects income level such as bad health status of the population, the unemployment rate and dummy variables consisting of different welfare-regimes. The following equation is for measuring income distribu-tion:
(4) Y is the income distribution with regards to the Theil Index, Edu is the education level with the total amount of educated citizens on an itinerary level divided by the total pop-ulation, Z is the vector of the explanatory variables affecting income distribution as un-employment rate, population share not able to work due to very bad health status and dummy variables such as the welfare-regimes, and μ is the error term indicating the unmeasured variables affecting income distribution.
In order to achieve the robustness of the outcomes, the paper uses different empirical specifications. The determinants of the income inequality are not sensitive to the model specification. The methodology includes variability both across nation and over time. Panel data are used in order to minimize problems of omitted variables and to reduce measurement error. The combination of cross-country data with time-series offers range of data suitable for explaining the hypothesis to be tested (Gujarati, 2003). We use the static model with random effects (REs) for our analysis. Running The Hausman´s (1978) chi- square test, we conclude that the REs model is more appropriate than the fixed effects (FEs) model due to its consistency. Further, the REs is more suitable be-cause there is no within- group in the dummy variables and they are omitted in the FEs model. We include a test (control) variable. Although it is possible to use several con-trol variables we limit ourselves to use only one at the time. Cross-country data is used for 27 member countries between the time periods of 2005-2009. Some data is absent since new member states lack the statistics due to different factors; no organization for statistical measures, late EU membership, state of war etc. Bulgaria 2005 and Romania 2005-2006 lack data for its average income, hence the exclusion of their Theil Index measure in that period. The cross-country data is organized in categories depending on each states welfare regime, as the assumption is that welfare benefits ease the costs of education and narrows income distribution. The unemployed still enjoys an income, and the rich may pay more taxes, depending on the taxing system in each state. Each coun-try belongs to only one regime, some countries are influenced by others, as the case in Sweden among others, where its essence is social-democratic, yet is subjected to liberal components (Esping-Andersen 1990).
4.3 Concluding the section
Table 4.1 - Descriptive Statistics
Variables Expected Sign Description Data Source
TS: Theil Index
Income inequality within a country, computed with Equ-ation 3 Author's calcu-lation based from Statistics of Eurostat da-tabase Education (-) Schultz 1963, Mincer 1975, Knight & Sa-bot 1983, Ti-lak 1989, Gre-gorio & Lee
Share of the total population with ter-tiary education at-tainment Eurostat Data-base Unemployment rate (+) Sen 1997
Share of the total population unem-ployed
Eurostat Data-base
Bad Health Status (+)
Wilkinson 2009
Share of the total population unabled to work due to bad health status Eurostat Data-base Social- D (-) Esping- An-derson 1990 Socio- democratic welfare regime, qua-litative variable Esping-Anderson 1990 Liberal (-) Esping- An-derson 1990
Liberal welfare re-gime, qualitative va-riable Esping-Anderson 1990 Conservative (-) Esping- An-derson 1990
Liberal welfare re-gime, qualitative va-riable Esping-Anderson 1990 East- European (-) Esping- An-derson 1990 East-European wel-fare regime, qualita-tive variable
Esping-Anderson
1990
How to measure the dependent variable: the dependent variable in this paper is the in-come distribution. The Theil Index measures it, by using the average inin-come level of earnings of the quintiles. Also, the average income of the total population is taken into account along with the number of observations.
How to measure the explanatory variable: the main independent variable is the level of education within a country. The data includes all citizens who completed education on
university level, and divided with the total amount of the population to receive a percen-tage form. Other variables are included in the explanatory variable with regards to its ef-fect on income distribution, as unemployment rate and bad health level. Dummy va-riables include the welfare-regimes.
The hypothesis to be tested is in accordance with Schultz model (1963), indicating that the income distribution gap is oftenly narrowed down by an increased education level. The data analyzed:
Compare the level of education across the member states
Compare the level of average income of the member states, and calculate the in-come distribution with regards to the average inin-come of the quintiles in each country by utilizing the Theil Index.
Compare all data and results with the hypothesis in order to find a string running through. Take into account political regimes such as social-democratic states (Sweden, Denmark, Finland), liberals (UK, Ireland), conservatives (France, Germany etc.), Meditteranean states (Portugal, Spain, Italy etc.), East-European (Post-Communist) states (Slovenia, Czech Republic etc.)
6 Results & Discussion
This section includes analysis of the paper, with emphasis on the hypothesis regarding the correlation between income distribution and the education level: does higher educa-tion level narrow down income distribueduca-tion?
By observing the countries with the lowest average income in graph 2.1, one can state that Romania, with an income mean above 2000 euro also has the lowest education lev-el with 11%. However, Lithuania has one of the lowest disposable income means in the EU (4800 euro), while the education attainment lies in the middle of the scale with 25%. One can acknowledge that the spread of income distribution is higher in less developed countries, such as Romania, Latvia and Lithuania.
By analyzing the graphs and appendix, there exists a relationship between the education level and the average income of the member states. The states enjoying higher education levels are obviously in the top of the average income scale. Italy, Portugal and Malta have the lowest education levels, while their respective average income levels lies around the average EU income.
Our empirical analysis exploits the panel data set for the 27 EU countries included over the period 2005-2009, using the REs estimation. The data set with mean, standard devi-ation and maximum and minimum value variables are shown in the table below for 2005 and 2009. It depicts that the income inequality for the whole population has de-creased slightly between the years.
Tables 4.2.1 Descriptive statistics for for year 2005
Theil Index TT Education Unemployment Bad Health Status
N Valid 25 27 27 25 Missing 4 2 2 4 Mean .052 .198 .082 .025 Median .046 .206 .079 .025 Std. Deviation .021 .066 .032 .015 Variance .000 .004 .001 .000 Minimum .024 .091 .044 .006 Maximum .098 .286 .178 .058
Table 4.2.2 Descriptive statistics for for year 2009
TS Education Unemployment Bad Health Status
N Valid 27 27 27 27 Missing 0 0 0 0 Mean .051 .224 .088 .022 Median .0495 .223 .079 .021 Std. Deviation .018 .070 .036 .011 Variance .000 .005 .001 .000 Minimum .024 .112 .037 .004 Maximum .093 .316 .180 .052
The REs model is robust as appeared by the same signs and significance when the model is computed with the Gini coefficient (Appendix). The control variable of education level is included to strengthen the trust effect of the independent variables. It is kept constant and strongly influences the other values. It is constant in order to test the relative impact of the
Table 4.3: REs: Dependent variable is income inequality TS (Theil) (1) (2) (3) (4) (5) (6) (7) (8) (9) (10) Education (-0.323) (0.013)*** (-0.317) (0.014)** (-0.264) (0.058)* (-3.610) (0.012)** (-0.176) (0.202) (-0.287) (0.038)** (-0.287) (0.072)* (-0.259) (0.068)* (0.240) (0.091)* (-3.436) (0.018)** Unempl. Rate (0.033) (0.454) (0.029) (0.523) (0.055) (0.224) (-0.029) (0.508) (-0.028) (-0.586) (-0.031) (0.491) (-0.029) (0.505) (0.030) (0.504) (-0.056) (0.221) Bad Health (0.061) (0.262) (0.091)* (0.093) (0.069) (0.195) (0.168) (0.075) (0.055) (0.313) (0.056) (0.306) (0.064) (0.236) (0.043)** (0.109) EDU_2 (0.020)** (0.575) (0.563) (0.023) Social-D (-0.486) (0.025)** (0.622) (0.012)** Liberal (0.098)* (0.454) (0.204) (0.476) Conservative (-0.185) (0.301) (-0.275) (0.170) East- European (0.056) (0.726) (-0.110) (-0.452) Residual (0.204) (0.248) Omitted R-Squared 0.228 0.37 0.377 0.384 0.339 0.358 0.378 0.385 0.324 0.3755 N 132 132 131 131 131 131 131 131 131 131
The welfare regimes are used as the qualitative explanatory variables, the hypothesis states that income inequality is effected by a country´s welfare policy. The paper uses five categories of welfare state: liberal, social- democratic, east- European/ Post com-munist, Conservative and residual. This classification assumes that a country belongs to one single welfare regime. This is not the case in reality, where for instance countries such as Sweden, Denmark and Finland are dominantly social democratic, however this does not imply that they are free from liberal elements. In regression 10, the omitted vari-able is the residual (meditteranean) welfare regime. The regressions in tvari-able 4-3 show that the social- democratic welfare regime is an important determinant of the income inequality. As expected, it shows that in social- democratic countries, income inequality is lower, such as the Scandinavian countries e.g Finland and Denmark. The results of the regressions show that the liberal regime is only significant at 10% level of significance and it is positively correlated with income inequality. Education is appeared insignificant when taken into ac-count social-democratic regimes, which can be explained by the benefits received for the uneducated, who are often employed by the manufacturing service or unemployed and re-ceived unemployment benefits. These factors increase the average level of the lower income quartile, hence decreasing income inequality. The qualitative variables of conservatives and eastern- Europe postcommunism show the expected signs, yet, they are insignificant in our estimation.
The main explanatory variable is the education level. Regression 1 shows that the relation-ship between the education level and the income inequality is negative and it is statistically significant. The higher the education level, the lower the income inequality within a coun-try. This behavior accepts the the earlier works of Knight and Sabot (1983) stating the bal-ance between wage “compression” and the composition effect. The estimate of the educa-tion level indicates that a 1% increase in this variable leads to 0.30% decrease in the income inequality. The earlier results of the main theorists included in the paper are accepted (Schultz 1963, Mincer 1964, Tilak 1989) stating that eduction promotes higher equality of income. The findings also indicate that the effect of education level is robust as it is not
sen-level; as in experience, connection etc. These factors cannot be justified by the years at school, hence the importance of proceeding with the working life as soon as possible. Other explanatory variables in the estimation are the unemployment rate and the bad health status. The short run impact of the unemployment rate on income inequality does not show the expected positive sign (in regressions 5-10) and it is not statistically significant in any of the regressions (3-10). This could be due to the short time period and the small amount of observations. The empirical results show that a highly bad health status of the individuals is associated with higher income inequality. The estimation has the expected positive sign and it is statistically significant indicating that if health status in a country worsens, the income inequality will increase. This can be explained due to less availability of laborers and no benefits offered for the ones in need. The results received from regression 10 indicate the significance of the education level, bad health status and the social- democratic welfare re-gime.
7 Conclusion
As a conclusion of our paper, which analyses the correlation between education level and income distribution, mainly by understanding the pattern of income distribution by increasing the educational level, we can confirm that higher level of the latter narrows down the former. Income distribution is affected by multiple levels, and it is required thousands and billions of variables in order to clearly answer our proposed answer. Fac-tors such as religions, cultures, individual ambitions and needs, social and gender equal-ity etc. are all variables that affect the income level. Yet our determination to understand the effect of education is due to our ambitions in life and to appreciate the education of-fered for us, which we do after understanding that education will increase our wage lev-el and offer us more opportunities within the working filev-eld. Wlev-elfare regimes play a role in the skewness of income distribution, it may help to narrow it or expand it, depending on the fiscal policies. Bad health affects inequality negatively, since the sick are not able to work, hence income is lacking, also welfare regimes’ policies may affect this.
How can we solve the injustices in this world and especially in Europe? This question cannot be solved in a matter of days, yet some suggestions will be offered. A higher sense of moral standards of the rich and the imposition of international laws by the right leaders to narrow the income distribution gap are required. Yet as long as sufficient re-sources are lacking, within the field of capital, especially human capital, we will not reach an equal society. Earth is abundant with resources and it is up to human beings to learn how to embrace it, hence the importance of developing the education level. With the money flouding into wars and other human evils and unnecessary consumption, we can afford the best equipments and schools to educate the citizens for whatever their ambitions might be, from the day of birth until death do us all apart!
Appendix
List of references
Adelman, M. and C. Morris (1973), “Economic Growth and Social Equity in Develop-ing Countries”.
Arrow, Kenneth J. (1973). “Higher Education as a Filter.” Journal of Public Economics 2 (July 1973): 193-216.
Barro, R. and Lee, J. (2001). “International Data on Educational Attainment: Updates and Implications”, Oxford Economic Papers 53(3), 541-63.
Becker, G. S. (1964). “Human Capital: A theoretical and Empirical Analasys with spe-cial Reference to Education.” Chicago: Chicago University Press.
Regeringen (2011). “Bologna Process”, Governmental official website: www.regeringen.se
Checchi, D. (2000). “Does Educational Achievement Help to Explain Income Inequali-ty?” Departmental Working Papers 2000-11, Department of Economics, University of Milan, Italy, revised Jan 2000.
Cohn, Elchanan and John T. Addison (1997). "The economic returns to lifelong learn-ing", Working paper B-97-04, Division of Research, University of South Carolina Col-lege of Business Administration.
Cooper, S. J. (1998). “Redistribution and the Persistence of Income Inequality,” John F. Kennedy School of Government, Harvard University.
Dauderstaedt, M (2010). “Europe’s Hidden Inequality”. Social Europe Journal. Esping-Andersen, G. (1990). “The Three Worlds of Welfare Capitalism”. Cambridge, Polity.
Eurostat New Cronos database (2011), “Population and Social Conditions”, Domain: Income and Living Conditions, European Official Website for statistics:
http://epp.eurostat.ec.europa.eu/portal/page/portal/statistics/themes.
Fahey T, Whelan C, Maitre B (2003). “First European Quality of Life Survey: Income inequalities and deprivation”, Economic and Social Research Centre, Dublin.
Appendix
Farber S. and Newman R. (1989). “Regional wage differentials and the spatial conver-gence of worker characteristic prices,” Review of Economics and Statistics 71, 224-31. Goldin. C, Katz. L. F, (2007). ”Long-Run Changes in the U.S. wage structure: Narrow-ing, WidenNarrow-ing, Polarizing”.
Graham B and Paul C (2002). “Does higher education really lead to higher employabili-ty and wages in the RMI”. US Census Bureau 2002.
Gujarati, D. N. (2003). Basic Econometrics. Boston, London, McGraw-Hill.
Heshmati, A. (2004). “Inequalities and their Measurement”, IZA Discussion Papers 1219, Institute for the Study of Labor.
Hummels, D Jun Ishii, Kei-Mu Yi (2001). “Journal of International Economics”, Vo-lume 54, Issue 1, June 2001, 75-96, Trade and Wages.
Khalil, Gibran. (1935). “The Prophet”, 49.
Knight, J.B. and R. H. Sabot (1983). “Educational Expansion and the Kuznets Effect,” American Economic Review, 73: 1132-1136.
Mahbub ul (1996). “Reflection on Human Development”. Delhi: Oxford University Press.
Mincer, Jacob (1958). “Investment in Human Capital and Personal Income Distribu-tion”, Journal of Political Economy, 66(4), 281-302.
Mincer, Jacob (1974). “Schooling, Experience and Earnings”, Columbia University Press: New York.
Mingat, A. and Tan, J. (1996). “The Full Social Returns To Education: Estimates Based On Countries' Economic Growth Performance”, Université de Bourgogne and The World Bank.
Nelson, J (1984). “Income inequality: the American states”. Social Science Quarterly Ram R. (1989). “Can educational expansion reduce income inequalities in
less-Appendix
Reilly B. (1991). “An analysis of local labour market wage differentials”, Regional Stu-dies 26, 257-64.
Rodríguez-Pose A and Vilalta-Bufí M (2005). “Education, migration, and job satisfac-tion: The regional returns of human capital in the EU”, Journal of Economic Geogra-phy, 5, 545-66.
Romer, Paul M. (1986). “Increasing Returns and Long- Run Growth”, Journal of Politi-cal Economy 94 (5):1002-1037.
Samuelson, P and Nordhaus, W (2004). ”Factors of production, Capital, Human Capital and Land”, Economics 18th edition.
Schultz, Theodore W. (1961). “Investment in Human Capital.” American Economic Review, 51(1): 1-1.
Schultz, T. W. (1963), “The Economic Value of Education”. New York: Columbia Uni-versity Press.
Schultz, Theodore. W. (1975). “Economics of the Family. Marriage, Children and Hu-man Capital.” Chicago and London: Chicago University Press.
Schultz, T.W. (1981). “Investing in People: the economics of population quality.” Berkeley, CA.: University of California Press.
Spence, Michael. (1973). “Job Market Signaling.” Quarterly Journal of Economics 87 (August 1973): 355-374.
Stanley, T.D. and Jarrell, S. B. (1989). Meta-Regression Analysis: A Quantitative Me-thod of Literature Surveys. Journal of Economic Surveys, 3: 54–67.
Statistiska Centralbyrån (2010). Official Statistics Website for Sweden: www.scb.se Sullivan, A. and Sheffrin, M. (2003). ”Economics: Principles in Action”, Upper Saddle River, New Jersey 07458: Pearson Prentice Hall.
Sylwester, Kevin (2000). “Income Inequality, Education Expenditures and Growth”, Journal of Development Economics, 63: 379–398.
Appendix
Tamura, Robert F. (1991). "From Decay to Growth: A Dynamic Equilibrium Model of Income Distribution." Working paper. Iowa City: Univ. Iowa.
Theil, H. (1967). “Economics and Information Theory”. Chicago: Rand McNally and Company.
Tilak, Jandhyala B. G. (1989). “Education and Its Relation to Economic Growth, Pover-ty and Income Distribution”: Past Evidence and Future Analysis. Washington: World Bank.
Todaro M, Smith S (2009). “Economic Development”. London: Pearson Education Inc. Ullah, Aman ; Giles, David E. A. (1998). “Handbook of Applied Economic Statistics”, CRC Press.
Weiss, Andrew (1983). “A Sorting-cum-Learning Model of Education.” Journal of Po-litical Economy 91 (June 1983): 420-442.
Wilkinson, Richard (2009). “The Spirit Level: Why More Equal Societies Almost Al-ways Do Better” (with K. Pickett), Allen Lane.
Williamson, J. G. (1991). “Inequality, Poverty, and History: the Kuznets Memorial Lec-tures of the Economic Growth Center”, Yale University. Oxford, Basil Blackwell.
Appendix
Appendix
Hausman Test Prob>chi2 = 0.4943 = 3.39 chi2(4) = (b-B)'[(V_b-V_B)^(-1)](b-B) Test: Ho: difference in coefficients not systematicB = inconsistent under Ha, efficient under Ho; obtained from xtreg b = consistent under Ho and Ha; obtained from xtreg edu2 .6210467 .5740315 .0470152 .0691043 logbad .0665567 .0934736 -.026917 .0242447 logunemp -.0666966 -.0549849 -.0117117 .0097199 logedu -3.998231 -3.605091 -.3931397 .4299205 fe re Difference S.E. (b) (B) (b-B) sqrt(diag(V_b-V_B)) Coefficients
Appendix GLS Random Effects
Dependent variable: Gini Coefficient
.
rho .90729395 (fraction of variance due to u_i)
sigma_e .10584215 sigma_u .33111482 _cons 11.55979 2.108807 5.48 0.000 7.426599 15.69297 residual (omitted) easteurope~t -.1069462 .1759668 -0.61 0.543 -.4518349 .2379424 liberals .2039712 .2862039 0.71 0.476 -.3569781 .7649204 conservati~s -.274455 .2002385 -1.37 0.170 -.6669152 .1180052 socialdemo~y -.6218582 .2486286 -2.50 0.012 -1.109161 -.1345551 edu2 .5630752 .2484578 2.27 0.023 .0761069 1.050044 logbad .1085202 .0560244 1.94 0.053 -.0012856 .218326 logunemp -.055719 .0455417 -1.22 0.221 -.1449792 .0335412 logedu -3.435616 1.448211 -2.37 0.018 -6.274058 -.5971737 logts Coef. Std. Err. z P>|z| [95% Conf. Interval]