Augusti 2020
Gaze detection in human-robot
interaction
Teknisk- naturvetenskaplig fakultet UTH-enheten Besöksadress: Ångströmlaboratoriet Lägerhyddsvägen 1 Hus 4, Plan 0 Postadress: Box 536 751 21 Uppsala Telefon: 018 – 471 30 03 Telefax: 018 – 471 30 00 Hemsida: http://www.teknat.uu.se/student
Gaze detection in human-robot interaction
Madelene Alanenpää
The aim of this thesis is to track gaze direction in a human-robot interaction scenario. The human-robot interaction consisted of a participant playing a geographic game with three important objects on which participants could focus: A tablet, a shared touchscreen, and a robot (called Furhat). During the game, the participant was equipped with eye-tracking glasses. These collected a first-person view video as well as annotations consisting of the participant's center of gaze. In this thesis, I aim to use this data to detect the three important objects described above from the first-person video stream and discriminate whether the gaze of the person fell on one of the objects of importance and for how long. To achieve this, I trained an accurate and fast state-of-the-art object detector called YOLOv4. To ascertain that this was the correct object detector, for this thesis, I compared YOLOv4 with its previous version, YOLOv3, in terms of accuracy and run time. YOLOv4 was trained with a data set of 337 images consisting of various pictures of tablets, television screens and the Furhat robot.
The trained program was used to extract the relevant objects for each frame of the eye-tracking video and a parser was used to discriminate whether the gaze of the participant fell on the relevant objects and for how long. The result is a system that could determine, with an accuracy of 90.03%, what object the participant is looking at and for how long the participant is looking at that object.
Ämnesgranskare: Ginevra Castellano Handledare: Maike Paetzel
I would like to express my sincere gratitude to my subject supervisor, Dr. Giulia Perugia, and my supervisor, PHD student Maike Paetzel, for their tremendous help during and after my thesis project. They have provided me with excellent advice regarding the implementation of the system, the writing of the report, and gave helpful explanations on any of my theoretical misunderstandings. Without their help, it is safe to say that this report would not even be half as good. Their hands-on approach to supervising meant that even during these difficult times, due to the Corona-virus pandemic, I was given excellent and steadfast aid and none of my questions were ever left unanswered. I am truly grateful to both of them for helping me with this project.
1 Introduction 5
1.1 Purpose and Goals . . . 6
1.2 Outline . . . 7
2 Background 8 2.1 Deep learning vs. Traditional computer vision for object detection . . . . 8
2.2 Choosing the appropriate deep learning model . . . 13
3 Data and requirements 17 3.1 The data sets . . . 17
3.1.1 The gaze data set . . . 17
3.1.2 The object detection data set . . . 18
3.2 Annotation guidelines and requirements . . . 19
4 Implementation 23 4.1 Implementation of the object detection (Task 1) . . . 24
4.2 Implementation of the parser (Task 2 and Task 3) . . . 26
4.3 Problems during the development and their solutions . . . 29
4.3.1 Slow implementation . . . 29
4.3.2 Installing required technologies . . . 30
4.3.3 Using a proper data set . . . 30
4.3.4 Usage of accuracy in the program when deciding which object is detected . . . 30
4.3.5 Scale-invariance . . . 31
5 Result 34 5.1 Deciding between using YOLOv3 or YOLOv4 . . . 34
5.2 Accuracy testing for the system . . . 37
5.3 Difference in performance in the object detector due to an increase in training data . . . 41
6 Discussion 43 6.1 Discussion of results . . . 43
6.2 Sources of error and yet to be implemented solutions . . . 43
6.2.1 Flickering . . . 43
6.2.2 Removal of frames from gaze position data . . . 44
6.2.3 Allowance . . . 44
6.2.4 Accuracy in the gaze detection . . . 45
7 Conclusion 46
1 Introduction
One of the main objectives in human-robot-interaction is to build autonomous agents that can keep people engaged in a joint task.
One example of such a task is the RDG-Map game [1]. The map game is a cooperative game between a human and a robotic player where the goal is to get the robot to accurately guess the correct countries shown on a world map. In the game, the human player is given the role of the teacher and the robot the role of the student. To score points in the game, the player is supposed to help the robot find countries on the map by describing them verbally. The set-up of the game consists of three elements: a tablet, a robot, and a touchscreen. The tablet is positioned on the right of the participant and is only visible to the human player. It is used to show the current target country and has a button to request the next target. The robot is positioned on a table, in front of the participant at eye-level. The shared touchscreen is resting horizontally on the same table as the robot and is positioned between the participant and the robot. It is used to show the robot’s selection, the remaining game time and the points scored. If the guess is correct, the player can move on to the next target which increases the score. The goal of the human-robot team in the game is to guess as many countries as possible in a given time of ten minutes.
In order to build an autonomous agent that can keep people engaged in the game, it is necessary to know whether the human player is currently engaged and tracking attention is only one part of tracking engagement. Gaze is a crucial behavioral cue signaling attention and it can ultimately be used as one factor to estimate engagement. As the tablet, the touchscreen, and the robot are the main components of the RDG-Map game, I am interested in understanding whether a participant is gazing at them during the interaction. Knowing whether the participant is looking at one of these target objects is an important factor to determine if the participant is paying attention to the game or not. In the future, the robot could use this information to provide an accurate response and keep the participant engaged in the game.
By using a wearable eye-tracking device, one can collect the data necessary to measure where the gaze of the human player falls. Researchers at Uppsala Social Robotics lab have gathered a data set of 139 interaction sessions of participants playing the RDG-game with the robot while wearing the Tobii eye-tracking glasses [2]. The study provided videos seen from the participant’s point of view as well as annotations consisting of the x,y coordinates of their center of gaze. As such, the missing link to make sense of the data is to understand what object the participant was focused on. To be able to determine the objects whereabouts in the first-person eye-tracking data, I used computer vision.
The main purpose of computer vision is to obtain information from an image [3]. Object detection is not an easy undertaking for a computer, as seeing and recognizing objects are
not intrinsic behaviours. A person can count the amount of trees in a picture, but give the same task to a computer and it will not understand what a tree is. Thus, one has to teach a computer how to "see". The recent decade has seen a large distribution of new computer vision technologies: Mobile phones with face detection, the Microsoft Kinect with real-time tracking of the human body, pedestrian tracking with hundreds of people, among others. The swift development of new technologies derives from the increase of storage capacity, memory, and processing power in computers. Another reason for the recent success of this area is due to the increased use of machine learning. Machine learning has become more popular in recent years, both in research and in industry, and has seen several domains of application such as image classification, video recommendation and text mining [4]. In particular, a subset of machine learning, deep learning, has been widely used in recent years for object detection problems. For instance, it has been applied in real-time applications such as autonomous driving, robot vision and video surveillance [5]. Many new methods have achieved promising results for deep learning object detection such as You Only Look Once (YOLO) [6] or Single Shot Detector (SSD) [7]. In this work, I use the deep learning object detector, YOLOv4, to recognize objects in the eye-tracking videos. As the eye-tracking videos are shot from a first person view and this view changed rapidly due to head movements, the object detector I trained had to cope with unstable and rapidly changing videos. This thesis aims to use a deep learning algorithm to achieve good performance and accuracy in detecting the target objects in the RDG-Map game from first-person eye-tracking data.
1.1 Purpose and Goals
The goal of the thesis is to detect objects in the first-person video stream, collected with a wearable eye-tracker, to decide whether the gaze of the person falls on one of the important objects in the game. To be able to achieve this goal, the system first has to 1) detect the three target objects in the video (tablet, shared touchscreen and the robot) and 2) determine if the center of gaze, provided by the Tobii eye-tracker, fell on one of these target objects. The system will be divided into two parts, an object detector and a parser. The object detector will use the eye-tracking videos to provide an output consisting of the detected target objects. The parser will use this output from the object detector along with the gaze annotations to determine if the center of gaze fell on one of the target objects.
As the main idea of the RDG-Map game project is to create a robot able to react to a participant’s engagement in real-time, the object detector developed in this thesis must provide information of the gaze of the participant in real-time as well. A further challenge in this project is hence to create an object detector that is both accurate and fast in detecting the direction of gaze.
• Run in real-time (25 FPS, the same as the provided videos) or faster.
• Each object detector have a reported accuracy when trained on a specific data set. When the object detector is trained on a custom data set, it should achieve the same accuracy as the reported accuracy or higher. A high accuracy means the object detector is good at detecting the target objects.
The parser should be able to:
• Determine if the center of gaze fell on one of the target objects and provide a duration (how long the participant have been looking at that object).
The system as a whole will have its performance evaluated by testing:
• How the amount of training data influences the performance of the object detector.
• How the accuracy between YOLOv3 and YOLOv4 differs.
• How accurate the system is at determining the center of gaze compared to manually annotated videos (the ground truth).
1.2 Outline
Section 2 covers the introduction to deep learning and why I chose to use deep learning instead of other machine learning approaches. Section 3 contains information of the data sets used in the project, the object detection data set and the gaze data set, and description of the data sets. It also covers the requirements for the system. Section 4 discusses the implementation of the object detection and the parser and the problems that occurred during working on the project and their solutions. Section 5 evaluates the system and Section 6 covers sources of error and future work. Finally, Section 7 concludes the thesis.
2 Background
2.1 Deep learning vs. Traditional computer vision for object detection
Object detection tackles two problems: (1) object localization, where an object is lo-cated in an image, and (2) object classification, to which category the object belongs to. The goal is to answer the question, "What object is where?". This thesis considers two different approaches the object detection: Traditional computer vision and deep learn-ing. The more traditional approach dates back 10-20 years while deep learning is still relatively new. Figure. 1 from a paper written by Zhengxia Zou, Zhenwei Shi, Yuhong Guo and Jieping Ye [5] shows a basic timeline.
Figure 1: Object Detection timeline. Figure from [5].
In the case of object detection, when papers talk about traditional computer vision, they are usually talking about machine learning. Machine learning is a subset of artificial intelligence which uses algorithms to interpret structured data, learn from that data and produce a desired output. Machine learning models may be supervised or unsupervised. A machine learning model that uses a supervised learning model is an algorithm that learns from a labeled data set and is taught by example. The models applies what it learned to new data and predicts an outcome. In contrast, unsupervised learning uses an unlabeled data set. The machine has to learn the labels by itself and classify the data without any prior information. Machine learning models are usually combined with feature descriptors such as HOG (Histogram of oriented gradients) + SVM (Support vector machine). A feature descriptor provides descriptions for the visual features of the objects in images such as shape, color, texture or motion. A SVM is a supervised
machine learning model. It is used for two-group classification problems. After giving the SVM a set of labeled training data (each data must be marked as belonging to a category), the SVM is able to build a model that assigns new data to a specific category. The descriptions are shown to the SVM which classifies them as different objects. SIFT (Scale-Invariant Feature Transform) + BoW (Bag of (visual) words) + SVM is another example of a machine learning model. For a large number of images, each image is extracted into SIFT features and a feature descriptor is obtained from each feature. The set of feature descriptors are clustered and every feature is assigned to a single cluster. By calculating the frequency of each cluster, a histogram can be created for each image which will be the BoW. The SVM can be trained on these histograms.
Deep learning is a subset of machine learning which have numerous layers of algorithms. The network of algorithms is called an artificial neural network (ANN) and is intended to imitate the functions of neurons in the human brain. For example, in deep learning, a CNN (Convolutional neural network) is a class of neural networks, commonly used in computer vision tasks as it often excels in image recognition and classification. An example of a CNN model would be YOLO (You Only Look Once), a real-time deep learning model, which is further explained in the next section. An example of how a CNN could be used when detecting a human face in an image is that the lower layers are used for simpler tasks such as edge detection or color selection, while the higher layers use the input from the lower layers to detect relevant features of a human face such as the eyes or a nose. Finally, the highest layer detects the entire face as a whole.
After using a machine learning model or deep learning model, it is necessary to perform an accuracy test to validate the results. There are several ways to calculate the accuracy for machine learning and deep learning models such as AUC (Area under curve), ROC (Receiver operating characteristic curve), IOU (Intersection over union), precision, recall,
average precision (AP) and mean average precision (mAP).
The AUC ranges from 0 to 1. An AUC score of 0.5 points means the classification is no better than random but as the score increases so does the correctness of the classification, with more objects being classified accurately. AUC is calculated from the ROC. The ROC is created by plotting the True Positive Rate (TPR) vs. the False Positive Rate (FPR) which creates a graph showing the performance of a classification model. The TPR is another word for recall. For example, say the class to predict is a car. A true positive (TP) is where the model correctly predicts the positive class (the car is in fact a car), a false positive (FP) is when the the model incorrectly predicts the positive class (other object is a car), true negative (TN) is when the model correctly predicts the negative class (other object isn’t a car) and false negative (FN) is when the model incorrectly predicts the negative class (the car is recognized as another object). To calculate the FPR and TPR, this formula is used, see equation 1:
T P R = T P
T P + F N F P R =
F P
F P + T N (1)
Preferably, a model should have no overlap between the true negatives and true positives. An indication of a good separation of the true positives and true negatives is the ROC and the AUC. If there is no overlap between the true positives and the true negatives, it means there are no false positives and false negatives and the model has an AUC of 1, which means it is 100% able to distinguish between the classes. The ROC in this case would look like a square and calculating the area under the ROC would give an AUC of 1, see Figure 2.
Figure 2: ROC with an AUC of 1, picture taken from [8]
Precision answers the question of "How many selected items are correct?" while recall or TPR answers the question of "How many relevant items are selected?". The calculation of precision and recall is based on true positives, true negatives, false positives and false negatives. The formula for precision is seen in equation 2:
P recision = T P
T P + F P (2)
Imagine a computer program for recognizing cars in a park. The program identifies 10 cars in a picture containing 15 objects. Of 10 identified as cars, 7 actually are cars (true positives) while the rest are bicycles (false positives). The 5 other objects are identified as bicycles (true negative) but 1 of them is a car (false negative). The program’s precision is 7/10 while its recall is 7/8.
The IOU is a useful way of measuring the accuracy of object detection models. It measures the overlap between two bounding boxes. If the overlap is 100%, the boxes are right on top of each other and the IOU is 1 (Equation 3).
IOU = Area of overlap
Area of union (3)
The IOU is useful as a threshold to determine if the prediction is correct or not. The model’s prediction is considered correct if the IOU is bigger or equal to 0.5 and incorrect otherwise. The AP is achieved by calculating the average precision for one class over all IOU thresholds which is useful for calculating mAP. The mAP is determined from the AP and is calculated from the AP over all classes and IOU thresholds.
When training the object detector, the machine learns by the means of a loss function. The function tells the machine how well the algorithm works and when the prediction is wrong, the loss increases. During the training, the machine learns how to minimize the error in prediction and reduce the loss. For example in YOLO, there are three loss functions: The classification loss, the localization loss and the confidence loss. In the classification loss, there is a penalty for every wrong prediction, namely that for every wrong prediction the loss increases so as time goes on the machine will learn which predictions will minimize the loss. The localization loss measures the difference between the predicted bounding boxes and the actual bounding boxes (the ground truth) and the bigger the difference is between the size of the boxes and the placement of the boxes, the higher the loss is. The confidence loss calculates the total error of confidence. Confidence in YOLO is a percentage which says how sure the model is that a specific class is detected in a bounding box. The goal for YOLO as a deep learning model is to minimize the loss during training.
When it comes to choosing between using traditional computer vision and deep learning, there are several factors one must take in consideration. Both traditional computer vision and deep learning have disadvantages and advantages and choosing the correct solution is difficult. In traditional computer vision, the object detection problem is addressed in three stages: Informative region selection, feature extraction and classification [9], as illustrated in Figure 3.
A big disadvantage of this approach is that the accuracy of the classification is hugely dependent on the feature extraction stage. Traditional computer vision methods entail that for each image, a human has to choose which features are important. One problem is that a person is not necessarily able to select all the important features from an image, and some meaningful features might be overlooked. Choosing which features are important can be burdensome, especially if the number of objects to detect increases [10]. Each feature also comes with a large amount of parameters which must be chosen, which increases the difficulty drastically.
Figure 3: (a)Traditional Computer Vision workflow (b) Deep Learning
work-flow. Figure taken from [10].
In the informative region selection stage, the computer localizes certain target objects by scanning the whole image with a multi-scale scanning window. The multi-scale scanning window is smaller than the image and moves across it. All possible regions can be examined by scanning the image left to right and top to bottom with the window. Each window is classified by checking if it matches one of the target objects. While this is a legitimate strategy, there are some setbacks. There are a large number of windows, but not all of them are necessary to localize the target object(s), hence most of them are redundant. However, removing these windows may cause a bad region selection. In the feature extraction stage, feature descriptors such as SIFT are used to extract the visual features (which can be different things such as edges, corners and/or colors) needed to recognize objects. A person has beforehand selected the relevant features for extraction.
As there is a difference between pictures when it comes to lighting, background and the appearance of the object, it is difficult to design a feature descriptor able to capture the target object(s) in all the possible conditions. In the classification stage, a classifier is used in order to distinguish the target object from all other objects. This is usually done with a machine learning model like SVM. The machine learning algorithms get the features as an input and they learn rules from the features that differentiate different classes of objects.
In contrast, in deep learning, the machine is given a data set of images which have been annotated with the classes of objects that are present in it. The deep learning model is trained on this data set and the neural networks in the model automatically extract the most relevant features for each object. An advantage for this method compared to a more traditional approach is that it requires less expertise, as the system is "trained"
rather than programmed. A disadvantage is that it works like a black box, it is highly unclear how the input affects the output. Furthermore, deep learning also comes with a trade-off: Computing requirements and training time. Deep learning algorithms usually require huge data sets and as the custom data set increases in size, so does the training time and it could take hours, or days to finish. While training, a good computer is necessary as it is an intensive task and as such not everyone is able to use deep learning for their program.
In recent years, deep learning has become a popular method for detecting objects in different domains and the models were consistently able to outperform more traditional machine learning techniques. Multiple papers using different data sets, models and accuracy measurement reach the same conclusion: that deep leaning models achieve better results than traditional ones.
In prostate cancer image classification, Wang et al. [11] achieved an AUC of 0.84 with the DCNN (Deep CNN), meaning the CNN have more layers, and an AUC of 0.7 with SIFT + BoW + SVM. In vehicle detection, Kaplan and Saykol [12] reported that YOLO got an accuracy of 81.9% with a FPS of 42 and HOG + SVM got an accuracy of 57.8% with a FPS of 4 so YOLO was more accurate and faster. In iris localization, Severo et al. [13] showed an accuracy of 98.02% in YOLO and 94.04% in HOG+SVM [13]. They were sufficiently impressed with YOLO to end the abstract with:
"Experimental results showed that the deep learning based detector outperforms the other ones in terms of accuracy and runtime (GPUs version) and should be chosen whenever possible."
As deep learning models seem to be able to achieve a good enough run time, in line with the terms set for the object detector, and since they show better accuracy than traditional computer vision models, I decided to employ deep learning models for our object detector.
2.2 Choosing the appropriate deep learning model
When it comes to deep learning and choosing the appropriate type of detector, the choice lies between a two-stage detector or a one-stage detector. To clarify, two-stage detectors, as the name suggests, have two stages. The first stage uses a Region Proposal Network to generate regions of interest (i.e areas that might contain the object) and the second stage sends the region proposals down to a classifier for the final prediction. Simplified, the stages are 1) Region proposal and 2) Detection. The one-stage detector completely skips over the first stage and predicts all the bounding boxes without any region proposals. For object detection, two-stage detectors are better at localization tasks and recognition accuracy while one-stage detectors have high inference speed [14].
Figure 4 from Poirson et.al, 2016 [15] shows the difference between the two detectors.
Figure 4: (a) The two-stage approach (b) The one-stage method. Picture
taken from [15]
In general two-stage detectors are better for accuracy and one-stage detectors are more suitable for faster programs. However, in recent years, one-stage detectors have achieved improved accuracy, which makes them a suitable choice for real-time object detection. Table 1 shows the difference in accuracy and speed of various detectors [5].
Detector mAP Speed Dataset One-stage detector RCNN 58.5% 14s per image with GPU VOC07 X
SPPNet 59.2% 20x faster than RCNN VOC07 X Fast RCNN 70.0% 200x faster than RCNN VOC07 X
Faster RCNN 73.2% 17fps VOC07 X
YOLO 52.7% 155fps VOC07 O
YOLOv2 63.4% 45fps VOC07 O
SSD 76.8% 59fps VOC07 O
Table 1: Comparison of different detectors. X means the detector is a
two-stage detector, O means the detector is a one-two-stage detector. Data taken from [5] and added to table.
or shortened, VOC07. Pascal VOC provides image data sets for object recognition. Fur-thermore, Pascal VOC enables evaluation and comparison of different object detection methods.
RCNN (Regions with CNN features) was created in 2014. It extracts a set of the object proposals. An object proposal is a segment of an image where the algorithm think there seems to be an object. Each proposal is re-scaled to a fixed size and input into a CNN model (previously trained on a data set) to extract the proposed features. SVM classifiers are used to predict if an object is detected within each region. Due to it having around 2000 proposals for each image, it has an extremely slow detection speed (as seen in table 1) which is why this thesis doesn’t consider it a suitable option [5].
SPPNet (Spatial Pyramid Pooling Networks) was also introduced in 2014. Many previ-ous CNN models required a fixed-size input. SPPnet introduced the Spatial Pyramid Pooling (SPP) layer which enabled the CNN to generate a fixed-length representation of an image without the need of re-scaling the image. That means the feature maps only need to be computed for each image only once and the fixed-length representations can be generated for training the detectors. By avoiding computing the features repeatedly, SPPnet managed to be 20 times faster than RCNN without sacrificing accuracy [5].
Fast RCNN was introduced in 2015, it showed an improvement in speed with respect to others, as it was able to simultaneously train a detector and bounding box regressor under the same network configuration. However, because the model uses both a CNN and external region proposal method, like selective search, to create regions of interest, it is not an end-to-end deep learning model. Due to it having the same problem with the amount of proposals as RCNN, its detection speed is limited [5].
Faster RCNN came shortly after Fast RCNN and was the first end-to-end deep learning object detector. Faster RCNN used a Region Proposal Network (RPN) which made the region proposals nearly cost-free, replacing the previous external region proposal method with an internal network [5].
YOLO (You Only Look Once) was introduced in 2015 and was the first one-stage de-tector in the deep learning era. YOLO is extremely fast due it applying a single neural network to a full image. The image is divided into regions and both bounding boxes and probabilities are predicted for each image simultaneously. Simply put, proposal detec-tion and verificadetec-tion occur in the same step. YOLO suffers from a decrease in accuracy, especially for smaller objects, but this has been improved in its later versions [5].
Also in 2015, Single Shot Detector (SSD) was proposed and it was the second one-stage detector ever proposed. SSD introduced multi-reference and multi-resolution detection techniques which improved the detection speed and accuracy [5].
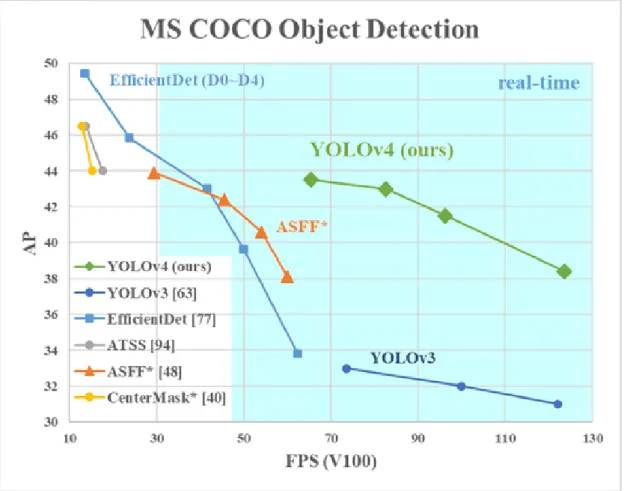
accuracy as SSD but at 3 times the speed [16] while YOLOv4 attained better accuracy and speed than YOLOv3 [17] (see Fig. 5).
The paper on YOLOv4 was submitted on the 23rd of April 2020, meaning that other than the creators, no one has yet backed up the increase in performance of this object detector unlike YOLOv3. An interesting question to evaluate would therefore be if YOLOv4 achieves a better performance than YOLOv3 and as such both are chosen for comparison in this work.
Figure 5: Comparison of the proposed YOLOv4 and other state-of-the-art
object detectors. YOLOv4 improved YOLOv3’s AP (Average precision) and FPS by 10% and 12%, respectively. Figure from [17].
3 Data and requirements
This section will describe: The material (the data sets) used for the system and how gaze was annotated through the eye-tracker.
3.1 The data sets
There are two data sets used in the system: The gaze data set and the object detection data set. The gaze data set was collected during a study carried out by Uppsala Social Robotics Lab. It consists of eye-tracking data with corresponding videos and JSON files with gaze information. The object detection data set is used for training YOLOv4 and consists of various images of the Furhat robot, television screens and tablets.
3.1.1 The gaze data set
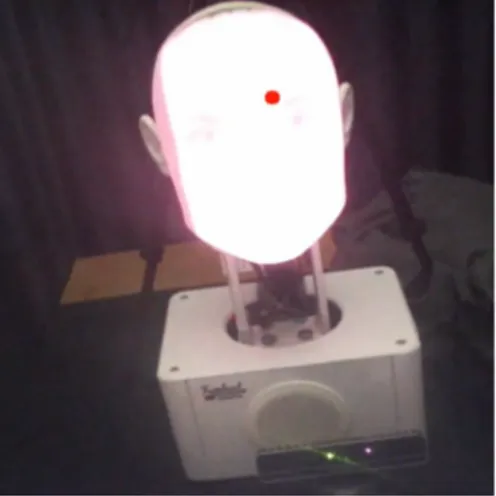
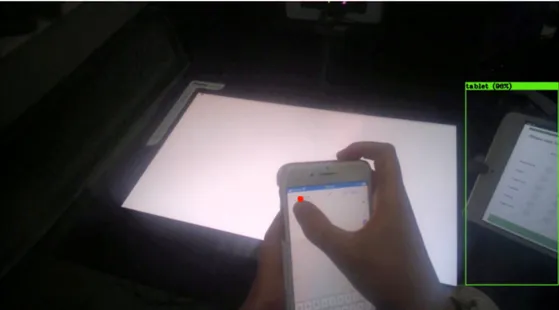
The data set used for this thesis project comes from a study where 49 participants played the RDG-Map game with the robot up to three times [2]. All in all, the participants engaged in 139 sessions. During these sessions, the participant was required to wear eye-tracking glasses which collected data of where the person was looking during these sessions. For each participant, the eye-tracking data consisted of a video of the experi-mental session collected from the point of view of the participant and a JSON file with the corresponding gaze information collected from the video file. Each line in the JSON file has a timestamp and features the following pieces of information: status (s), pupil center (pc), pupil diameter (pd), gaze direction (gd), gaze position on scene video (gp), gaze convergence position in 3D space (gp3), gyroscope (gy) and accelerator (ac). If the data was able to be collected properly, the status is equal to 0. Any other number indi-cates something is wrong with the data. For this project, we focus on gp, gaze position on scene video, as it gives the x and y coordinates of the participant’s gaze (the center of attention) in the video file and a reference time of when they occurred. The x and y coordinates are given in a range of 0 to 1 (example [0.3234, 0.7754]). By multiplying these values with the width and height of the video respectively, the x and y values can be transformed to the format of pixels. The Tobii eye-tracker was sometimes unable to calculate the center of attention. In this situation, the status is any number other than 0 and the x,y coordinates are set to value of [0,0]. The video combined with the JSON-file results in the following screenshot, see Fig 6.
Figure 6: The gaze and its respective x,y coordinates are extracted from the
JSON-file and illustrated as a red dot. The gaze is currently focused on the robot in the video.
3.1.2 The object detection data set
The object detection data set used to train YOLOv4 consists of 337 images of tablets, television screens (the shared touchscreen looks like a television) and furhat robots. The reason why this data set is needed is due to the object detector needing labelled data, with the data consisting of the objects one want to detect. As the object detector needs to be trained on labelled data, images has been aquired either from other sources or from screenshots from the gaze data set videos and labelled thereafter.
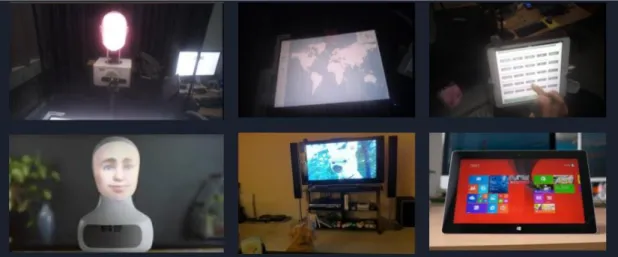
The whole data set consists of 133 pictures of the television screen, 78 pictures of the robot and 156 pictures of the tablet (several objects may exist in one image). 46% of the images of the robot are taken from Google Images, the rest are screenshots from the videos. 74% of the television images and 78% of the tablet images come from Open Images [18], a data set consisting of over 9 million images, and the rest are screenshots from the videos, see Figure 7. There are also 14 images considered to be "negative", meaning there are to be considered as having none of the target objects in them. The television and tablet already had a huge amount images in the Open Images data set but the Furhat robot did not have the same amount of images available online. Having the same amount of images for each object was important, especially since each object have a similar illumination which would confuse the computer if trained mostly on only one object, mistaking one object for another. This was solved by having about the same amount of images per object, both for training and validation.
Figure 7: The top row consists of screenshots while the bottom row consists
of images taken from other sources.
3.2 Annotation guidelines and requirements
The accuracy of the system is achieved by comparing the automated annotations from the developed system to the manual annotations from a human annotator. The auto-mated annotations and the manual annotations followed the same rule: the gaze of the participant is annotated as falling on an object, when the center of gaze of the par-ticipant (the x and y coordinates provided by the Tobii eye-tracker) falls within the boundaries of such object. For the automated system, this was achieved by first recog-nizing the objects in the first-person video stream collected from the eye-tracker, and then detecting whether the center of attention fell within the bounding boxes of one of the detected objects. The former task is achieved through the object detector, the latter by the parser.
For its development, the object detector requires three steps: Train YOLOv4 with the object detection data set, input the eye-tracker first person video from the gaze data set and output the coordinates of the detected target objects from the video. The parser will take the coordinates of the detected objects as input, input the JSON file from the gaze data set, as to get the position of gaze in x,y coordinates, and output direction of gaze with duration. When the direction of gaze enters a target object (tablet, shared touchscreen / tv, or furhat robot), this action will be labelled in the parser and timed until the direction of gaze changes. If the gaze is not on one of the target objects, the label somewhere else will be assigned by the parser and the time participants gaze away from the target objects is calculated. Finally, if the gaze information from the JSON-file is not available, the parser will assign the label "Not applicable" to the video, see Figures 8-12.
Gaze towards tablet - Annotated as tablet in parser
Figure 8: In each picture the center of gaze is illustrated as a red circle and
each one of the target objects have a drawn bounding box to show if the center of gaze is inside the bounding box or not. The participant’s gaze is
focused on the tablet.
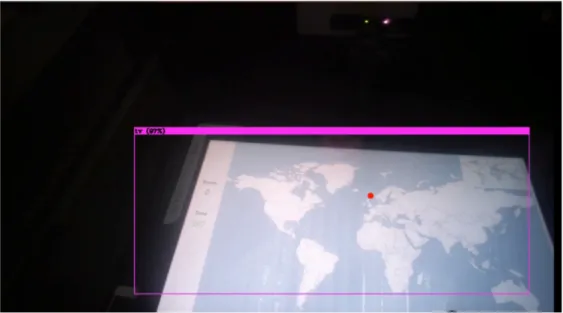
Gaze toward television screen - Annotated as tv in parser
Gaze toward the robot - Annotated as furhat in parser
Figure 10: The participant’s gaze is focused on the robot
Gaze somewhere else - Annotated as Somewhere Else in parser
Figure 11: The participant’s gaze is focused on none of the three target
Not applicable - Annotated as Not applicable in parser
Figure 12: The gaze is shown as a red circle in the top left corner. This
means that gaze annotation data is missing.
With these guidelines, the requirements of the system can be written as:
• Task 1: Recognize the target object in the eye-tracker first person video stream.
• Task 2: Figure out whether the gaze of the participant as indicated by the x and y coordinated provided by the Tobii eye-tracker fell on these target objects.
4 Implementation
The implementation section shows the implementation of the system. The section is divided into two parts: The implementation of the object detector YOLOv4 and the implementation of the parser and its various functions.
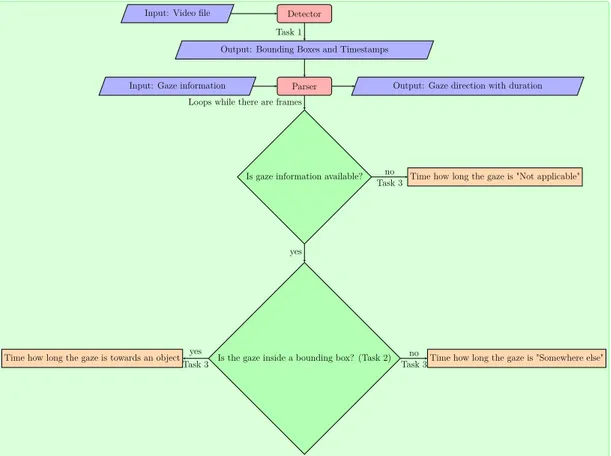
Any good program has a well-thought out program flow before implementation. The imagined system flow works in two parts: object detection and timing of gaze. The object detection program will provide an output by writing the information to the shell and give the coordinates of the detected objects bounding boxes (Task 1). This, in combination with the eye gaze annotations from the videos, will be the input to the parser which will 1) Check if the gaze is inside any of the bounding boxes (Task 2) and 2) Start the timer for any of the cases previously discussed (Task 3), see Figure 13.
Detector Input: Video file
Output: Bounding Boxes and Timestamps Task 1
Parser Input: Gaze information
Is gaze information available? Loops while there are frames
Is the gaze inside a bounding box? (Task 2)
Time how long the gaze is "Not applicable"
yes
no Task 3
Time how long the gaze is "Somewhere else"
Time how long the gaze is towards an object no
Task 3 yes
Task 3
Output: Gaze direction with duration
Figure 13: Proposed program flow
To run the object detection [19] and parser programs, the following technologies are required.
• A CUDA compatible GPU (Program run on NVIDIA GeForce RTX 2080 Ti) • CUDA version 10.2 • OpenCV version 3.2 • cuDNN version 7.6.5 • GCC or CLANG • Python
4.1 Implementation of the object detection (Task 1)
The implementation used a framework called Darknet [20]. Darknet is an open source neural network framework written in C and CUDA. A forked github repository has created a more user friendly version of the original Darknet [19] and this is the github that was used in the implementation. Object detection on this framework was straightforward but it still required training for custom objects as YOLOV4 was previously trained on the classes appearing in the MS COCO data set [21] which included common objects such as toothbrush, tv, person, car etc. The goal of the object detection system was to detect a tablet, a television screen and the Furhat robot. The COCO data set did not include pictures of tablets so the Open Images data set was used instead. The tablet and the television were part of the Open Images data set but the robot was not so additional training for the detection of custom objects was required. To train for detection on custom objects, there were several steps to be followed.
1. The images used for the data set had to be labelled with a corresponding text file, containing the object number (each object must have a number as an unique ID) and object coordinates on this image.
2. The path to all images must be put either in one of two text files, train.txt or test.txt. The images in train.txt were to be used for training the detector and the images in test.txt for testing the accuracy of the detector. The images in the train.txt and test.txt did not overlap.
3. The obj.data in the repository must be changed to the number of classes used for training the detector.
4. The cfg-file in the repository had to be changed to work with the number of classes used (i.e 3 classes tablet, furhat, tv) which required changing the number of classes, number of filters etc.
5. A pre-trained weight called yolov4.conv.137 was downloaded for ensuring the train-ing gets a more accurate result. The reason why ustrain-ing a pre-trained weight is more accurate than training the model from scratch is that the pre-trained weight is trained on a much bigger data set and thus more accurate. Also the model will converge faster due to the lower layers already being trained (the layers responsi-ble for recognizing color, edges, corners and more) and the higher layers will be fine-tuned to the input data.
Preferably, if the data set were made correctly and all instructions were followed, the mAP would increase and the loss would decrease as the program ran. A low mAP and a high loss are signs the something went very wrong and the program would have to be re-trained after finding and fixing the causes to the problem. Fig. 14 shows the loss and mAP during training.
Figure 14: A chart made during the training of YOLOv4. The y-axis shows
the loss and x-axis shows the number of iterations.
meant just commenting out several print statements and adding some other print state-ments such as a frame number, the approximate time the object was detected and the coordinates for the bounding box.
The detectors input and output are the following:
• fullstream.mp4: Input video from the gaze data set.
• result.avi: The resulting videofile with the target objects detected.
• result.txt: Contains the approximate time in the video, the frame number, the object(s) detected, the accuracy of the detection and the bounding boxes of the object(s).
4.2 Implementation of the parser (Task 2 and Task 3)
The result.txt textfile is used in parse.py to provide the final output. There are several functions in parse.py which are important. The order of which the required functions are run is: starttime(), extract(), findGazePos(), matchFrames(), timeGaze() and output(). Optional functions are toFile(), drawCircle() and counter(start time, end time, target object), these are run after the required functions.
starttime() opens the livedata.json file which contains the gaze information extracted
from the parent project video files. The livedata.json file has a timestamp, called "ts", on every line. The start of the video is marked by a string called "vts" followed by the number 0 and starttime() saved the timestamp on that line for further use.
Figure 15: A snapshot from the livedata.json file
extract() works with the text file obtained from the object detection. The text file
contains the following pieces of information per frame: A frame number, the approximate time (in the video), the detected object, accuracy in percentage, and the coordinates for
the bounding box. All objects are saved in a python dictionary with the frame as a key and the time, object, accuracy and coordinates as values.
findGazePos() opens the livedata.json file again. It checks the file for any mention of
"gp", which stands for gaze position, and saves the timestamp and the center of gaze in a python dictionary. The timestamp must also be altered, as the livedata.json files starts the timer at an arbitrary point in time, so to get the accurate time of the video one must subtract the timestamp with the starting time (obtained from starttime()). Dividing the new time by 1000000 results in the final time in seconds. The final python dictionary thus contains the frame as key and the x and y values in pixels and the timestamp in seconds in regards to the actual start time of the video as values.
matchFrames() makes sure that the number of frames obtained from the gaze
dic-tionary and the object detection dicdic-tionary is the same. The problem arises from the information obtained from the gaze dictionary. The Tobii eye-tracking device sometimes misses capturing gaze information for some of the frames. By adding 0 values to the x and y positions for that frame (as they were not detected anyway), the end result will be a larger gaze dictionary which will match the object detection dictionary.
timeGaze() is the most important function of the whole program. For every frame, this
being the key for both the gaze dictionary and the object detection dictionary, it extracts the values from both. From the gaze dictionary a list can be extracted containing the center of gaze and the timestamp. From the object detection dictionary a list can be extracted containing the timestamp, the object, the accuracy and the coordinates for the bounding box.
There are 5 different categories to time: "Not Applicable", "Somewhere Else", "tablet", "tv" and "furhat". Each time the center of gaze falls on an object (tablet, tv, furhat), a timer starts and the first time the gaze falls on the object is recorded as well as the last time the gaze falls on that object. This is done by a helper function called checkIfInsideBoundingBox() which takes the coordinates of the bounding box and the center of gaze as input and returns true if if the center of gaze is inside the bounding box and false otherwise.
How accuracy is calculated for the system is further discussed in the result section. Note that if two objects are detected at the same time, their bounding boxes overlap and the gaze falls inside both bounding boxes, the one with the highest certainty from the object detector is chosen. The reasoning for this is if the gaze is detected to be inside the bounding boxes and two objects are detected, then it must mean that the objects are almost at the same coordinates. As such the most reasonable option is to chose the one with the highest certainty, or accuracy, in detection.
Figure 16: The bounding boxes for the tablet and the television overlap. The
gaze is inside both bounding boxes. The tablets certainty is higher (100%) so in this case the gaze is labelled as falling on the tablet.
If the gaze does not fall on any of the detected objects (the tablet, the television screen, or the robot) the participant is considered as focusing "somewhere else", and is inferred to be distracted.
Lastly, "Not Applicable" is when the gaze has the x and y positions [0,0] which is con-sidered to be due to errors in how the center of gaze is calculated.
All of this is put inside a python dictionary with the frame as a key and the values being the one of the 5 categories ("Not Applicable", "Somewhere Else", "tablet","tv","furhat"), the time the behaviour started, the time when the behaviour ended and the duration of the behaviour.
output() the final result of the whole program to a text file called Final.txt. The text
file contains in each line: The frame number, the gaze direction recognized, the first time the gaze direction started, the last time the gaze direction was still in action and the duration. Fig. 17 shows the text file.
toFile() (Optional) writes the final gaze dictionary to a file called out.txt. This is a
purely optional bit of code which one can comment out if not desired and is there solely for easier debugging purposes. The text file contains the timestamps, frame numbers and x and y positions extracted from the livedata.json file.
Figure 17: The final text file
drawCircle() (Optional) outputs a video file called out.avi. After the detector is done,
it outputs a video file called result.avi which is the final video file with all the detected objects. This function simply draws the center of gaze on each frame in the result.avi file and outputs the final result as the out.avi file. This is also optional and was made for debugging purposes.
counter(start time, stop time, target object) (Optional) is used to determine
in which frequency the gaze is detected to be on the target object between the start time and stop time. This is used in the result section to determine the accuracy for the system as a whole.
4.3 Problems during the development and their solutions
4.3.1 Slow implementation
The library used early in the project was ImageAI, a Python library which supports a list of Machine Learning algorithms for image prediction, custom image prediction, object detection, video detection, video object tracking and image predictions training [22]. It was mainly chosen as it supports using YOLOv3 for object detection. I experienced some issues with the library however. First issue was that the installation of the library according to the GitHub page was documented incorrectly. As one installs it according to the instructions, it automatically installs TensorFlow 2.0, a version not yet supported by ImageAi. Getting the library to work on an earlier version on TensorFlow was difficult as there was little documentation providing instruction. Second issue was that, once working correctly, the program was incredibly slow. For instance, while running it had
a frame rate of 2 fps. This is an unacceptable speed while running YOLOv3, as it is supposed to get a fps up to 40 on computers with good GPU [23] which is why a switch to Darknet was made.
4.3.2 Installing required technologies
During the implementation of YOLOv4, one of the biggest problems was getting CUDA properly installed on the computer. Early in the development, a virtual machine was used for programming. However, due to the virtual machine requiring a severely complicated setup to get the GPU running, the implementation was moved to a Linux system on a dual-booted computer. Installing the Nvidia graphics card driver and thereafter CUDA fixed the issue.
4.3.3 Using a proper data set
Finding proper images for the classes used was a big issue. The television and tablet already had a huge amount of images in the Open Images data set but the Furhat robot did not have the same amount of images available online. Having the same amount of images for each object was important, especially since each object had a similar illumination which would confuse the computer if trained mostly on only one object, mistaking one object for another. This was solved by having about the same amount of images per object, both for training and validation. However, finding images and annotating them manually proved to be a difficult task. Human-error made the program create bounding boxes incorrectly, often missing the object it was supposed to detect by a significant margin. The solution for this was a program called "Open Images Dataset v5 ToolKit" [24] which is a toolkit designed to download specific classes from the Open Images dataset and annotate according to YOLOv3 requirements (which are the same for YOLOv4). This significantly reduced the time needed for annotating images, as only the Furhat images needed to be manually annotated (as they were not part of the Open Images data set) and it also increased accuracy as the television and tablet images already had been annotated correctly by the Open Images team.
4.3.4 Usage of accuracy in the program when deciding which object is detected
When detecting an object the detector returns an accuracy in percentage of how sure it is that object is, in fact, that object. This was used in the code when deciding which object the user was looking at by taking the highest accuracy and using the corresponding object. In afterthought, this was the wrong way to use the accuracy unless the objects
happen to be in the same position (i.e the object detector is 49% sure the tv is either a tv or a furhat) and this very rarely happens as the furhat is very seldom mistaken for the television and vice versa. Instead, to decide which object is the right one, the function checkIfInsideBoundingBox is used on both objects and the object which has the users’ gaze inside its coordinates is chosen as the correct object.
4.3.5 Scale-invariance
At the beginning of the implementation, the object detector was trained with the COCO data set, which contains 80 classes. This was to see which classes it was able to detect in the gaze data set video files. The video file showed a detector which was not able to see the difference between a laptop and a television, see Fig. 18
Figure 18: Result from the COCO data set.
So, the conclusion (although an incorrect conclusion) from this image was if the detector is trained with all three classes (the Furhat, the television and the tablet), it will certainly detect the television as the tablet and vice versa. An object detector trained on only two classes (television and the furhat), could use the parser to see if the detected television’s bounding box is smaller than a set pixel width and height and thus, label it as a tablet in the parser instead. This would not only decrease the training time (training 2 classes takes 2 hours, while training 3 classes takes around 4.5 hours) but it would solve the problem of mistakenly labeling the television as the tablet and vice versa, see Fig. 19.
Figure 19: The program detected a television even though the object is
clearly a tablet. This is on purpose to reduce training time. In the parser one can deduct which object (television or tablet) is being detected by measuring the size of the bounding box and as such this will be labelled as a tablet in
the parser.
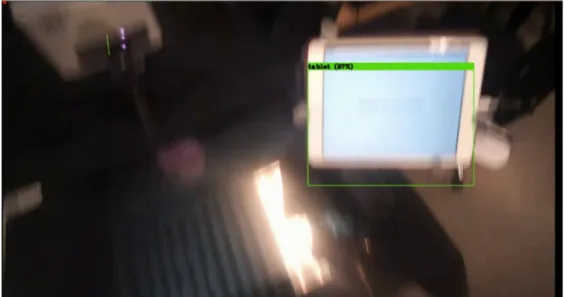
This worked quite well until one video where the participant is standing very close to the tablet. As the object detector only detected two objects (furhat and television) and the parser recognized any detected object bigger than a certain size as a television, the result was that the tablet was wrongly recognized as a television. To put it in other terms, the system was not scale-invariant, requiring the objects to remain a certain size for proper detection and labelling. The only way to fix this problem was to retrain the object detector with all three objects, see Fig. 20. We tested the performance of the new object detector against the old object detector to ascertain that the new implementation was an improvement, and present the results in the result section.
5 Result
5.1 Deciding between using YOLOv3 or YOLOv4
This testing was done when the object detectors were still trained on two objects. Run-ning both programs on a data set of 70 images gave the following results, table 2 shows the results from YOLOv3 and YOLOv4. This is Task 1 in the program flow in Fig 13 which is to detect the objects.
Detector mAP Precision Recall AP for TV AP for furhat YOLOv3 76.52% 0.82 0.60 53.41% 99.63% YOLOv4 93.98% 0.92 0.89 87.95% 100%
Table 2: Comparison of YOLOv3 and YOLOv4
Clearly, YOLOv4 has the better results, giving us a mAP of 93.98% compared to YOLOv3s 76.52%. But, these two programs provided different advantages and disad-vantages. YOLOv4 was more accurate than YOLOv3 but YOLOv4 also had more false positives compared to YOLOv3, which had more false negatives. This was discovered while using these programs for comparison on object detection in a video, see images below Fig. 21 and Fig. 22.
Figure 21: False negative from YOLOv3 in a video frame. YOLOv4 on the
Figure 22: False positive from YOLOv4 in a video frame. YOLOv4 on the
left, YOLOv3 on the right.
Further investigation was necessary to determine which version was better. Hence, the data set was improved and the program ran again to limit the false negative and positives in both versions. The training images was increased from 70 to 164, the newly added images consisted of both television and Furhat images and YOLOv4 was updated to its newest version. Table 4 shows the results from the training.
Detector mAP Precision Recall AP for TV AP for furhat YOLOv3 73.72% 0.85 0.64 57.63% 89.80% YOLOv4 93.22% 0.84 0.88 87.09% 99.35%
Table 3: Comparison of YOLOv3 and YOLOv4 after increasing the data set
Surprisingly, it seems like both programs got worse after the re-training, with mAPs being slightly lower in both programs. However, this is not the case. When running the program on the video files again, there was a clear decrease in flickering and false positives and false negatives, see Fig. 23 and Fig. 24.
Figure 23: False negative fixed in YOLOv3. YOLOv4 on the left, YOLOv3
on the right.
Figure 24: False positive fixed in YOLOv4. YOLOv4 on the left, YOLOv3
on the right.
The main reason for the decrease in mAP was that more difficult images were added to the training data set. Pictures where none of these objects could be found, or the objects were partially obscured or only seen on the edge of the screen. Some of the images were screenshots from videos which could have decreased the quality of the data set due to low resolution. This could potentially be fixed in the future by experimenting with the data set size and overall increasing the quality of the images.
5.2 Accuracy testing for the system
A short test was made with 10 videos from the gaze data set. A sample of a couple of seconds (the amount of seconds varies in each video) was randomly taken from each of them and I manually annotated that part of the video with where the participant looked at a specific time (example: From 1.12-1.20 the participant is looking at the tablet). The drawCircle() function provides a video with bounding boxes for the target objects and a dot drawn where the participant is looking and this was used when manually annotating the videos, see Fig. 25.
Figure 25: Screenshot from the video. The red dot is the participant’s gaze
which is currently residing inside the bounding box of the tablet.
The object detector and the parser were run on the same video and the output was compared to the manual annotations. A comparison is made between an earlier version of the system where the object detector was trained on two objects (tv and furhat) and later parsed to detect the tablet if the bounding box was sufficiently small and the newest version of the system where the object detector was trained to detect all three objects (tv, tablet and furhat). For convenience they are called 2objects and 3objects in the
Video Prediction Duration Accuracy in 2objects and 3objects Video 1 Tablet 12.29-12.52 93.87% 99.68% Video 2 Distracted 17.34-17.59 97.12% 99.34% Video 3 Furhat 2.43-2.53 94.8% 96.73% Video 4 TV, Tablet 12.11-12.14,12.18-12.24 50.00% 98.59% Video 5 Furhat 14.11-16.04 38.9% 69.35% Video 6 TV 4.05-4.08 100% 98.6% Video 7 TV 10.02-10.07,13.13-13.52 93.54% 93.27% Video 8 Distracted 0.04-0.08,1.25-1.34 93.72% 100% Video 9 Tablet,TV 6.22-6.30,10.50-11.05 89.36% 87.97% Video 10 TV 14.45-14.55 99.60% 99.60%
Table 4: Comparison of 2objects detector and 3objects detector
The mean accuracy of the old object detector program is around 85.09%, compared to 94.32% for the new object detector. This shows an increase in accuracy after re-training YOLOv4 with three objects. Significant increases in accuracy is found in Video 4 and 5. In video 4, the participant is standing very close to the tablet. Due to 2objects not being scale-invariant the tablet is mislabeled as a television most of the time. 3objects, having been trained with all target objects, does not have this problem. In video 5, the participant is looking around the Furhat robot a lot. The bounding boxes for the Furhat robot are slightly larger in 3objects compared to 2objects, resulting in 3objects detecting more of the gaze as inside the box rather than outside.
A confusion matrix of the frame-by-frame detection in 3objects shows the strengths and weaknesses of the system, see Figure 26.
The confusion matrix shows that the system overall is quite good at detecting the correct object but the main weakness of the system is the wrongful conclusion classifying the robot as somewhere else instead.
A more thorough accuracy test was made from a manually annotated video, around 18 minutes long. The manual annotations were made frame-by-frame from a randomly selected video from the gaze data set. ELAN, an annotation tool for audio and video recordings, was used when creating the manual annotations [25]. Each frame would get a label, consisting of where the gaze would fall during that frame, which could be one of the following items: The furhat robot, the television screen, the tablet, somewhere else or not applicable. The manual annotations were compared to the automated annotations.
Figure 27 of a text file shows a comparison between the manual annotations and the automated annotations.
Figure 26: Confusion matrix of all frames in the 10 videos. The rows shows
the actual class and the columns shows the predicted class.
Figure 27: Text file of the comparison between the manual and automated
annotations. The begin time and end time are in milliseconds, gaze man is the manual annotations, gaze auto is the automated annotations, index shows the annotations position in the sequence, objects are a list of the objects detected by YOLOv4, and at the end are the begin time and end time translated from
milliseconds to the format hours: minutes : seconds. milliseconds.
more accurate representation of the accuracy of the system compared to the test of the samples from the 10 videos, see Figure 28.
Figure 28: Confusion matrix of all frames in the video. The rows shows the
actual class and the columns shows the predicted class.
Calculated from the confusion matrix, the accuracy for the robot, tablet, television screen and somewhere else were (table 5):
Gaze direction Robot Tablet Screen Somewhere else Accuracy 99.55% 94.45% 95.16% 70.97%
Table 5: Accuracy for the different gaze categories.
The total accuracy of the system calculated from table 5 was 90.03%.
All in all, the object detector and parser achieved a high accuracy for the problem at hand.
5.3 Difference in performance in the object detector due to an increase in training data
The importance of training YOLOv4 with a sufficient training data set size is due to increases in performance when increasing the size of the training data set. As YOLOv4 is a deep learning model, the model will achieve a higher accuracy with an increase in training data up to a certain point. Furthermore, as the object detector is part of the system, a bad performance from the object detector’s part would lead to a low detection rate, thus lowering the accuracy of the system as a whole as the system can’t time the duration of gaze without a detected object. Therefore, it was important to test how the performance of YOLOv4 would increase with the training data set size and if the accuracy would plateau after a certain point.
Figure 29: This graph shows an increase in accuracy as the data size increases
for the object detector.
In Fig. 29, seven versions of YOLOv4 have been trained with different data set sizes, see Table 6.
Training data set size 52 100 148 199 249 298 337 Accuracy 73.12% 76.07% 80.4% 90.45% 87.73% 88.39% 88.97%
Table 6: YOLOv4 with different data set sizes and the corresponding
accu-racy.
As the data set size increased so did the accuracy, up to a certain point. If the data set size hadn’t been big enough for the detector, the graph would have shown a linear growth. However, as the line in the graph have plateaued, it indicates that the data size is big enough and the accuracy won’t increase much more even if the data size is increased.
The final version of the YOLOv4, trained on three objects, has a data size of 337 images with a mAP of 88.97% and a FPS of 75. One of the goals set for the detector was to be able to run in real-time which requires a FPS of at least 25 and the detector have exceeded that greatly, with a FPS of 75. Another goal was to have a mAP equal or greater to the reported mAP for YOLOv4 (62.8% for 80 classes) and the detector has successfully achieved this as well, having a mAP of 88.97%.
6 Discussion
6.1 Discussion of results
The results show that even though the object detector is trained rather than programmed, training a object detector is a non-trivial task as there were several choices to make that greatly affected the accuracy of the detector. The experiment with YOLOv3 and YOLOv4 showed that a decrease in mAP due to an introduction of more complex images (poorly illuminated or cropped) in the data set did not result in a worse object detector as the detector showed a decrease in flickering and false positives and false negatives. It was interesting to note how different the accuracy was on objects detectors, YOLOv3 and YOLOv4, trained on the same data set. Also for our problem, YOLOv4 achieved higher accuracy than YOLOv3, which backs up previous research [17]. Experimenting with two versus three objects when training YOLOv4 proved that even reaching the wrong conclusion (using two objects were clearly the wrong choice) can help with evaluating the system. The final system achieved an accuracy of 94.32% when tested on excerpts of 10 videos and an accuracy of 90.03% when tested on a frame-by-frame manually annotated video, hence it can be considered an accurate tool for gaze direction tracking.
By doing a more thorough accuracy test on a whole video, a regular problem that occurred was the size of the bounding boxes. For certain frames, the size of the bounding box exceeds the boundaries of the detected object greatly, causing the gaze to be detected as directed towards an object when it clearly shouldn’t be. In the future this can be solved by either: 1) Re-training the object detector to fix the size of the bounding boxes or 2) Using edge detection inside the bounding boxes to create a smaller bounding box or contour around the detected object and detect if the gaze is inside the contour instead.
6.2 Sources of error and yet to be implemented solutions
6.2.1 Flickering
A common problem with object detection in videos is flickering. Simply put, flickering is when the object detection algorithm stops detection for a very short time period as it did not find any matching objects. This happens because the video in between frames has a difference in illumination, pixel shifting, noise, rotation for each object which causes the algorithm to detect the object in one frame but not in the other. This difficulty in reducing flickering is further increased due to the videos being in first-person view and sudden head movements cause the object detector to have difficulties with actually detecting the object(s). This can be potentially solved by using, for example, a rolling prediction average. By looping over all frames in the video and then passing all the
frames to the object detector, one would get a list of all predictions from the detector. Getting a label with the largest probability could be done by maintaining a list over the last K defections and computing an average. The label would be added to the frame. The result would reduce the flickering seen in the video between frames.
6.2.2 Removal of frames from gaze position data
When extracting gaze information from the livedata.json file, a problem occurred. In the object detection data extracted from the gaze video, each frame contains data and for 25 frames per second, that means new data is added approximately every 0.04 seconds. In the gaze information data however a lot more data was present. For every frame there could be several gaze positions probably because the eye-tracker saved information more frequently that the object detector did. The solution was to save one point of data for every frame, namely the first one obtained. This could be a source of error due to minuscule eye movements between frames and may cause the center of gaze to sometimes be considered outside the bounding box when it is not and vice versa. This can be solved in the future by matching timestamps instead of matching frames between the two data sets but to do that a new framework will have to be chosen or the old one will have to be reworked thoroughly.
6.2.3 Allowance
When deciding if the center of gaze is inside the bounding box or not, an "allowance" was added to the final calculation. It simply added 40 pixels to the bounding box, making it a little bigger which resulted in the center of gaze being considered inside the box more frequently. In the accuracy testing from samples of the 10 videos, adding allowance increased the accuracy by 2% but it decreased the accuracy in the test of the longer video by 2%. This might be due to that the 10 videos had smaller bounding boxes than the longer video or simply that the sample from the videos didn’t go on long enough to provide a proper accuracy test. However, since the accuracy of the longer video was a better test, allowance was removed from the code as it decreased the total accuracy. Whether this is a source of error or an improvement is debatable. When viewing the object from an angle, the bounding box shape becomes more inaccurate as it either includes a lot of surroundings or cuts of part of the object. For example, the tablet viewed at an angle would cause the bounding box to either include some part of the background or cut off part of the tablet. Neither of these solutions are preferable and in the future, using instance segmentation can eliminate the need for bounding boxes and thus the need for allowance.
6.2.4 Accuracy in the gaze detection
As with all machines and programs, not even the Tobii eye-tracker is 100% accurate [26]. An offset can be small or large but all in all, it will alter the final gaze position recorded. Currently there is no plans to improve this particular problem as this is caused by the eye-tracking device used and is therefore outside the scope of this thesis. There is also a matter of that in some cases, when the participant is wearing the headset, they look around the object instead of directly at it even though they seem to be engaged with it. This causes the data to be recorded as "Somewhere else" even though it quite clearly seems like the participants attention lies on the object. As for an improvement on this particular dilemma, timing the gaze on the focused object is difficult if the gaze does not quite fall on the object. An increase in the bounding boxes size could be a potential solution but that could lead to a problem as well in the opposite direction, the behaviour being annotated as interested in the object instead of distracted. Further testing is needed to properly solve this in an efficient manner.
![Figure 1: Object Detection timeline. Figure from [5].](https://thumb-eu.123doks.com/thumbv2/5dokorg/5502530.143312/10.892.132.757.400.699/figure-object-detection-timeline-figure-from.webp)
![Figure 2: ROC with an AUC of 1, picture taken from [8]](https://thumb-eu.123doks.com/thumbv2/5dokorg/5502530.143312/12.892.300.583.384.644/figure-roc-auc-picture-taken.webp)
![Figure 4 from Poirson et.al, 2016 [15] shows the difference between the two detectors.](https://thumb-eu.123doks.com/thumbv2/5dokorg/5502530.143312/16.892.138.756.168.509/figure-poirson-et-al-shows-difference-detectors.webp)