Driving instruction for persons
with Cerebral Palsy
a retrospective study
of educational problems
Torbjörn Falkmer
oo O') CD 91 N Om
.: 0 >» h uH h 3GB (I)Reprint from Proceedings of the 8th International Conference
on Tranpsort and Mobility for Elderly and Disabled People,
Perth, Western Australia, September 1998, pp. 389-399
TRANSED
Swedish National Bead and
'Transport Research Institute
VTI särtryck 307 - 1998
Driving instruction for persons
with Cerebral Palsy
a retrospective study
of educational problems
Torbjörn Falkmer
Reprint from Proceedings of the 8th International Conference
on Tranpsort and Mobility for Elderly and Disabled People,
Perth, Western Australia, September 1998, pp. 389 399
ngfsff
Road and
DRIVING INSTRUCTION FOR PERSONS WITH.
CEREBRAL PALSY - A RETROSPECTIVE STUDY OF
EDUCATIONAL PROBLEMS
Torbjörn Falkmer
Swedish National Road and Transport Research Institute, VTI, and Division of Preventive and
Social Medicine, Department of Health and Environment, Faculty of Health Sciences, Linköping, Sweden.
Abstract:
The purpose of the study was to examine what happened to learner drivers with cerebral palsy
(CP) (both licensed and unlicensed drivers) regarding the number of lessons given and, if the
instruction was terminated, the point in the educational process where this took place. The study also examined which tasks in the educational process were most frequently executed and whether the instruction followed sequentially a stepwise process.
A total of 4,679 tasks were executed by learner drivers with CP during 2,855 lessons. The tasks were recorded in 17 logbooks for licensed learner drivers and 17 logbooks for unlicensed learner drivers.
The average number of lessons was more than three times higher for the licensed group than the unlicensed group. Nearly half the unlicensed drivers were stopped in task 8 (Driving on minor rural roads). The problem density analysis showed that the licensed group closely followed the curve for the whole group, while the unlicensed group differed mostly in task 8 and task 9 (Driving on roads with a high traffic density). Sequential problem analysis showed that a stepwise repetition process took place before proceeding with the next task.
A suggestion is that the adapted SNRA instruction plan contains key tasks that may be critical for the outcome of driving instruction for learner drivers with CP.
Background
The mobility of disabled people is of vital interest for the individual as well as for society. Swedish law states that the community has an obligation to help disabled persons participate in society on the same level as any other group. This can be achieved partly through increased mobility (Fahlberg and Magnusson 1997). Unlimited and spontaneous mobility is a major issue for the life quality of persons with motor disabilities, just as it is for any others.
Since 1988 (SOU 1994) severely disabled persons (who fulfil certain criteria) have been
offered government subsidies in order to buy and adapt cars. The number of these vehicle grants declined from 5,534 in 1989 (this figure was very high due to an accumulated need) to less than 1,829 in 1995 (Loman 1996), indicating an increasing difficulty for disabled persons to achieve free mobility. However, the number of rejected applications has remained on a stable level at about 42% over these years. This indicates that fewer persons are applying for vehicle grants.
In certain cases, usually among younger unemployed disabled persons, vehicle grants are linked with driving instruction. However, this is a very rare event and the amount of money spent on driving instruction is less than 1% of the sum spent on buying and adapting cars
(Peters 1998).
At about the same time as vehicle grants were introduced, vehicle adaptation technology reached a peak with joystick controls and high power servos operated by a miniature steering wheel. The question arises as to whether the decrease in vehicle grants (which in the vast majority of cases require a driving license) might be due to educational problems among disabled persons with cognitive and perceptual disorders rather than arising from technical problems.
Since the visual perceptual system is unquestionably the most frequently used system in the driving process (Byrnes 1962; Cole 1972, Sivak 1996), it is of interest to identify a target group for this study in which one might expect to find a broad variety of visual perceptual and cognitive problems and yet a substantial number of potential drivers. Cerebral Palsy (CP) is a diagnosis which fits these requirements well. The assumption is that the educational process is not designed to meet the challenge from disabilities such as CP, which can be accompanied by cognitive and/or visual perceptual deficits.
Two centres dominate the Swedish market for driving instruction with adapted cars, AmuGruppen Kävlinge and AmuGruppen Hedemora. These are geographically located to serve half the Swedish population each, regarding both distance and population density. Nearly all potential learner drivers with CP who are in need of car adaptations are referred to these centres, which also provide certain assistance to learner drivers with CP who have little or no need of car adaptations in order to start their driving education. It may be assumed that it is possible to cover half the potential learner drivers with CP by studying the logbooks at one of these centres - AmuGruppen Kävlinge.
Purpose of the study
The purpose of the study was to examine what happened to learner drivers with CP (both licensed and unlicensed) regarding the number of lessons given and, if the instruction was terminated, the point in the educational process where this took place. The study also examined which tasks in the educational process were mostly frequently executed and whether the instruction followed sequentially the same stepwise process as described in the instruction plan of the Swedish National Road Administration SNRA (Vägverket 1996).
Driving instruction plan
Disregarding the division of the plan by SNRA into a theoretical and a practical part since driving instructors record the various tasks on the basic assumption that the two parts are integrated, the instruction plan can be separated into three major parts (as is done by AmuGruppen Kävlinge):
Vehicle knowledge and manoeuvring - tasks 1 8 Driving posture
Vehicle control
Braking and gear shifting Manoeuvring on uphill slopes Reversing and precision driving
Summary of tasks 1-5, motor performance and coordination
Driving on streets with low traffic density Driving on minor rural roads
m
g
w
e
w
w
e
a
* Driving in traffic - tasks 9-13
9. Driving on roads with high traffic density 10. Turning and parking
11. Speed control and lane positioning 12. Driving on commands and navigation
13. Highly qualified driving in dense traffic - tasks 1-12 * Driving under special conditions - tasks 14-20
14. Merging on ramps/speed adjustment 15. Highway driving
16. Overtaking 17. Driving in qualified and varied rural traffic 18. Driving in darkness
19. Driving on wet and slippery surface/low friction
20. Driving in special situations (e.g. road works, animals on the road, fog/rain/snowstorms,
emergency vehicles)
Materials and methods
Educational logbooks for the years 1974 - 1994, from one of the two educational centres in
Sweden for disabled drivers, AmuGruppen Kävlinge, were surveyed and analysed. Thirty-four
logbooks, 17 for licensed learner drivers and 17 for unlicensed learner drivers, were randomly
chosen with the inclusion criteria: CP in any form and a clear starting point for driving instruction. All other diagnoses were excluded and also those under pretest periods for
persons with CP. The 34 logbooks represent 44% of logbooks for the licensed group and 57% of logbooks for the unlicensed group for the years 1974 - 1994. Based on the assumption that the difference between the groups was equal to 1 standard deviation in the null hypothesis, the sample of 17 logbooks from each group generated a more than 80% chance of detecting differences at a significance level of 5% (i.e. the power of the study).
A total of 4,679 tasks executed by the learner driver during 2,855 lessons (1.6 tasks per lesson
on average), defined by the adapted SNRA instruction plan (Vägverket 1996), were identified in the logbooks at AmuGruppen Kävlinge driving school and scrutinized with regard to the following topics:
1. The average number of driving lessons required in order to become a licensed driver or the average number of driving lessons before instruction was terminated.
2. The highest numbered task, defined by the adapted SNRA instruction plan, at which instruction was terminated.
3. An analysis was made of the point in the adapted SNRA instruction plan where the
problem occurred. Problem density analysis. The results were divided into two groups - those who became a licensed driver and those whose driving instruction was terminated
(unlicensed).
4. An analysis was made of the sequential order in which the adapted SNRA instruction plan was followed. Sequential problem analysis. The results were divided into two groups - those who became a licensed driver and those whose driving instruction was terminated
(unlicensed). Mode values, one from each group, were obtained to show sequential differences between the two groups.
Results:
A total of 4,679 tasks, defined by the adapted SNRA instruction plan, were executed by the learner drivers during 2,855 lessons (1.6 tasks per lesson on average). The tasks were defined in the logbooks of AmuGruppen Kävlinge driving school for 34 learner drivers with CP.
Number Of lessons: The average number of lessons for the whole group as well as for the
two sub groups (licensed and unlicensed) is presented in Figure 1:
180
160-
_
140
-Mean []number 120
-of
lessons 100
- 80-60 - __40 -
U
20-N:
34
17
1'7
AII Licensed Unlicensed
Figure 1: The average number of lessons for the whole group (all) as well as for the two sub-groups (licensed and unlicensed). The number of lessons analysed was 2,855.
95% confidence intervals for the mean values are presented.
Mean value for the whole group is 85 (95% c.i. = 62 107) lessons, for the licensed group 128 (95% c.i. = 95 161) lessons and the unlicensed group 41 (95% c.i. = 29 - 54) lessons.
The average number of lessons is more than three times higher for the licensed group than the unlicensed group. (p<0.001).
Termination point: The highest numbered task, defined by the adapted SNRA instruction
plan, at which the driving instruction was terminated for unlicensed learner drivers, (n=l7), ispresented in Figure 2:
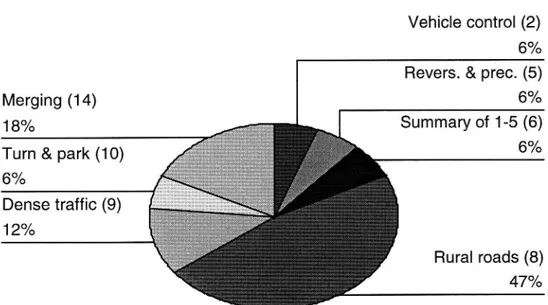
Vehicle control (2)
6%
Revers. & prec. (5)
Merging (14) 6%
18% Summary of 1-5 (6)
Turn & park (10) 6%
6°/o
Dense traffic (9)
12%
Rural roads (8) 47%
Figure 2: The highest numbered task, defined by the adapted SNRA instruction plan, at which the instruction was terminated, for unlicensed learner drivers, (n: 17). The number indicates the stage at which the instruction process was terminated.
Nearly half the unlicensed drivers were stopped in task 8 (Driving on minor rural roads). 65% were stopped in the first major part "Vehicle knowledge and manoeuvring", Tasks 1-8.
Problem density analysis: Problem density analysis is presented in Figure 3.
40
Median
number 4of exe-
'.':
cuted
; '\
tasks 3° '
lf:
ALL UCENSED UNUCENSED SN RA-taskFigure 3: Median number of executed tasks 1-20, as defined by the adapted SNRA instruction plan, for the whole group (all) as well as the two subgroups (licensed and unlicensed learner
drivers).
The licensed group closely followed the curve for the whole group, while the unlicensed group differed mostly in task 8 (Driving on minor rural roads), task 9 (Driving on roads with high traffic density) and tasks 12 - 20, the latter due to driving instruction being terminated. The licensed group executed mostly task number 9 (Driving on roads with high traffic
density), task 13 (Highly qualified driving in dense traffic - tasks 1-12) and task 17 (Driving in qualified and varied rural traffic).
$$$!"
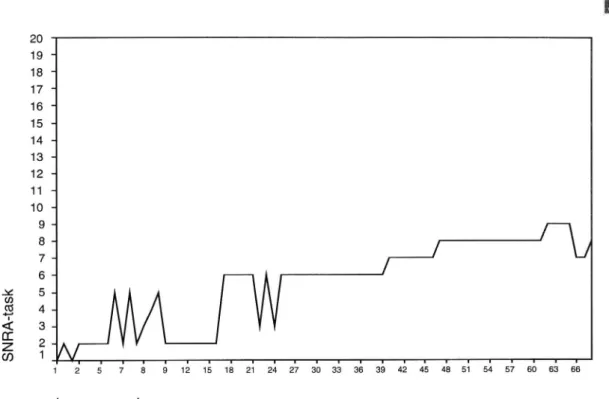
Problem sequential analysis: Two mode examples of the sequence in which the tasks
were performed according to the adapted SNRA instruction plan are presented in Figure 4 and Figure 5, with one example from each group (licensed and unlicensed learner drivers).
20 19 '
18-
H
17 " 16 "15-14-
H
13- 12- 11- 10- 9- 8- 7-6... 5 - 4- 3- 2-1S N RA -t as k I I I I I I I I I I I I I I I l I I I I I I I I 1 3 6 9 13 16 18 21 25 27 30 32 33 36 41 44 47 49 51 53 56 59 61 64 67 70 Lesson number
Figure 4: Sequential educational pattern for a mode value person (20 year old man with CP who executed 126 tasks during 70 lessons occupying an instruction period of eight weeks) in the licensed learner driver group. The dependent variable on the Y-axis consists of tasks 1-20, as defined by the adapted SNRA instruction plan. The independent variable on the X axis is the lesson number in sequential order.
The figure indicates a stepwise repetition process before proceeding with the next task (1-20, as defined by the adapted SNRA instruction plan).
20 19-18" 17' 16 15- 14- 13-12 11-10
9-.-
ft
7" / / 6-x5-3 4
<i:3-Dz:
2-(I) 1 'I I I I I I I I I l l I I l I l l l l I I I I I 1 2 5 7 8 9 12 15 18 21 24 27 30 33 36 39 42 45 48 51 54 57 60 63 66 Lesson numberFigure 5: Sequential educational pattern for a mode value person (19-year-old woman with CP who executed 75 tasks during 68 lessons occupying an instruction period of three weeks) in the unlicensed learner drivers group. The dependent variable on the Y-axis consists of tasks
1-20, as defined by the adapted SNRA instruction plan. The independent variable on the X-axis is the lesson number in sequential order.
The figure indicates a stepwise repetition process before proceeding With the next task (1-20, as defined by the adapted SNRA instruction plan). In this example, the process reaches its highest level in task 9 (Driving on roads with high traffic density).
Discussion:
As expected, the average number of lessons was significantly higher for the licensed group
(128) than the unlicensed group (41). The average number of lessons for the whole Swedish
population of learner drivers is 48 hours, of which 11 were given by a driving school
(Gregersen 1997).
A comparison of 48 hours with the average number of lessons for the licensed group (128) of
learner drivers with CP, as well as the unlicensed group (41), indicates difficulties in
identifying those not suitable for driving from the others, based on the educational tools given. The highest numbered task, defined by the adapted SNRA instruction plan, at which the instruction was terminated showed that nearly half the unlicensed drivers were stopped while executing task 8 (Driving on minor rural roads). Sixty five per cent were stopped during "Vehicle knowledge and manoeuvring tasks 1 8". This indicates that problems for unlicensed learner drivers are exposed in the first part of the driving instruction "Vehicle knowledge and manoeuvring". This is shown in Figure 3, where the two groups follow each other fairly well until task 9 (Driving on roads with a high traffic density), to which the
unlicensed group was not exposed to the same extent as the licensed group. One interpretation is that there may be a threshold in complexity level of the educational process at this point (task 8 - Driving on minor rural roads) that re ects the complex of problems for learner drivers with disabilities such as CP, who may have cognitive and/or visual perceptual deficits. For the group of licensed learner drivers, the main problems occurred in denser traffic during multi task performance, i.e. executing tasks requiring simultaneous capacity, which was expected. Figure 3 shows high educational density in the part "Driving in traffic - tasks 9-13" especially task 9 (Driving on roads with a high traffic density) and task 13 (Highly qualified driving in dense traffic - tasks 1 12). These tasks include sub-tasks such as speed adjustments, positioning and turning at intersections, negotiating roundabouts, driving on one-way streets, situation awareness and risk estimation, unprotected road users, zebra crossings and attention to emergency vehicles. All this must be performed in dense traffic situations, which requires the ability to perform dual tasks simultaneously.
Regarding the sequential analysis, much repetition was required both for licensed and unlicensed drivers. There appears to be a stepwise repetition process before proceeding with the next task (1-20, as defined by the adapted SNRA instruction plan). A suggestion based on
Figures 4 and 5 is that task 2 (Vehicle control), task 8 (Driving on minor rural roads), task 9
(Driving on roads with a high traffic density) and task 13 (Highly qualified driving in dense traffic - tasks 1 12) are key tasks that can be critical for the outcome of driving instruction for learner drivers with CP.
Conclusions:
The mapping of educational driving problems among learner drivers with CP presented in this report is part of a longitudinal study conducted over a period of three years. The long-term aim is to develop new and better methods to enable persons with CP to obtain a driving licence. A further aim is to provide perceptual, cognitive and real traffic environment tests to detect at an early stage those who are unable to meet the requirements in order to become a driver. Knowledge of educational process problems, here viewed in a retrospective approach, facilitates development of test batteries for learner drivers with CP. The results from this study will form the basis for further work in this field.
In a broader sense, the study will also make it easier for authorities to enhance the mobility of
disabled persons by knowing, at an earlier stage in the educational process, whether the
disabled person will be able to become a driver or will require help from the community in the future in order to achieve mobility.
Acknowledgements:
The Swedish Inheritance Fund, RBU, Karin Paulsson, Sunnerdahls Handikappfond, Benny Nielsen, AmuGruppen Kävlinge, Björn Peters & Nils Petter Gregersen, VTI
References:
Byrnes, V. A. (1962). Visual factors in automobile driving. Ophthalm Tr. Am. Soc. 60: 60 70.
Cole, B. L. (1972). Visual aspects of road engineering. Sixth Conference of the Australian
Road Research Boards, Canberra, Australian Road Research Boards.
Fahlberg, G. and N. Magnusson (1997). Socialtjänstlagarna : bakgrund och tillämpning.
Stockholm, Liber.
Gregersen, N. P. (1997). Utvärdering av 16 årsgräns för övningskörning. Delrapport 1. Linköping, VTI.
Loman, V. (1996). Redovisning av regeringsuppdrag avseende bilstöd till handikappade.
Stockholm, RFV.
Peters, B. (1998). Bilförare med traumatiska ryggmärgsskador en kunskapsöversikt. Linköping, VTI.
Sivak, M. (1996). The information that drivers use: is it indeed 90% visual? Perception 25:
108 1- 1089.
SOU (1994). Rätten till ratten - reformerat Bilstöd, slutbetänkande av bilstödsutredningen 1993, Fritzes.
Vägverket (1996). Vägverkets författningssamling, Vägverkets föreskrifter om kursplaner, behörighet B. Borlänge, Vägverket.