ISSN 0347-6049
f V'I/meddelande
444 2 1985
Background noise estimation for tire/road
noise measurements using the trailer method
by
Jerzy A. Efsmont
Technical University of Gdansk, Poland (Presently at Drittes Physikalisches Institut, University of Gottingen, West Germany) and
UIf Sandberg
Swedish Road and Traffic Research Institute, Linkoping, Sweden
w Wig-och Trafilr- Statens vag- och trafikinstitut (VTI) * 581 01 Linkoping II StIt tat Swedish Road and Traffic Research Institute * S-581 01 Linkoping Sweden
[SS/ll 0347-6049
V meddelande
441A
1935
Background noise estimation for tire/road
noise measurements using the trailer method
by
Jerzy A. Ejsmont
Technical University of Gdansk, Poland
(Presently at Drittes Physikalisches lnstitut,
University of Go"ttingen, West Germanyl
and
Ulf Sandberg
Swedish Road and Traf c Research Institute,
Linko'ping, Sweden
VTI, Linko'ping 7985
I? Statens va'g- och trafikinstitut (VT!) 0 581 0 1 Linko'ping
CONTENTS ACKNOWLEDGEMENT SUMMARY SAMMANFATTNING I. INTRODUCTION NOISE 2. SOURCES OF TRAILER BACKGROUND
3. POSSIBLE BACKGROUND NOISE MEASURING TECHNIQUES
4. RESULTS OF BACKGROUND NOISE MEASUREMENTS ON THE "UG" TRAILER
5. RESULTS OF BACKGROUND NOISE MEASUREMENTS ON THE "TIRESONIC Mk2" TRAILER
5.1 Measurements by the lifted tire principle
5.2 Measurements by the quiet tire/road principle
5.3 Combination of the results from the two types of
measurement
5.4 Minimum signal-to-noise ratio for some typical cases
6.
INFLUENCE OF BACKGROUND NOISE ON THE
RELATION BETWEEN TRAILER AND COAST-BY
RESULTS
6.1 General assumptions
6.2 Computer simulation to determine the influence of background noise on the correlation coefficient for trailer and coast-by measurements
6.3 The effect on measured results of subtracting a
hypothetical background noise
VTI MEDDELANDE 441A
Sid
III
19 20
6.4 Computer simulation to determine the influence of background noise on the regression coefficients for
trailer and coast-by measurements
6.5 The effect of background noise on measured regression coefficients
7 RECOMMENDATIONS 8 CONCLUSIONS
REFERENCES
V'I'I MEDDELANDE 441A
23
25
29 30 32
ACKNOWLEDGEMENT
The authors wish to express their gratitude to Prof. D. Ronneberger,
Drittes Physikalisches Institut, University of Gottingen, who kindly has
permitted the use, in this report, of some noise measurements performed
by a test trailer in the possession of the institute as well as some other
material in connection with this trailer.
Supported by a 10 month scholarship the main author (Dr Ejsmont)
presently is working as a guest researcher at the above-mentioned
institute.
Special thanks is also extended to Volvo Truck Corporation (Mr E. Krall
and his colleagues) who permitted the use of their special test track at Torslanda, Gothenburg.
Background noise estimation for tire/road noise measurements using the trailer method
by Jerzy A. Ejsmont
Technical University of Gdansk
ul. Majakowskiego 11/12
80 952 Gdansk, Poland and Ulf Sandberg
Swedish Road and Traffic Research Institute
5-581 01 Linkoping, Sweden
SUMMARY
In line with increased awareness of the importance of tire/road noise, the demands for a standardized method for tire/road noise measurement have become urgent. In response to that, the Group of rapporteurs on
brakes and running gear (GRRF) within the ECE has established an
ad-hoc group to deal with this topic.
Three methods have been seriously considered in this work; coast-by, laboratory drum and trailer. It is hoped that all three methods will be possible to use, although in different situations. Many features of the trailer method are very attractive; however, one serious problem is the disturbances by background noise and especially to quantify this
ground noise. This report presents the basic methods for trailer back-ground noise estimation together with an analysis of such measurements
performed on two trailers.
As mentioned, the task of measuring background noise on trailers intended for tire/road noise tests is very difficult. In general, only an
upper limit to the true background noise can be obtained.
There are two major methods. One is the lifted or removed wheel principle where the measuring wheel is raised from its normal position,
after which the "desired" noise disappears and the background remains.
The other method is the quiet tire/road combination principle where the most quiet tire and the most quiet road surface are used even if they are of extreme and abnormal construction. When the trailer is run with such
a tire/road combination (the supporting wheels are run on a normal
II
surface) the measured noise constitutes an upper limit to the background noise, as some noise of the measuring wheel inevitably remains.
By using the principle of removed measuring wheel it has been measured and calculated that the signal-to-noise ratio in the trailer of the University of Gottingen is 13-18 dB(A) at 60 km/h, depending on the microphone position. At 120 km/h the ratio decreases down to 7 dB(A). The compared measuring tire then is a smooth, non-patterned tire.
By using the principle of lifted measuring wheel and extra outer supporting wheels, it has been measured and calculated that the
signal-to-noise ratio in the trailer of the Technical University of Gdansk is at
least 2-14 dB at 70 km/h, depending on frequency (above 200 Hz). The
compared tire, again, is the smooth, non-patterned tire.
By using the principle of quiet tire/road combination _a_r_1_d_ the lifted tire principle, the same trailer was found to have a signal-to-noise ratio of at
least 3-11 dB(A), depending on the chosen tire/road combination to which
the background noise is compared and the microphone position. The
figures for a summer-tread tire were found to be 9-11 dB(A).
A theoretical computer simulation showed that one effect of background
noise would be, normally, to decrease the correlation between trailer and
coast-by measurements. Some tests concerning measured data for the Polish trailer showed that the subtraction of background noise would have an effect contrary to the expected. Thus, it is concluded that background noise is not significant in this case.
Similarly, it is expected that the existance of background noise in trailer measurements would decrease the regression slope constant (trailer
versus coast-by measured values) to below 1.00. As this does not happen
it is again concluded that background noise seems to be negligible and
thus lower than indicated by the special tests described above.
III
Skattning av bakgrundsbuller vid dack/véigbanebullermatning med hjalp av matvagnsmetoden
av Jerzy A. Ejsmont
Tekniska hogskolan i Gdansk
ul. Majakowskiego 11/12
80-952 Gdansk, Polen och Ulf Sandberg
Statens vag- och tra kinstitut 581 01 Linkoping
SAM MANFATTNING
Med anledning av en okad medvetenhet om vikten av att bekampa déck/vagbanebuller har efterfragan pé en standardiserad matmetod for
denna typ av tra kbuller okat. Som svar pa detta har ECE:s
rapportor-grupp for bromsar och hjulstall (GRRF) inrattat en ad-hoc-rapportor-grupp for att arbeta med denna fraga (ECE = United Nations' Economic Eommission
for Europe).
Tre metoder har overvagts i detta arbete: forbifart, laboratorietrumma och m'a'tvagn. Det 31* en forhoppning att alla tre metoderna ska11 kunna anvéindas, fastéin 1 olika sammanhang. Manga egenskaper hos
matvagns-metoden ar mycket tilltalande; emellertid finns ett stort problem och
det ar stdrningar frén o'o'nskat buller - s k bakgrundsbuller. Framfor allt firms svarigheter att kvantifiera detta bakgrundsbuller. Detta
meddelan-de presenterar mojliga metomeddelan-der for att uppskatta bakgrundsbullret vid
anvandning av méitvagnsmetoden tillsammans med en analys av experi-ment som utforts med tva matvagnar.
Sésom néimnts ovan éir det svart att méta bakgrundsbullret. I sjalva
verket éir det vanligen endast mojligt att fa reda pa en ovre gréins for
detta.
Darvid kan man utnyttja i huvudsak tva olika principer. Den ena utgor
"det upplyfta eller borttagna hjulets princip", dar mathjulet lyfts upp en bit over végbanan (eller tas bort helt) efter vilket det frén matobjektet
alstrade 1judet forsvinner helt och bakgrundsbu ret kvarstar. Den andra
utgor "den tysta dack/véig-principen", dar man anvéinder sasom matdack
IV
det tystaste tillg angliga dacket och sésom méityta den "tystaste" till gé mgliga vagytan. Det kan innebéira att hogst speciella déick eller véigytor anvands. Néir méitvagnen kors med utnyttjande av en sédan déck/véig-kombination (ovriga hjul hos ekipaget éir de normala och rullar pa en "normal" végyta) uppméits ett buller som utgor en 6vre gréins hos bakgrundsbullret eftersom en del av bullret frén mathjulet oundvikligen
kvarstar.
Méitningar med hjalp av det borttagna hjulets princip har visat att signal-brus forhéllandet hos en méitvagn frén Universitetet i Gottingen 5r 13-18
dB(A) vid 60 km/h, beroende av var mikrofonen air placerad. Vid 120
km/h minskar detta till 7 dB(A). Déirvid jéimfors bakgrundsbullret med
bull ret frén ett omonstrat, slétt déick pa en slat vagyta.
Med utnyttjande av principen lyft mathjul samt extra yttre stodhjul
-kunde signal-brus-forhallandet for en matvagn frén Tekniska hogskolan i
Gdansk bestéimmas till minst 2-14 dB vid 70 km/h, beroende pa
frekven-sen (over 200 Hz). Aven i detta fall grundade sig jamforelfrekven-sen pa ett sléitt, omonstrat dack pa en slat véigyta.
Genom att kombinera resultaten frén méitningar med metoderna "tyst déick/véig" - och "upplyft mathjul" befanns samma matvagn ha ett
signal-brus-avstand pa 3-11 dB(A), beroende pa mikrofonposition och med vilken
déick/végkombination man jamforde bakgrundsbu ret. Nair ett vanligt sommardéick anvéindes som jéimforelse var signal-brus avstandet 9-11
dB(A).
En teoretisk datorsimulering visade att en effekt av bakgrundsbullret ar, normalt, att minska korrelationen mellan matvagns och f
orbifartsméit-ningar. Négra tester utnyttjande data for den polska matvagnen visade
att en subtraktion av det forvéintade bakgrundsbullret hade en effekt motsatt den véintade. Det tolkas som att bakgrundsbullret i sjéilva verket ar fo'rsumbart i det aktuella fallet.
Likasa borde existensen av bakgrundsbullret vid méitvagnsmetoden min-ska lutningskoef cienten i regressionen (méitvagns- jamforda med forbi-fartsméitvéirden). Eftersom detta inte intraffar dras aterigen slutsatsen
att bakgrundsbullret verkar vara farsumbart och séledes léigre an vad resultaten av specialméitningarna enligt ovan indikerar.
1. INTRODUCTION
In line with increased awareness of the importance of tire/road noise, the demands for a standardized method for tire/road noise measurement have become urgent. In response to that, the Group of rapporteurs on
brakes and running gear (GRRF) within the ECE has established an ad hoc group to deal with this topic.
Three methods have been seriously considered in this work:
1. Coast-by method. The test vehicle coasts-by a microphone which is placed 1.2 m above the road level 7.5 m from the center line of the vehicle travel (engine switched-off). Using time constant "F" and fre-quency weighting "A" the maximum sound level during the coast-by is
recorded. It is recommended that also the frequency spectrum be
recorded at maximum sound level. At least five runs should be averaged. This classical method is judged to be the most relevant when the emission to the external environment is considered but it is also the most time consuming and weather dependent.
2. Trailer method. Numerous institutions and industries have special trailers on which the test tire (usually one) is mounted and close to which a microphone is fixed. In our case we have standardized the microphone position to 0.2 m outside the tire sidewall and 0.1 m above the road level
in the vertical axle plane. At least two recordings of 4 5 length should be averaged. This method can give very fast and accurate measurements
but lacks in representativity concerning external environment.
3. Laboratory drum method. Maybe even more popular is to use an indoor drum which simulates the road. The microphone location should be the same as in the trailer method.
The hope is that all three methods will turn out to be acceptable, which would make the maximum number of users happy as they can go on to use their existing facilities. Then, correction factors would be applied to give compatible measurement values. Of course, the respective methods will probably have different applications which feature the advantages of
each; for instance the drum method will be most suitable for R 6: D work and for extensive and fast surveys, and the coast-by method will be most
suitable when the highest precision is needed for environmental impact
assessment.
The trailer method for tire/road noise measurements proposed by the
GRRF ad-hoc group is based on the assumption that the signal to noise
ratio during tests is higher than 10 dB. However, if the ratio is within a range of 10 to 15 dB then certain corrections of the results are
necessary. It has turned out to be a serious difficulty to measure the
background noise for such assessments and this report therefore presents experiments and results concerning this problem.
2. SOURCES OF TRAILER BACKGROUND NOISE
The background noise during trailer measurements is caused by several
sources. As main components could be considered:
0 Air-flow noise, dependent on vehicle and wind speeds. For a trailer without any enclosure around the microphone(s) and measuring wheel this noise is mainly generated due to the air-flow around the
microPhone(s). For a trailer with an enclosure its lower edge could
itself be responsible for extra noise.
0 Noise generated by supporting wheels. If the trailer is equipped with extra wheels to make it stable or to support the enclosure (e.g. the trailers owned by the Technical University of Gdansk (TUG) and the
University of Gottingen (UG)) they could contribute to background
noise depending on their distance to microphone(s) and wind screens.
0 Vibration-induced noise produced by the trailer body due to road and
tire excitation.
0 Noise generated by the suspension of the trailer.
0 Noise produced by the bearings of the measuring wheel.
0 Noise generated by the towing vehicle (engine, exhaust, tires).
0 Extra noise of various origin (e.g. incidental contact between the enclosure and the road surface, passing vehicles, horns and so on). In
case of such noises certain actions should be taken by the instrument
operator.
Most of the noise components mentioned above are mainly dependent on the speed, so it seems to be reasonable to estimate the background noise as a function of the trailer speed.
3. POSSIBLE BACKGROUND NOISE MEASURING TECHNIQUES
Direct measurement of the total background noise is usually very
difficult and in most cases nearly impossible. For background noise investigation, one basic procedure could be the same as for the ordinary tire/road noise measurements with the exception that the measuring tire must not be in contact with the road surface. In practice this means that the measuring wheel is not rotating, and so bearing noise and parts of
vibration and suspension noises are, unfortunately, eliminated. Even such
simplified tests are sometimes difficult to perform. Everything depends
on the trailer construction.
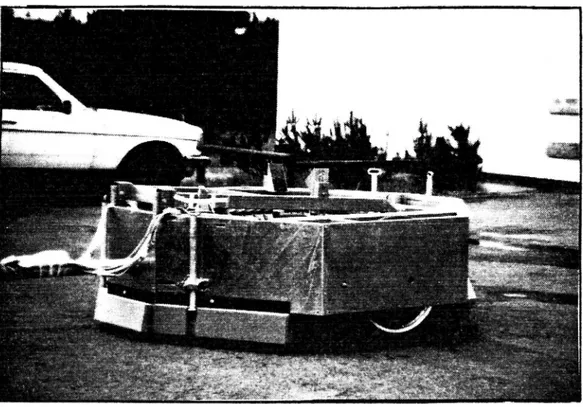
For example the trailer used in Gottingen (fig. 1-2) has supporting Wheels
connected to the main frame so that it is possible to take out or lift the
measuring wheel; something that will not disturb the stability. The towing hook is designed to carry not only the horizontal but also the vertical forces, so the trailer remains supported at three points.
Figure l The trailer used at the University of Gottingen, West Germany
Figure 2 The inner part of the German trailer. Three of the 16 micr0phones can be seen around the measuring tire in the middle
Figure 3 The trailer "Tiresonic Mk2" built at the Technical University
of Gdansk, Poland
In case of the trailer built in Gdansk (fig. 3) the towing hook carries only horizontal forces; thus it is impossible to take out the measuring wheel without some extra arrangements for stability as the wheel itself is the
third supporting point. Such a construction is practical because the
trailer can be disconnected from the towing vehicle and still remains stable but it makes background noise measurements rather complicated. One Way to enable background noise measurements by lifting or remov ing the measuring wheel, is then to equip the trailer with two supporting wheels at the side of the measuring wheel, outside the enclosure. See fig. 7 on page 10.
As mentioned earlier, a serious disadvantage with this method of lifting the measuring wheel is that bearing noise and parts of suspension noise are not generated. In the case of w outer supporting wheels there is
instead a new noise component - that from the tire/road noise of the
extra supporting wheels.
The best way atpresent seems to be to drive the trailer in the normal measuring mode over an exceptionally quiet road surface and using an exceptionally quiet measuring tire. If this arrangement gives a tire/road noise that is significantly lower than for the normal tire/road
combina-tion then an upper limit of the real background noise can be estimated. In fact, the background noise will always be overestimated in this way
because it contains both the true background noise (as in "real" measure-ments) and the remaining noise of the very quiet tire/road combination.
Results presented in this report are based on tests performed by the
Technical University of Gdar iSk (TUG), Poland, (using the lifted wheel principle), the Swedish Road and Traffic Research Institute (VTI) with the "Tiresonic Mk2" trailer (using the quiet tire/road combination principle) and the University of Gottingen (UG), West Germany with
their trailer (using the removed wheel principle).
4. RESULTS OF BACKGROUND NOISE MEASUREMENTS ON THE "UG" TRAILER
During the background noise measurements the trailer was equipped with 16 microphones positioned circularly around the center of the tire/road contact patch, however, the measuring wheel was removed from the trailer. The tests were performed on asphalt concrete and cement concrete surfaces on the Contidrom (Continental Road Test Facility),
ref. 1.
The UG (University of Gottingen) trailer has two supporting wheels
which are used during normal measurements and which can support the trailer together with the towing hook even when the measuring wheel is removed. The supporting wheels are covered with enclosures to separate the microphones from their rolling noise. It must be mentioned that the
distance from a supporting wheel to the nearest microphone is similar to the distance between microphones and the measured tire, so the screen-ing is extremely important.
The results obtained during measurements were calculated as A-weight
-12 W. It was observed that the background
ed sound power levels re. 10
noise power levels measured by microphones positioned on both sides of
the measuring wheel (90° and 270°) were 5 to 7 dB(A) higher than for the
position in front (0°) and behind (180°) the wheel. It is probably caused by noise generated by the supporting wheels. Figure it shows the signal-to-noise ratio as a function of microphone location at speeds 40, 60 and
120 km/h on an asphalt concrete surface and when using a non-patterned smooth tire. It was the most quiet tire tested. Similar results were
obtained for a cement concrete surface.
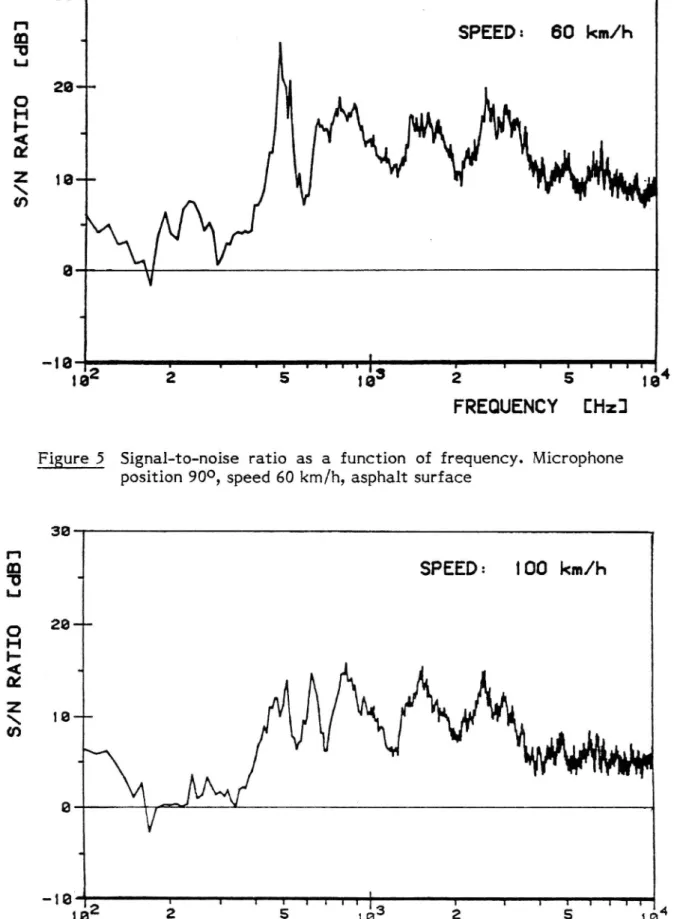
Figures 5 and 6 show the signal-to noise ratio as a function of frequency
for microphone positioned at the side of the tire. In both figures it is possible to separate two areas of different 5/ N ratios. Below #00 Hz the signal-to-noise ratio is very low (0 - 5 dB) and above 400 Hz it increases to 10 - 15 dB. Most probably in the range of low frequencies the high background noise is caused by flow of air inside the chamber and by
structural vibrations. For higher frequencies the noise is produced mainly by the supporting wheels.
It should be noted, once more, that by this method the noise from the
bearings and the suspension of the test wheel is not measured. In this case the background noise might in reality be somewhat higher. How
ever, when tire/road noise is measured, generally, these types of noises
are considered as negligible.
25
n
SURFACE: ASPHALT
2
SPEED: - - 40 km/h
5
60 km/h
3
120 km/h
0 20"
H tn-4 m q 23
15--
10--l l5
i
l
T
o
45
so
135
180
MICROPHONE POSITION
E
3
Figure 1+ Influence of microphone position on signal to-noise ratio in the"worst" case tested. Calculated on the basis of A-weighted power levels
Microphone positions:
0° = in front of the tire 180° = behind the tire
[d
B]
S/
N
RA
TI
O
[d
B]
S/
N
RA
TI
O
36.
SPEED: so km/h
20-"-10-"-°
v
r r 1 I 1' 1 T 1 1 1 1 1 r:22
2
s
:53
2
s
to
FREQUENCY
CH2]
Figure 5 Signal to-noise ratio as a function of frequency. Microphone
position 90°, speed 60 km/h, asphalt surface
3B
.
SPEED:
'00 km/h
29m- 18--1 1 1 T 1 1 ITTL 1 1 1 1 1 1 1 1182
2
5
183
2
5
18
Figure 6 Signal to-noise ratio as a function of frequency. Microphone
position 90°, speed 100 km/h, asphalt surface
lO
5. RESULTS OF BACKGROUND NOISE MEASUREMENTS ON THE "TIRESONIC Mk 2" TRAILER
5.1 Measurements by the lifted tire principle
The trailer manufactured at TUG is not suitable for background noise tests by the lifted or removed tire principle as the measuring wheel is
necessary to support the trailer and can not be removed without a
special adaptation. To make such measurements possible, two additional wheels located outside the enclosure were fixed, see fig. 7.
._yuy', .1. L i _ ,. " 9' «J, _ 49%; ;~ ' 45.5 ' 3'." ' . . " ' ' >: .;. 1'
Figure 7 The "Tiresonic Mk 2" trailer prepared for background noise measurements by fitting two extra wheels outside of the enclosure and lifting the measuring wheel in the middle.
The wheels were adjusted to give a clearance of 20 mm between the measuring wheel and the road surface. The distance from the microphone to the nearest extra wheel was around twice the distance from the microphone to the measuring tire. There is an important difference in comparison to the UG trailer since during normal measurements the extra wheels do not contribute to the background noise; nevertheless their noise was inevitably added to the background in this test. In case of the UG trailer the supporting wheels are present close to the measuring
tire all the time.
ii
The normally used supporting wheels of the "Tiresonic MKZ" trailer are positioned far from the microphone (6.5 and 8 times the distance from the microphone to the measured tire) so even if the noise generated by them would be similar to the noise generated by the measuring wheel, and the screening performed by the enclosure would be negligible, the S/N ratio considering only the tire sources still would be around 15 dB. Such an estimation is rather on the pessimistic side as the supporting wheels are very narrow, have big diameter, are inflated and low-loaded so they should be relatively quiet (ref. 2).
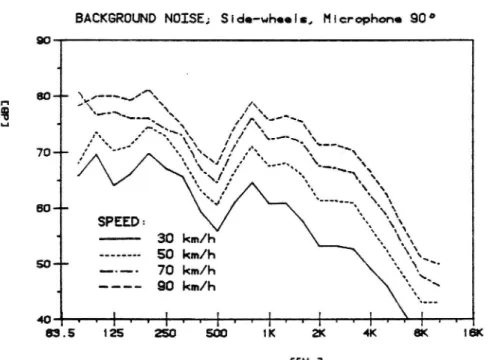
The spectra of background noise measured with the extra side-wheels are shown in fig. 8. The A-weighted sound levels for the speeds 30, 50, 70 and 90 km/h are as follows: 70.2, 76.7, 81.6, 85.0 dB(A).
BACKGROUND NOISE,- Slde-uheols, Microphone 90°
[d
8]
{CHZJ
Figure 8 Spectra of background noise measured by the lifted wheel
principle and using outer suppOrting wheels. .
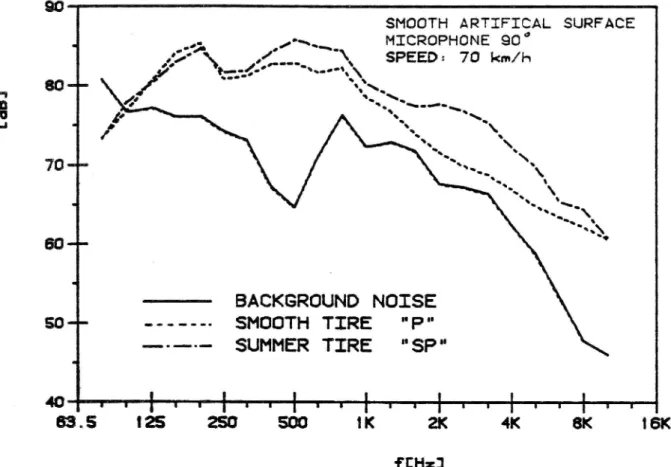
In figures 9 and 10 the S/N ratio for a smooth tire and a common, commercial tire are presented. The characteristics of the S/N ratio
curve presented in figure 10 are quite similar to the curve in fig. 5;
however, observe that in fig. 5 a narrowband power spectrum is presented contrary to the third-octave-band sound pressure levels in fig.
10.
[d
B]
12
SMOOTH ARTIFICAL SURFACE
.
'
,.
,«N-
MICROPHONE 90"
\ SPEED: 70 km/hBACKGROUND NOISE
50 - - - SMOOTH TIRE " P " - - ---- SUMMER TIRE " SP " 40 l '7 % ' I : I 1 % 1 I : j i :7 I r % U I + I r 53 . 5 '25 250 500 i K 2K 4K 8K I 6K fEHzJFigure 9 Comparison of noise spectra obtained for two "quiet" tire/road combinations and of background noise measured with extra side-wheels
It could be concluded that the level of the air-flow noise at low frequencies in both trailers is Similar, but in case of the "Tiresonic Mk2" trailer the range 600-6000 Hz was influenced by noise generated by the extra side-wheels. Those wheels were equipped with tires with circular
grooves (see fig. 7) which are noisier than smooth tires for a frequency range 800 to 3150 Hz (ref. 3). As a result, the theoretical difference
between the noise from the smooth measuring tire and the outer supporting tires of around 6 dB due to the distance difference would be reduced for certain frequencies (if the extra tires and the measuring tire were equally noisy and were all omnidirectional).
13
25
SMOOTH ARTIFICAL SURFACE
. MICROPHONE 90° .. --- SMOOTH TIRE -
pu-" J
E
15
10 -s -b 0 -5 I l : r r g 1 I g I I J I 1 % r I : r I i v v 33 5 125 250 500 1K 2K 4K 8K ISKFigure 10 Signal-to-noise ratio when using a smooth tire and a normal, commercial tire as the measuring objects. The road surface is a relatively "quiet" one. Background noise measurements were performed with lifted measuring wheel and extra side-wheels
5.2 Measurements by the quiet tire/road principle
It was impossible to repeat the experiment with the extra side-wheels moved further away from the microphone as it would need rather extensive changes of the trailer, so a new test based on another principle was performed. The idea was to make a test utilizing an extremely silent tire/ road combination to see how low noise levels can be measured with the "Tiresonic Mk2" trailer. After extensive search a special porous
rubber surfase was chosen (ref. 4). Two smooth tires (no tread pattern)
were used during the experiment, one of them filled with solid
polyure-thane instead of air.
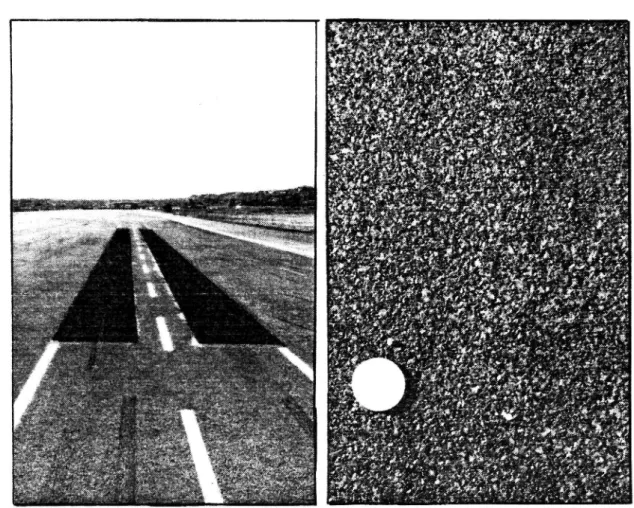
Fig. 11 and 12 show the measurement site and the rubber surface.
Measurements were made in two microphone positions; 90° and 135°
where 0° is to the front and 180° to the rear of the tire. Measurements were also made with the filled smooth tire on an adjacent asphalt
ll}
concrete surface. For some third-octave bands the latter case gave the lowest values, and fig. 13 shows the lowest levels measured by this technique - using values combined from both the rubber and the asphalt
surfaces - as well as the levels measured by the lifted tire principle.
It was noted from the results that the polyurethane-filled tire always
gave the lowest A-weighted values. For this tire, however, the rubber surface was only marginally less noisy than the asphalt surface. But,
when looking at the complete frequency spectra (not shown here) it is evident that it is useful to combine low-noise tires and pavements like
here as the "efficiency" of them are often concentrated to different parts of the frequency spectra.
Fig. ll The test track with its Fig. 12 Close view of the rubber rubber surface strips surface. The coin is 25 mm
in diameter
15
dB TR NICROPHONE F08. 90 DEG. 70 Kl l/H 85-02-15
100
--- -. 716-030
LIFTED TIRE PRINCIPLE
738-080
QUIET TIRE/Roan COHBINRTION
90,.
PRINCIPLE
60 q.50-.
3,
l
40 17 :_ .I L L 1 L L L A L l l l L A l l l l l 1 l L L L 1 L A I ' I V l 1 I I I. I I r U ' I 1 I U I I V l l' l U I V V ' I 'r 16 31.5 63 125 250 500 1K 2K 4K 8K 15K 32K FREKUENS/FREQUENCY 2
Figure 13 The lowest third-octave band levels measured by the two
principles in the microphone position 90°
5.3 Combination of the results from the two types of measurement The true background noise is likely to be lower than shown in any of the
two methods here. Both of them give upper limits to the true background
noise; therefore it is justified to combine the results of both the methods and take the lowest levels obtained as a new upper limit to the true
background noise.
Fig. 11+ shows the result obtained by combining the curves in fig. 8 and 13. Similarly, fig. 15 shows the same for the microphone position 1350
(data for 30 km/h are missing). Those two sets of data are the lowest
values we were able to measure (not considering random variations). Unfortunately, it is still not purely background noise, but a rough and exaggerated estimation of it.
l6
. Microphone 90°
[d
8]
{CH2}
Figure 14 Minimum third-octave band levels measured for any of the
tested extreme tire/road combinations. MicrOphone position is
O 90 90 . Microphone 1350 A m-.. l 0\ ~/ 'CI . % I \ Ixu \\\ I ~ \ u .L I,I u\\-" /.o . s\.\ \ x\ .o 0"a ~\\\'.~~ \ a o-.-, \ \ " 0 \ 70 " \.\ \ ~ \ \ \ .[ \ ~ Q. \~ \~. , \ --- \ \ [ Q.- I \ Io \ \ --O \ I \ \
m i
"
\ \
:
SPEED
\x
--- -- so km/h
\ \
..
_._.... 70 km/h
~\ ~
50".-
_..-.. 90 km/h
\
.
'\
4o t I % I T i I I g T I g 3 I L I T % j U % r 1 53 5 125 250 500 1K 2K 4K 8K 16K {CH2}Figure 15 Minimum third-octave band levels measured for any of the
testoed extreme tire/road combinations. Microphone position is 135
17
Table 1. Lower limit of signal-to-noise ratio (S/N) in dB(A) for
different tire/road combinations and for two microphone positions. Road no 1 is a very smooth artificial surface, no 3 is a non-trafficed low-textured asphalt concrete and no 7 is a worn and very smooth asphalt concrete surface. Background
noise is as shown in fig. 14-15 (combined values).
Micr.pos. Road no. Speed (km/h)
30 50 70 90
90°
1
9.5
11.6
10.4
10.2
TIRE SP " 7 12.5 13.0 11.3 12.0 (summertread)
135°
1
no data 12.1
9.4
9.4
" 7 no data 14.0 10.1 10.4TIRE P
90°
1
5.7
8.8
7.8
7.8
(smooth) " 3 5.1 7.1 5.7 4.6 9.3 10.7 9.2 8.4135°
1
no data 8.2
5.4
5.3
" 3 no data 7.2 3.3 2.3 " 7 no data 10.0 6.9 6.25.4 Minimum signal to-noise ratio for some typical cases
If we assume that the curves of fig. 14-15 represent an upper limit to background noise we have a lower limit of a signal-to-noise ratio form some typical "quiet" tire/road noise cases in table 1. The values are taken as the difference in A weighted levels of tire/road noise for two quiet tire types run on three quiet road types and the corresponding levels of the "background noise".
Tire P is a smooth non-patterned tire and SP is a commercial summer
tread tire. For the latter case S/N ratio is always better than 9 dB(A). For the special P tire S/N ratio could be as bad as 2-5 dB(A) in some
cases, but is probably much better.
Concerning the frequency spectra it is possible in fig. 16-17 to compare the "background noise" with some of the most critical measurements.
18 dB TR MICROPHONE P03. 90 DEG. 70 KN/H 85°03~01 r Ttr V V f T I UT VT 7 1r 1T1 T SUE. i a J 801. i 70-; 60-. J
1% -- ~ NIN. BHCKGROUND NOISE J
...
50q_ ' ° - - ' -- TIRE P RORD no.3 J
---~- TIRE P ROHD No.7
" -n~- -- TIRE SP ROHD no.1 j
--- TIRE SP ROHD no.7
40
:tiftfttfttit:f%:ff#i::i¢ff4%ftr
16 31.5 S3 125 250 500 1K 2K 4K BK 16K 32K FREQUENCY H2
Figure 16 Third-octave-band spectra for the upper limit of background
noise and some selected tire/road noise measurements where one can expect the worst 3/N ratio. Microphone pos. = 90° dB TR NICROPHONE P05. 135 DEG. 70 KH/H 85-02-15 vrvvrwrvwvxnyIVVftT1v1 v T V V 1 ' 1 1 . L 90.4 J 80-h 4 70-. i 60-» - ~ - 738-088 BHCKGROUND NOISE
i ...- 733-137
TIRE P RORD no.1
4
- - - 733-145 TIRE P RORD no.3
SOEL --- 734-043 TIRE P ROHD no.7 J
--- - 733-023 TIRE SP RORD no.1
-~~~~~~ -- 733-111 TIRE SP RORD no.7 J
0 FREQUENCY H2
4 ##f+%f%tf%#i¢§féifriftff#%féifii
16 31.5 63 125 250 500 1K 2K 4K 8K 16K 32K
Figure 17 Third-octave band spectra for the upper limit of background noise and some selected tire/road noise measurements where
one can expect the worst 5/N ratio. Microphone pos. = 1350
l9
6. INFLUENCE OF BACKGROUND NOISE ON THE RELATION BETWEEN TRAILER AND COAST-BY RESULTS
6.1 General assumptions
Background noise existing during trailer measurements must influence
the measured values mainly for very silent tire/road combinations. If the assumption is made that values from the trailer measurements (TR)
should be different from the coast-by measured values (CB) 9311 because
of a different measuring distance from the tire to the microphone, then the existence of TR background noise has to change the regression between TR and CB values from linear to a curvilinear form and thus would give a lower correlation coefficient (fig. 18). Another effect would be that the regression slope would be less than 1.0 as the TR values
should be more "compressed". Thus, a test to determine if this happens
would indicate whether background noise is as high as presented in the earlier figures or if it is in fact lower.
H A
5 mu
m
3 X TR resul is not InFluenced by background no i se, R=l .000 f _ A TR results Influenced by O 95__ background noise : R=O, 998 _ k '0
g
t
o
__
i
. m M A l" X A 35-- X AX Background nOIse level. 80
1
I l l l
75
I
I
I
I
55 60 65 70 75 80
CB sound level CdBCADJ
Figure 18 Influence of trailer background noise on regression between
trailer and coast-by results. Theoretical values. VTI MEDDELANDE l.llallA
20
6.2 Computer simulation to determine the influence of background noise on the correlation coefficient for trailer and coast-by measurements
Of course, in practice, even without any background noise one cannot
expect a correlation R = 1.000. To estimate the background noise
influence on the correlation coefficient - purely theoretical - a great
number of digital simulations with random data were performed. To do so, a special computer program was prepared. For each simulation eight CB values were selected at random within a required range. It was also possible to influence this selection by concentrating the selection of six of those values to a still narrower range.
Afterwards the TR values were calculated on the basis of the equation:
LTR =LCB +A+r where:
LTR - Simulated TR level LCB - Simulated CB level
A constant based on difference of microphone/tire distance
(CB and TR respectively), in this case = 22 dB
r - error term, adjusted by the computer program so that the correlation between CB and TR values equals a preselected value
Finally, a selected background noise level was added and the calculation
of the correlation coefficient was performed also for this case. These procedures were repeated 100 times with new random data and the
results were averaged. The final results are presented in figures 19 and
20. The horizontal axis represents the difference between the selected
background noise level and the lowest TR level as determined by the
computer. The vertical axis corresponds to the correlation coefficient
obtained after; the background noise was added. The four curves were
obtained for sets of data selected at "random" to fulfil the requirement
21
that the correlation coefficient should be R0 = 0.85, 0.90, 0.95 and 0.98
before the background noise was added.
In fig. 19 results are presented for CB levels distributed randomly within a range of 47 to 54 dB, while in fig. 20 the condition was "narrowed" so that six CB levels were spread at random within a range of 50 to 55 dB and two extreme levels were settled at 48 and 60 dB. The last case is
typical for measurements we have made which included six normal tread tires as well as one smoth and one studded tire. For the random spread of
CB values theaddition of background noise leads to a decrease in the
correlation coefficient independent on the initial correlation. In case of CB data with "special" distribution as explained above, the situation is more complicated. For a low correlation between undisturbed TR/CB
results the background noise tends to improve the correlation coeffici-ent. The reason for this phenomenon is that the background noise tends to "compress" the TR results as is shown in fig. 21.
' 22 U H H!) a R-O 98
l:
+
4 -'
s
'
ET
0 R=0.95g 0.954l ---3
t3
5---- "5--~-~-
«a.-H """-~-u F-< _| d M g R=O.90 o omit-mum": e -*---~-~-«¢ ' ~~-~.JL R=0.85 0.854% 3" ~ k %$- ~_$$~ N K I L,0.x:
-go3
-5i
i
ol
'
S DIFFERENCE BETWEEN BACKGROUND NOISE LEVEL AND THE LOWEST TR SOUND LEVEL [dB(A)]Figure 19 Theoretically simulated influence of background noise on the
correlation between TR and CB values. Random distribution of CB levels
22 in:
E
{3 llH
R=0.98
t
-*r
t
; «we.
in " k -C) -0 R=0.95 2: OJEJF: 3' *9 -B it ._§" 3 " '~-1I run «2 .1 mg
R=0.90
8 0.90 5 *5 5 * == """ R=Ql. v x 0.85 x " " l 1 1 l 1 033 1 I l I I 40 -5 0 5DIFFERENCE BETWEEN BACKGROUND NOISE LEVEL AND THE LOWEST TR SOUND LEVEL EdBCADJ
Figure 20 Theoretically simulated influence of background noise on the
correlation between TR and CB values. Special distribution of
CB levels
r! a:
g x WITHOUT BACKGROUND NOISE U A WITH BACKGROUND NOISE
I ._
,
35--k
> 3. a: I- so A AA A Ed x xx S< 70-- X 1 a 1 1 1 a 1 l l l I 45 5) 55 60 65 CB levels [dB]Figure 21 Example of simulated background noise influence on the corre-lation between TR and CB results
23
So, our simulation resulted in a rejection of our hypothesis above that the background noise always would decrease our correlation. However, it
is probably a quite rare case that an increased correlation occurs.
6.3 The effect on measured results of subtracting a hypothetical background noise
A similar experiment was performed with measured CB and TR data, obtained on a very smooth and quiet surface for 8 different tires. This
surface was selected because there the background noise would be
ex-pected to have the greatest influence. The measurements utilized the
"Tiresonic Mk2" trailer.
The correlation coefficients were calculated for all third-octave-bands
at speeds 30, 50, 70 and 90 km/h. Afterwards, certain hypothetical
"background noise levels" were subtracted from the measured TR values and the correlation coefficients were calculated once more. In all cases correlation grew worse when correction for background noise was applied i.e. when the values were "cleared" from background noise. According to the simulations of fig 20, with these pretty high correlation coefficients (0.95-1.00), the contrary should happen. Values "cleaned" from
back-ground noise should give ahigher correlation. It seems to indicate, that background noise does not influence measurements performed with the
"Tiresonic Mk2" test trailer.
6.4 Computer simulation to determine the influence of background noise on the regression coefficients for trailer and coast-by measurements
As mentioned before, the effect of significant background noise on the regression slope would be to decrease the slope of TR versus CB values to below 1.00, as the former would be "compressed" by the background
noise.
24
To estimate the theoretical influence of background noise on the
regression coefficient ("slope") a special computer program was prepared.
Two sets of actually measured TR level distributions were investigated. The first included 5 surfaces and 6 tires. The second was similar but the
extreme studded winter tire was excluded. The levels for each case were grouped for separate speeds and for the third-octave bands 500 and 2500
Hz as well as the A-weighted overall value. The third-octave bands were chosen to represent the two distinct generation mechanisms of the tires.
The next step was to calculate CB results which would fit the
corresponding TR values so that the correlation coefficient would be R = 1.000 and the slope B = 1.000. This would represent an ideal case without any background noise.
After this, "background noise" of levels 9,6,3,0 or -3 dB lower than the TR values were added to the TR levels. The new slope TR versus CB was
calculated. This would represent a case where background noise is
significant and which has disturbed the previously perfect correlation and slope of TR versus CB levels.
As it was found that the results were similar, whatever frequency we
used, we finally averaged the results for different speeds and frequencies. The results are then presented in figure 22. It is clearly
seen-that when the studded tire is excluded (dotted line) the slope of the
regression line is more sensitive to the S/N ratio than in the other case.
Of course, the same procedure can be used to predict the influence of
the slope B when background noise is added to the _C_B_ values instead. In this case B will be greater than 1, and the vertical scale to the right in the diagram should be used.
25
INFLUENCE OF S/N RATIO ON THE SLOPE >>B<
SL OP E OF RE GR ES SI ON LI NE
1.0
\ l m, A1.1,.
m2
U V1.2a:
A I4. 01.33
a:9:.
ALL TIRES CP,S,H,H,G,G$)
1 4o
o ' ' . "' P sanauls ' go.7- '
-1.s
- 1.8
0.6
'r
i
1L
-3
o
3
6
9
S/N RATIO [dB]Figure 22 Theoretical influence on the regression constant "B" of adding
background noise to TR values which otherwise would correlate perfectly with C8 values.
6.5 The effect of background noise on measured regression
coefficients
A study of the regression coefficients B obtained for real measurements
was then performed. The same principle as in chapter 6.4 was used but this time the measured CB levels were correlated with measured TR
levels and no extra "background noise" was applied.
The results obtained for the microphone position 1350 and with the
studded tire excluded are presented in figures 23, 24, 25 and 26. The
95% confidence interval is marked with dotted lines.
~26
As concluded in the previous section, background noise in the TR values would have the effect of reducing B to below 1.00. For our data in fig. 23~26 there are few indications of B being significantly lower than 1.00 (more than one confidence interval lower), and where it happens the
margin is really very small and the frequency is lower than 300 Hz.
On the other hand, the slope B is sometimes significantly higher than 1.00 which could indicate that there is background noise in the QB
values. This happens mostly at 1 kHz - a frequency where the S/ N ratio
in the CB test should be very high. It is most probable then that the high
slope in those cases is due to to some other, undetected effect.
It is concluded that the investigation of the regression constant does not seem to be useful for the purpose of detecting background noise.
(below).
TR versus CB measured levels. 30 km/h (above) and 50 km/h
VTI MEDDELANDE 441A
Fl 23-24 The regression constant "B" with 95 % con dence limits for
9 . 0 1 m Om . wm mwm mm un oz e r m m r o vm 0." . m m m m m m m H o z P H Z m b I P n -O 0 9 S 9 9 _ q 0 0 0 In L 8 6 0 to z _ _ _ _ _ _ _ !
a
xx.
I i i -c . " . I I I f ul l . 1 . I _ I J 8 \ k . V . ' I . \ |. . ' I . U n i . " 1.x1
:
\\
-\ |i . | .-\SURF.ALL; TIRES:P,S,M,H,G; SPEED: SOkm/h 95% (3.1
27
(below).TR versus CB measured levels. 70 km/h (above) and 90 km/h
VTI MEDDELANDE 441A
Fi 25-26 The regression constant "B" with 95 % con dence limits for
m r o vm Om . m m o m m m m H o z e r m
SURF : ALL; TIRES: P, S,M,H,G; SPEED: 90km/h 95% 0.1
9 . 9 0 m 0,. .. wm a m m m m H o Z e r m 0 9 s S . s n n b 0 0 O 0 I. 9 L 8 6 0 I Z _ _ _ _ _ _ _ _ _ _ 28
29
7. RECOMMENDATIONS
Both the methods for background noise tests discussed here, i.e. the
lifted or removed wheel principle and the quiet tire/road combination principle, should be further improved. The first one could perhaps be improved to compensate for the noise from extra supporting wheels. The second one could be improved by finding even more extreme tire/road combinations. Perhaps a soft carpet can be used as a super-quiet "road" and a tire with porous tread used as a super-super-quiet tire. Also, more than one tire/road combination could be used to optimize the sound emission in each particular frequency range and the results combined.
30
8 CONCLUSIONS
The task of measuring background noise on trailers intended for tire/road noise tests is very difficult. In general, only an upper limit to the true background noise can be obtained.
There are two major methods. One is the lifted or removed. wheel principle where the measuring wheel is raised from its normal position, after which the "desired" noise disappears and the background remains.
This has one or two disadvantages; firstly, the outer egg wheels (if such
are employed) might generate noise that is not there when normal measurements are made. Secondly, the bearing noise at the axle of the measuring wheel vanishes together with the tire/road noise. The latter
might be accepted by the argument that such noise exists also in normal
coast-by measurements, provided the bearings are the same and in the
same condition and that no structure-borne sound is amplifying this noise
in the microphone in the trailer.
The other method is the quiet/road combination principle where the most quiet tire and the most quiet road surface are used even if they are of extreme and abnormal construction. When the trailer is run with such a
tire/road combination (the supporting wheels are run on a normal
surface) the measured noise constitutes an upper limit to the background noise. In the ideal case the tire/road noise from the measuring wheel would disappear completely, but in practice it could be significant, maybe even dominating over background noise. Still, this noise might be so much below measured levels from normal tire/road combinations that the result is satisfying. The method can be refined by using different tire/road combinations to have the lowest noise emission in each third-octave band and then combining this into an overall "minimum spect-rum",
By using the principle of removed measuring wheel it has been measured
and calculated that the signal-to-noise ratio in the trailer of the
University of Gettingen is 13-18 dB(A) at 60 km/h, depending on the microphone position. At 120 km/h the ratio decreases down to 7 dB(A).
The compared measuring tire then is a smooth, non-patterned tire.
31
By using the principle of lifted measuring wheel and extra outer
supporting wheels, it has been measured and calculated that the signal
to-noise ratio in the trailer of the Technical University of Gdansk is at least 2-14 dB at 70 km/h, depending on frequency (above 200Hz). The compared tire, again, is the smooth, non-patterned tire.
By using the principle of quiet tire/road combination ELIE the lifted tire principle, the same trailer was found to have a signal-to-noise ratio of at
least 3-11 dB(A), depending on the chosen tire/road combination to which
the background noise is compared and the microphone position. The
figures for a summer-tread tire were found to be 9-11 dB-(A).
A theoretical computer simulation shows that one effect of background noise would be, normally, to decrease the correlation between trailer and coast-by measurements. Some tests concerning measured data for the Polish trailer show that the subtraction of background noise would have an effect contrary to the expected. Thus, it is concluded that background noise is not significant.
Similarly, it is expected that the existance of background noise in trailer measurements would decrease the regression slope constant (trailer versus coast-by measured values) to below 1.00. As this does not happen it is again concluded that background noise seems to be negligible and thus lower than indicated by the special tests described above.
32
REFERENCES
1. RONNEBERGER, D; RATTAJ, H: "Der Gottingen
Rollgerauschmess-anhanger: Konstruktion, Erprobung und erste Messergebnisse an
ver-schiedenen Serienreifen". University of Gottingen, Gottingen, West
Germany (1984).
EJSMONT, J A: "Tire/Road Noise - Comparison of road and
laborato-ry measurements and influence of some tire parameters on _ generation of sound". Report No. 244A, Swedish Road and Traffic
Research Institute, Linkoping, Sweden (1982).
EJSMONT, J A.; SANDBERG, U; TARYMA, S: "Influence of Tread Pattern on Tire/Road Noise". SAE Technical Paper 841238, Soc. of
Automotive Eng., Warrendale, PA, USA (1984).
NILSSON, N-A; AXEFORS, B; SIMONSSON, B: A Poroelastic Road Surface for Control of Tire/Road Interaction Noise. Techn. Report
No. 6.600.01, IFM Akustikbyran AB, Stockholm (1982).