Alignment of service characteristics with
competitive strategy & customer
satisfaction:
A Comparative study in fast food industry
MASTER THESIS WITHIN: General Management NUMBER OF CREDITS: 15 ECTS
PROGRAMME OF STUDY: Engineering Management AUTHOR: Muneeb Goraya and Ibrahim Zaaroura TUTOR: Jonas Dahlqvist
i
ABSTRACT
Competitive strategies are an essential tool for sustainable competitive advantage.
Particularly in the service industry, strategy has its significance as it plays a vital
role in achieving customer satisfaction. This study investigates alignment of four
service characteristics i.e. servicescape, service quality, quality and value with the
firms’ strategy and how this alignment achieves customer satisfaction. A set of
hypotheses were formulated to portray the significance of each of the four service
characteristics and customer satisfaction in accordance with the firms’
competitive strategy. The investigations were done particularly within the
fast-food industry, comparing two well-known fast-fast-food chain restaurants namely,
McDonalds and Max. A survey questionnaire covering the four service
characteristics was prepared and distributed among the possible respondents. The
analysis of the results was done with the help of SPSS. The results do not show any
significant difference in McDonald’s or Max’s strategy in alignment of the four
service characteristics. This thesis helps to understand the strategy dynamics of
the service industry firms and what is or is not significant to them when customer
satisfaction is to achieved; particularly for the fast-food industry.
Keywords: Competitive strategy, service characteristics, servicescape, service
ACKNOWLEDGEMENTS
This thesis is part of the Engineering Management degree at Jönköping University.
We would like to use this opportunity to thank the university management in
general and Jönköping International Business School (JIBS) in particular for
providing us the opportunity to take part in this unique degree program. We would
like to extend a special thank you to our tutor Jonas Dahlqvist. It was his able
guidance and support which helped us immensely from the beginning to the end
of this course. He was always available with his comments and suggestion to guide
us. Lastly, special gratitude to the 104 respondents, without them this thesis work,
would not have been possible.
Thank you all!
Jönköping, June, 2016
iii
Table of Contents
ABSTRACT ... i
ACKNOWLEDGEMENTS ... ii
List of Figures ... v
List of Tables ... vi
List of Appendices ... vi
1
Introduction ... 1
1.1
Background ... 1
1.2
Problem ... 2
1.3
Purpose ... 3
2
Theoretical frame of reference ... 4
2.1
Competitive Strategy ... 4
2.2
Combination strategy ... 5
2.3
Service process matrix ... 6
2.4
Service characteristics ... 7
2.4.1 Servicescape ... 7
2.4.2 Service quality ... 7
2.4.3
Quality ... 8
2.4.4 Value ... 8
2.5
Customer satisfaction ... 8
2.6
Linking service characteristics and customer satisfaction ... 9
2.7
Competitive Strategy: Linking service characteristics and
customer satisfaction ... 9
2.8
Development of hypotheses ... 10
3.
Method ... 12
3.1
Research strategy ... 12
3.2
Research design ... 12
3.3
Scientific approach ... 13
3.4
Research Method ... 13
3.4.1
Construction of questionnaire ... 13
3.4.2 Sample selection ... 13
3.4.3 Data collection ... 14
3.4.4 Data analysis ... 15
3.5
Trustworthiness ... 15
3.5.1 Reliability ... 15
3.5.2 Validity ... 16
4.
Results ... 17
4.1
Fast-food overview ... 17
4.1.1 McDonald’s ... 17
4.1.2 Max Burger ... 18
4.2
Descriptive statistics of collected data ... 19
4.3
Descriptive results: service characteristics ... 23
4.3.2 Service quality ... 23
4.3.3 Quality ... 24
4.3.4 Value ... 25
4.4
Satisfaction ... 25
5.
Analysis ... 27
5.1
Measures ... 27
5.2
Reliability of Measures ... 27
5.2.1 Servicescape ... 28
5.2.2
Service quality ... 28
5.2.3 Quality ... 28
5.2.4 Value ... 29
5.2.5 Customer Satisfaction ... 29
5.3
Validity of measures ... 29
5.4
Analysis of hypotheses ... 30
6.
Discussion ... 33
6.1
Conclusion ... 33
6.2
Limitations ... 34
6.3
Future Suggestions ... 34
References ... 35
APPENDICES ... 38
v
List of Figures
Figure 1: Porters Generic Strategies Model (Adapted from Porter, 1980 p 39)2
Figure 2: Competitive strategy in competitive environment. (Day et al., 1987, p.
1536) ... 5
Figure 3: Service-process matrix. (Schmenner 2004 p 338) ... 6
Figure 4: Modified service-process matrix. (Schmenner 2004 p 342) ... 6
Figure 5: Linking service characteristics and customer satisfaction ... 9
Figure 6: Theoretical model ... 10
Figure 7: Gender classification of respondents in pie chart form ... 20
Figure 8: Classification of respondents’ w.r.t. age ... 20
Figure 9: Classification of respondents based on visit to restaurant. ... 21
Figure 10: Pictorial representation of classification based of visit frequency 22
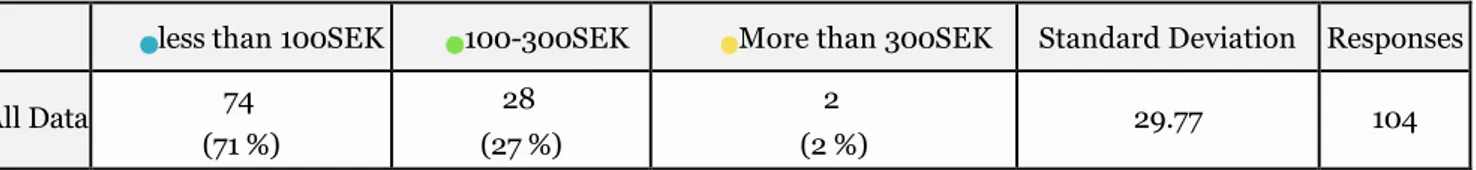
Figure 11: Spending per week ... 22
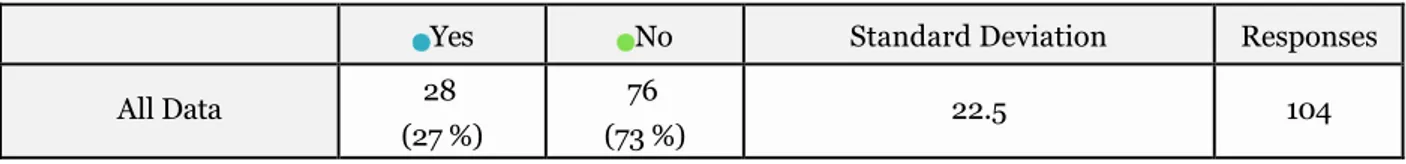
Figure 12: Pie-chart of discounts offered ... 23
Figure 13: Satisfaction levels from respondents ... 26
List of Tables
Table 1: Cultural diversity in McDonald’s menu (Nguyen Thi Bich and Balami,
2011 p 30) ... 18
Table 2: Gender classification of respondents ... 20
Table 3: Classification of respondents based on nationalities ... 20
Table 4: Respondents based on restaurant visited ... 21
Table 5: Comparison based on visit frequency ... 21
Table 6: Comparison based on money spent per week. ... 21
Table 7. Classification based on discounts offered ... 23
Table 8: Descriptive results for servicescape ... 24
Table 9: Descriptive results for service quality ... 24
Table 10: Descriptive results for quality ... 25
Table 11: Descriptive results for value ... 25
Table 12: Cronbach’s alpha for four service characteristics ... 27
Table 13: Inter-item correlation matrix for five items of servicescape ... 27
Table 14: Inter-item correlation matrix for nine items of service quality ... 28
Table 15: Inter-item correlation matrix for five items of quality ... 29
Table 16: Inter-item correlation matrix for three items of value ... 29
Table 17: Component factor analysis ... 30
Table 18: Descriptive Statistics for four observed service characteristics ... 31
Table 19: Independent sample t-test results ... 32
Table 20: Summarization of results of hypotheses analysis ... 32
List of Appendices
Appendix 1: Survey Questionnaire ... 38
1
Introduction
This Introduction chapter will provide the background of the thesis research and carries forward through problem explanation. The problem description delineates various problems which are associated to the alignment of competitive strategies with service characteristics. The problem description will end by pointing out objectives and purpose of the thesis
1.1
Background
Strategy has been defined in many different ways by researchers, but a complete agreed upon definition is still not available. Lynch (2006) has used the term strategy and corporate strategy synonymously. He defined corporate strategy loosely as “the identification of the purpose of the organization and the plans and actions
to achieve that purpose”. It can be said without much doubt that the study of strategy started with Igor Ansoff,
considered by many as the father of modern concept of corporate strategy (Hussey, 1999). Hussey (1999) argues that Ansoff’s contribution to the study of strategy/corporate strategy is invaluable as he conceptualized not only corporate strategy but strategic management and the turbulence theory of strategy. Lynch (2006) further categorizes corporate strategy into corporate-level and business-level strategies, where corporate-level strategy is the plans, policies to achieve purpose or goals and business-level strategy is about matching internal capabilities with external relationships. This categorization of corporate strategy is one way to categorize and define strategy. Strategy has been defined fairly elaborately by Mintzberg (1987). He gave several definitions for strategy covering a variety of scenarios. He defined strategy as a plan i.e. a course of action; ploy i.e. a specific maneuver; pattern i.e. a pattern in a stream of actions; strategy as a position i.e. placing the organization in-line with the environment and lastly strategy as perspective i.e. a way of perceiving the world (Mintzberg, 1987).
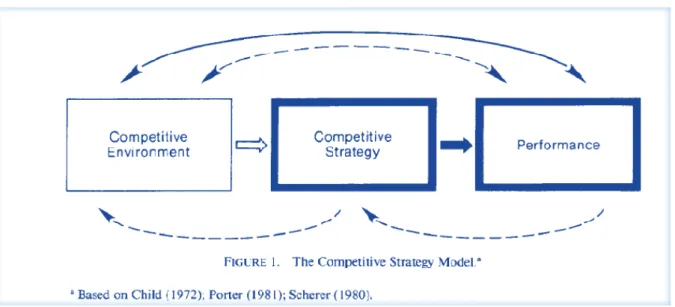
Another important and frequently used concept in strategy is competitive strategy. This idea was given initially by Michael Porter in 1980. It explains strategies of organizations that are entering a market and have to face competition in the market. These strategies essentially put competitors before the customers. Another way of setting strategy is customer driven strategy. This places more focus on customers as compared to the market competition. Lynch (2006) has explained this as a strategy of an organization with prime focus on customer satisfaction. Porter’s model of competitive strategies is shown in figure 1 and is arguably the most well-known strategic model when it comes to competition in the market and to achieve sustainable competitive advantage. These strategies are also known as generic strategies. The three generic strategies are:
Cost leadership strategy – when the firm focuses on being the lowest cost service producer, by reducing operational costs below their competitors. Porter (1980) states that the cost leadership strategy is dominant when price is the dominant. Also firms are more inclined to use it when they have a considerable market share. Differentiation strategy – when the firms seek to produce unique product which differ significantly from competitors’ products (Porter, 1997). This strategy may limit the market share for the organization, it also requires high startup and running costs (Porter, 1997).
Focus strategy–when the firms focus on a specific consumer segment within the total market. It can be a low cost focus strategy i.e. firms focus on low cost products or differentiation focus i.e. firms produce products for specific buyer segments (Porter 1980).
The core of Porter’s theory is not only about choosing a competitive strategy, but also about gaining competitive advantage and sustaining that particular advantage over their market competitors. Research in Operations Management (OM) has been focused on linking firm strategies with operational priorities. Miles (2013) suggest that although there have been positive developments in finding the most important services to generate competitive advantage but they still fall short. The reason is being that different industries e.g. services or production cannot use the same characteristics to gain competitive advantage. Schmenner (1986) suggested a
service-process matrix with throughput on the Y-axis
and labor intensity on the X-axis. He argues that the firms closer to the diagonal in the service-process matrix will
have increased productivity and profitability. Schmenner (2004) acknowledges that all service firms need not to be on or close to the diagonal in the service-process matrix to be profitable.
Porter and Schmenner provide the theoretical basis for service firms in competitive markets but do not mention how, for example a firm with differentiation strategy should best approach service operations (Kumar and Subramanian, 2011). Even if two firms are in service industry, this does not guarantee that their strategy will be same or similar to be profitable. Every firm will have their own focal service points and they may or may not depend on what competitive strategy is being used by the firm. These focal points or service
characteristics may be associated with loyalty/satisfaction in different strategic groups.
1.2
Problem
While continuous efforts attempt to link service characteristics with firm’s strategy, many changes in operational management taxonomies take place; for example, one way to categorize services within the organization is according to industries i.e. service industry, manufacturing industry etc. Miles (2013) and Kuo, Wu and Deng (2009) have studied some service characteristics related to cost leadership and differentiation strategies. Cost leadership service characteristics generally refer to price and efficiency, whereas product differentiation characteristics concern product or service uniqueness (Miles, 2013). Four service
characteristics have therefore been included in this research which has been chosen with the help of previous
research conducted by Miles (2013) and Kou et al. (2009). These characteristics are: servicescape, service
quality, quality and value. Customer satisfaction is in focus for customer driven strategies and to retain market
share in the competitive market it is absolutely essential to have satisfied customers; even more so in the services industry.
In light of the above discussion the problem with different service firms in the same industry is that they are considered essentially the same but behave differently following a certain strategy. They may also be using different competitive strategies, plans or ploys to achieve customer satisfaction. We therefore in this thesis have limited the study to four service characteristics within the service industry. The chosen industry is the fast food industry and this thesis does a comparative study between two fast food chain restaurants i.e. McDonald’s and Max. The study is conducted in the Swedish market.
The fact that both the chosen firm are in the same industry and similar type of business does not guarantee that they will be using similar strategies or plans to keep their customers satisfied or to have sustainable competitive advantage. Moreover, when it comes to competitive strategies, a mere selection of a competitive strategy or a hybrid of competitive strategies does not give the firms a framework of suggested service Figure 1: Porters Generic Strategies Model (Adapted
operations. (Miles, 2013; Kumar and Subramanian, 2011). By limiting the study to similar firms in the same industry we try to explore the alignment of these characteristics with the firm’s overall competitive strategy.
1.3
Purpose
This study further investigates the link between the four named service characteristics i.e. servicescape,
service quality, quality and value with the firm’s competitive strategy. We have chosen McDonald’s and Max
for this comparative study who are using cost leadership and differentiation strategy respectively. So, our research questions are:
• How firm with cost leadership strategy aligns the four service characteristics with its competitive strategy to achieve customer satisfaction?
• How firm with product differentiation strategy aligns the four service characteristics with its competitive strategy to achieve customer satisfaction?
In this thesis we do not investigate that which firm is using which competitive strategy rather we assume this based on previous research and plans and ploys of the firms accessible through a web search. The focus is on the alignment of service characteristics with a given competitive strategy.
2
Theoretical frame of reference
This chapter highlights the literature considered to be relevant for the purpose of this thesis. A theoretical framework is presented to provide the reader with a thorough understanding of theoretical components and how they relate to our research.
In this section we are going to explore relevant literature pertaining to our topic and the research area. First, since our research involves competitive strategy, we start with a brief description of the concept of competitive strategy and the different types of strategies. Later we discuss the four service characteristics chosen in the study, as how they have been described in the literature. Then their relevancy to customer satisfaction. In doing so, we will then be able to describe the model which we have established and the relevant hypotheses pertaining to it.
2.1
Competitive Strategy
Porter (1980) argues that firm can choose one of the three generic competitive strategies. Porter’s model of competitive strategies is shown in figure 1 and is arguably the most well-known strategic model when it comes to competition in the market. These strategies are also known as generic strategies. These three generic strategies are:
Cost leadership strategy – when the firm focuses on being the lowest cost service producer, by reducing operational costs below their competitors. According to Porter (1980) firms are more inclined to use it when they have a considerable market share. furthermore, he states that the following strategy is powerful when the price is dominant, when differences from one brand to another do not matter to customers, when the product fully achieve the customers’ needs without considering to quality a dominant competitive force, finally, when buyers are a quite large and have power to claim for down prices (Porter, 1997). However, following the cost leadership will have some flaws such as needs for high initial market share cheap raw materials and wide distribution networks, existing product line will therefore shall be redesigned to provide the related products and achieve the customer base as possible and other rival in the industry will be easily reduce their cost also through imitation of the production process (Porter, 1997).
Differentiation strategy – when the firms seek to produce unique product which differ significantly from competitors’ products (Porter, 1997). This strategy may limit the market share for the organization, it also requires high startup and running costs (Porter, 1997). However, pursuing this strategy leads to limit the market share, defection of existing customers since it involves cost trade off, it also requires high start-up and high running costs. Further, the products are subject to imitation by rivals if market’s differentiation declines (Porter, 1997).
Focus strategy–when the firms focus on a narrower zone of the total market. It can be a low cost focus strategy i.e. firms focus on low cost products or it could be differentiation focus i.e. firms produce products for specific buyer segments (Porter 1980). However, the strategy leads to similar production costs and investments as differentiation strategy, it will lead to change in the product specification which in turn causes cost disadvantages, and the non-focused products begin to meet the demands. It makes competitors to identify more tightly the market segments (Porter, 1997).
According to Day et al., (1988) competitive strategy is thus a result of external forces in the environment, which will in turn lead to particular competitive environment as shown in the model below. Therefore, managers need to determine the success factors which lead them to win over their rivals in the competitive environment and then select their competitive strategies based on these factors (Day et al., 1987).
Figure 2: Competitive strategy in competitive environment. (Day et al., 1987, p. 1536)
2.2
Combination strategy
Porter (1980) argues that if firms follow both cost leadership and differentiation strategy, this will lead to having unclear strategy that increases the likelihood of failure. And the firms will therefore be stuck in the
middle. As when the firm invests in high differentiation position, it results indeed in high overall cost position,
hence the firm will be unable to compete since its cost structure is too high. Moreover, it’s unable also to compete for differentiation with premium price since products and/or services are less differentiated than other firms applying differentiation strategy
However, many researchers oppose Porter’s hypothesis ‘Stuck in the middle’ and state that a firm can implement both cost leadership and differentiation strategy (Campell-Hunt, 2000). In addition, Karnani (1984) who concluded according to his model, firms not necessarily need to follow one of the three strategies and therefore is possible to pursue both high differentiation and low average cost position. Other investigations contradicted Porter’s ‘stuck in the middle’ hypothesis, when it was argued that customers in any marketplace buy products on the basis other than price and most industries offer these opportunities, to attract them. When they add, for example new features in the product or when they focus to differentiate their products in providing high quality products. As a result, this proves that there is great chance for firms to combine two strategies to meet market needs and outperform their rivals.
Murray (1988) argues that a firm is not precluded to pursue hybrid strategy since external factors of viable cost leadership are independent from that of product differentiation. The first stems from industry’s structural characteristics and stems from customer’s tastes. Empirical investigations oppose Porter’s statement “a cost
leader that competes against a product differentiator must also be a product differentiator, and vice versa”
(Murray, 1988, p. 396). For example, Phillips, Chang and Buzzell (1983) found that quality of product i.e. product differentiation was negatively related to relative direct cost i.e. cost leadership (Murray, 1988). Moreover, other researchers found that costs declined faster for firms that pursue high quality i.e. differentiation than firms that produced low quality product, hence cost savings can be earned for quality products (Murray, 1988). However, recent empirical results produced some contradiction, for example some firms in Greece found that efficiency is better in pursuing one strategy rather than dual one. This has been also observed in some firms in South American countries, which has negative impacts on export performance (Li and Li, 2008).
2.3
Service process matrix
A model for product-process lifecycle was created by Wheelright and Hayes (1979). Schmenner (1986) established a service process matrix as shown in figure 3. In this matrix, he suggested labour intensity on the X-axis (like process-variation) and throughput on the Y-axis (like process). Accordingly, movement towards the diagonal enhances the efficiency which in turn increases productivity, and ultimately profitability. Later Schmenner (2004) asserted that his original matrix was almost true, but needs slight adjustments as shown in figure 4. Schmenner (2004) noticed that not all service firms are essentially needed to be on diagonal, instead firm can be out of diagonal, suggesting by this new concept, the “theory of swift”. In this theory, he suggests that the faster materials flow, the more profitable firm is. In other words, increase in firm’s productivity has positive relationship with materials flow. However, years later, Schmenner concluded that firms can be profitable anywhere in the matrix but diagonal is just one suggestion (Miles, 2013).
Figure 3: Service-process matrix. (Schmenner 2004 p 338)
Figure 4: Modified service-process matrix. (Schmenner 2004 p 342)
2.4
Service characteristics
Since the research investigation is fundamentally constructed on generic strategies suggested by Porter, it is necessary therefore to delineate service variables that categorize service firms (Miles, 2013). Two groups of variables are identified; product differentiation variable relative to service and/or product uniqueness. Specifically, variables that define differentiation strategy, i.e., quality, service quality and servicescape variables, in other words, firm’s service characteristics. Another group is related to cost leadership variables which concern efficiency and price. Specifically, variables that define the cost leadership strategy, i.e., value. On the other hand, it is imperatively important to measure such variables through customer perception and/or the satisfaction level due to variables’ intangibility (Miles, 2013). Therefore, according to Miles (2013) firms following differentiation strategy must understand the desired service characteristics to meet customer’s perception about quality, service quality and servicescape. Similarly, for firms following cost leadership strategy, they must understand how to influence customer’s perceptions about value.
2.4.1 Servicescape
It is defined as a combination of many different dimensions which influence the customers’ holistic expectations and perceptions of the offered service (Miles, Miles and Cannon, 2012). Bitner et al. (1994) defines it as when customers use surroundings to categorize the service. Wakefield and Blodgett (1996) gave additional explanations and added facility aesthetics such as colour, music, lighting, and furniture to increase attract customers as well as the overall cleanliness, in other word, it means the overall atmospheric elements such as the physical designs and decor, posters, lighting, signs and advertisements. In summary, the literature suggests several ideas of servicescape. First, interactions between service provider and customers which lead to various needs in physical surroundings; second, servicescape could lead to categorize the service in particular ways in response to customer’s particular emotions; third, servicescape can play prominent role in design, plan and executions of any industry. All of these ideas are important because they suggest relationship between servicescape and firms’ strategy to obtaining customer satisfaction (Miles et al., 2012). As a result, servicescape has vital role in service industries such as fast food, retailing, restaurants and hotels (Miles, 2013). 2.4.2 Service quality
Service quality has been broadly investigated over the past years. It is a multidimensional concept and can be
measured using two methods. First method measures discrepancies between customers’ expectations and perceptions of service, the second is the “customers’ overall impression of the relative inferiority/superiority
of the organization and its services” (Zhao, et al., 2011). The literature defines service quality as
multidimensional concept regardless of the method. For example, Grönroos (1984) proposed two dimensions, technical quality which measure what consumers get from service encounter and functional quality pertained to service delivery. Later Parasuraman et al. (1988) created a five dimensional framework for service quality. It consists of five important factors, which are; reliability, responsiveness, assurance, empathy and tangibility (Zhao et al., 2012). Based on that, they developed a 22-item instrument called SERVQUAL which has been used widely for assessment of service quality in service marketing. Later Rust and Oliver (1994) established a three component service quality model, which measures service quality using three dimensions, which are
service product, service delivery and service environment. However, Dabholkar et al. (1995) suggested a
multilevel model which assesses service quality by five dimensions i.e. “physical aspects reliability, personal
interactions problem solving and policy. And six sub dimensions (appearance, convenience, promises, doing it right, inspiring confidence and being courteous and helpful)”. Brady and Cronin (2001) built up a
hierarchical model which measures the level of service quality based on three dimensions, i.e., interaction quality, physical environment quality and outcome quality, each of these dimensions has three sub dimensions and comprising attitudes, behaviour and expertise etc. As a result, many subsequent studies have implemented this model and deduced that the measurement of service quality changes according to the type of service being offered (Zhao et al., 2012).
In this paper, we will study customers’ perception in relation to service timing and communication between the customer and service provider as these factors affect negatively customer’s perception of quality, so this leads to conclude that service quality is an important element in defining success of service industries such as fast food and fast food industries.
2.4.3 Quality
Quality is the consumer’s judgement about the excellence of a product (Zeithmal, 1984). Perceived quality as
defined by Zeithmal (1984) distinguishes objective or actual quality, it is a “higher level of abstraction rather
than a specific attribute of a product” (Zeithmal, 1984). It can be global judgment that is similar to certain
attitude made by consumers about a certain product (Zeithmal, 1984). Some researches define quality as investment, and many firms invest in quality under the “revenue expansion” to increase the profitability in the firm (Miles, 2013). Previous literature explored the differentiation of objective and perceived quality as argued by Dodds and Monroe (1984). Objective quality is used to describe “the actual technical superiority or
excellence of a product” (Dodds and Monroe, 1984). However, perceived quality on the other hand is the
overall attitude perceived by consumers, managers or researchers. for example, products ’quality is assessed as low or high quality product based on its relevant excellence among other products as viewed by customers or consumers. Therefore, quality is a function of consumer’s evoked set (Zeithmal, 1984). The Literature defines quality in different aspects and many debates have argued the definition of quality. As a result, quality is pivotal in service industries and is considered as an important element from customer point of view. 2.4.4 Value
The term value has many definitions and has been used in many different ways, for example in economics, value is relevant to utility or desirability, however in social science it can be understood in the context of human values (Miles, 2013). To understand the concept of value, a study was carried out by Zeithmal (1988), he studied four definitions. First, “value is price” this definition became consistent with previous researches carried by Schechter (1984) and Bishop (1984). Second, value is “whatever I want in a product” (Zeithmal, 1988). This definition is consistent with the economist’s definition, i.e. the measurement of usefulness that comes out from consumption, and conform with pervious literature which suggested that value is “whatever
it is that customer seeks in marketing decisions as to which store to shop or which product to buy”
(Zeithmal,1988, p. 13).Third, value is “the quality I get for the price I pay”(Zeithmal, 1988, p. 13).This definition is also consistent with many other literatures like (Dodds and Monroe 1984; Doyle 1984).Finally,
value is defined as “what I get for what I give” (Zeithmal, 1988).The concept is consistent with the
conceptualization given by Sawyer and Dickson(1986) as a “ratio of attributes weighted by their evaluations
divided by price weighted by its evaluation” (Zeithmal, 1988 p.13). In conclusion, we can say that value is
important factor in defining customer’s perceptions and performance of service organization.
2.5
Customer satisfaction
The positive disconfirmation between the expectation and evaluation leads to satisfaction and the negative one leads to dissatisfaction (Zhao et al., 2011). Customer satisfaction is determined by two perspectives, that is, transaction-specific and cumulative perspectives (Kuo et al., 2009). Transaction-specific perspective measures level of satisfaction by recent purchase experiences, however, cumulative, on other hand indicates overall evaluations regardless to any specific purchase experience. The literature suggests that cumulative perspective is more effective when evaluating performance of service firms (Kuo, et al., 2009). Furthermore, it is a function of transaction-specific satisfaction. In addition to that, specific-satisfaction changes according to changes in experiences which in turn influences cumulative satisfaction positively or negatively (Zhao et al., 2011). Similarly, Shankar et al (2003) asserted that both types of satisfaction are different and transaction-specific
satisfaction has significant effect on cumulative satisfaction i.e. the overall satisfaction in both online and offline environments (Zhao et al., 2011). Customer satisfaction therefore, has vital role in service marketing since it is a good predictor in determining continuous intention in service firms (Zhao et al., 2011).
2.6
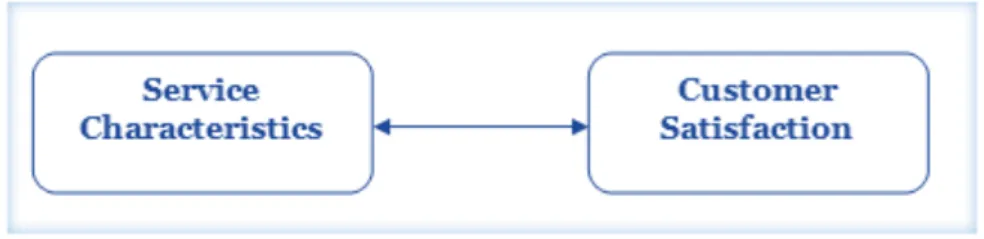
Linking service characteristics and customer satisfaction
In reference to the existing literature, service characteristics influence customer satisfaction. For example,
service quality has positive impacts on customer (Kuo et al., 2009). This element evaluates performance of
service personnel to give the promised service perfectly (Miles, 2013). However, inconsistency of service timing and communication variables with promised service affects negatively customer’s perception of service quality (Miles, 2013). On the other hand, servicescape has direct correlation with customer satisfaction. Many empirical investigations have shown this correlation; for example, as said “fine dining” needs some normal conditions, while “fast food” needs another specific conditions, suggesting different places require different conditions to attract or impact customers’ perception. Similarly, studies have ascertained further effects of quality and value on customer satisfaction. Thus, changes with any characteristics would perceive differently from customer’s point of view. In this sense, this depends normally on firm’s activities and relationship with customers to achieve satisfaction.
Figure 5: Linking service characteristics and customer satisfaction
2.7
Competitive Strategy: Linking service characteristics and customer satisfaction
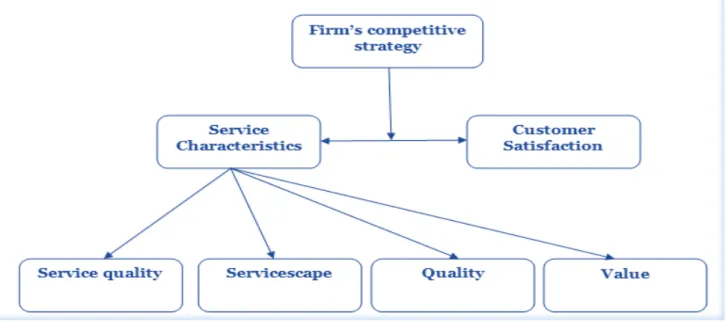
The following four service characteristics are important for all industries. However, the degree of importance is based on the industry’s type. For example, one will find that servicescape is more important in hotel industry compared to other characteristics; or may be service quality is most important factor in fast food industry to satisfy customers compared to other characteristics and so forth. However, during this discussion about the importance level of services, the notion of Porter’s generic strategies has come into the way, suggesting that the importance of each service characteristic is varied depending on the strategy being pursued in the organization (Miles, 2013), i.e., whether the firms is following cost leadership or differentiation strategy. In this sense, the model is thus created in order to analyse the importance of every service characteristic in accordance to the existing strategy followed by each firm. For this purpose, we have chosen two fast food restaurants in Swedish market. McDonald’s as the first restaurant which pursues a cost leadership strategy (please refer to section fast-food overview) and the second is Max burger which pursues a differentiation strategy (please refer to section fast food overview). The reason behind why we chose particularly McDonald’s and Max is to assess importance level of service characteristics in two service firms having different competitive strategies. Thus, in order to develop the necessary analysis, five hypotheses have been constructed.Figure 6: Theoretical model
2.8
Development of hypotheses
Broadly speaking, researchers have found that service characteristic of servicescape varies according to the nature of the service being offered as well as to customer expectations (Bitner et al., 2010). However, this difference is not that much between firms working in the same industry and following cost leadership strategy. Further, customer would like to enjoy the impacts of servicescape for differentiator while in contrast is unlikely to demand servicescape from cost leader (Miles, 2013). Thus, Hypothesis H1 is formally constructed as follows:
H1: Alignment of servicescape is more significant to firms following differentiation strategy.
Researchers have found that service quality characteristic varies according to type and complexity of the service delivered to customer (Miles, 2013). According to Bitner et al (2010) - customer expectations and the service being delivered using technology comes under the umbrella of service quality. On the other hand, since our research is to assess service quality with firm’s competitive strategy; for example, when firm follows a cost leadership strategy, it recognizes that this strategy comes at price rather than quality. While, in contrast, when firm applies differentiation strategy in its organization, then it recognizes that quality rather than the price is more important Thus, hypothesis H2 is formally constructed as follows:
H2: Alignment of service quality is more significant to firms following differentiation strategy. Researchers have found that quality also varies according to customer expectations. Zeithmal (1984) considered quality as a function of consumer’s evoked set. On the other hand, the research in target is to analyse the importance level of quality with firm’s strategy. In this vein, firms following cost leadership may not completely recognize quality to meet customer expectation while in contrast, firm having differentiation strategy recognizes quality to achieve customer expectations, and hence, hypothesis H3 is constructed as follows:
H3: Alignment of quality is more significant to firms following differentiation strategy.
recognize value to meet customer expectation while in contrast firm following differentiation strategy may not fully recognize the value to achieve expectations (Miles, 2013). Thus, H4 hypothesis is constructed as follows:
H4: Alignment of value is more significant to firms following cost leadership strategy.
Finally, generally speaking, it is argued that increased service quality would increase level of customer
satisfaction (Miles, 2013). However, we expect that servicescape, service quality, quality and value are
aligned differently in accordance to firm’s strategy but at the same time consistent with customer satisfaction (Miles, 2013). Broadly speaking, for example, customer may receive higher level of service quality and value simultaneously but lower level of servicescape. Thus one would expect good satisfaction level or let’s say one customer may receive high level of quality and servicescape but not value, then again one would also expect good of satisfaction (Miles, 2013). Thus, we formally construct hypothesis H5 as follows:
H5: Regardless of firms’ strategy, customer satisfaction is consistent for firms following differentiation
3.
Method
In this chapter we demonstrate the method which we applied to collect the data for this research. It starts with defining the research strategy and the research design, identify the scientific approach, research method as well what is implemented to illustrate the validity and reliability of survey.
3.1
Research strategy
Broadly, research is a conduct to find appropriate solution for problems. However, in order to obtain that solution a plan is therefore required, defined as research strategy. The purpose of research strategy is to provide researchers with necessary materials tools and needed for data collection. Finally, these data will be analyzed to provide researchers with valid answers for their research questions. In this sense, the research strategy of this paper is established on the background of studied firm’s service characteristics in accordance with its competitive strategy. Accordingly, a questionnaire has been designed and planned thereafter to be distributed to customers of McDonald’s and Max restaurants prior to data collection. Based on this, results will be elicited accordingly suggesting appropriate conclusion and recommendations.
3.2
Research design
Research design is a detailed working plan which is performed in order to construct subsequent flow of steps during the data collection. This helps researchers find relative answers for research problems. However, it is i.e. research design varies according to the nature of research study. Further, it has been classified by Bryman and Bell (2007) into five different groups as follows:
• Experimental design which is mainly based on experiment, that is, contains experimental data analysis for causal research question.
• Cross-sectional design: which is mainly based on case studies and contain two or more variables simultaneously in different countries?
• Longitudinal design where data is analyzed at several and different period of time. • Case study design which includes analysis of single case.
• Comparative design which includes analysis of two or more cases.
In this sense, since our research was conducted to compare the alignments of firms’ service characteristics with competitive strategy and in relationship with customer satisfaction, therefore our research design is
comparative research design. The reason behind using this design was, because the research is fundamentally
based on comparative analysis between two service firms (McDonald’s and Max), thus two cases were involved to complete the research.
On the other hand, there are two types of research methods for collection of data, that is, quantitative and qualitative methods.
• Quantitative method which is used to illustrate existing theories based on statistical data, where structured models, questionnaire, survey and observation, etc., are the tools implemented to collect required data.
• Qualitative method which is used to generate certain theories based on observations, where interviews, observations and notes, etc., are the tools used to collect required data.
Specifically, quantitative method is utilized to depict measurable phenomenon with measurable variables. In other words, gathered data is tested in numerical form, thus, developing of hypotheses and/or mathematical
models based on existing theories (Leedy and Ormrod, 2001). Furthermore, quantitative method covers larger number of respondents, thus it is utilized to establish any generalization about population through random or specific sample of respondents.
Under this perspective, a quantitative method was conducted to serve the research, specifically to analyze the given hypotheses. For this purpose, questionnaire was developed and circulated among 174 fast food’s consumers especially at McDonald’s and Max restaurants. According to Graton and Jones (2004), the questionnaire helps researchers collect data from different geographical areas in less time and cost.
3.3
Scientific approach
Scientifically, there are two distinct methods for research that is inductive and deductive method. According to Bryman and Bell (2007), the two methods are considered the basic guidance that help researchers determine whether to examine or construct certain theories during the analysis of empirical data, for example, when researchers want to build up a theory, then inductive method is implemented, however, when it is intended to emphasize existing theory, then deductive method is approached. Further, the deductive method is usually used to test hypotheses in order to prove general ideas.
Since the aim of this paper is not structure a theory but to emphasize previous theories of customer perception on service characteristics being offered by fast food restaurants, namely McDonald’s and Max in accordance with their strategies, therefore, the research was developed in accordance with the deductive method.
3.4
Research Method
3.4.1 Construction of questionnaire
To construct a questionnaire is not a simple process, since it shall be designed to encompass questions and information that are strongly correlated to research questions. Ultimately, it is a common tool used to collect primary data. On the hand, a questionnaire is constructed according to the nature and purpose of research. Thus it can be designed either with open or closed questions. In open question, respondents are free to answer in their own way and therefore qualitative information is elicited. However, in closed questions, respondents are bound to answer specific questions, thus quantitative information is elicited. According to Brymen and Bell (2007), respondents have chance to develop their knowledge in open questionnaire, while in closed questions, it is easier to analyze empirical data compared with open questions. Hence, closed questions survey is commonly used in comparative research design.
In this sense, the questionnaire of this paper was designed to have closed questions and consisted of 22 questions. These question were divided into two parts, the first part comprises of general information about customers such as gender, ages which were categorized into three categories, that is, below 2o years old, between 2o and 40 and above 40 years old. It further included native language. However, part two encompassed specific closed questions pertained to customer perceptions about fast food restaurants, specifically McDonald’s and Max restaurants. In particular, questions were designed to get broad information on each service characteristic that is servicescape, service quality, quality and value. The arrangement of questions was established to elicit vast and precise perceptions of services afforded to customers. A detailed discussion for the questionnaire is in the analysis section.
3.4.2 Sample selection
In research method, appropriate definition of sample is important because it reflects the accuracy of empirical data. Hence, choosing an accurate sample of respondents integrates the research design. According to Easterby-Smith, Thorpe and Jackson (2015) population is a “whole set of entities” while sample is a “subset of
those entities from which evidence is gathered”. Thus, it is essential to extract a sample that represents the
characteristic of whole population. Bearing that in mind, right group of respondents should be chosen in terms of age of group, gender, demographics and so forth, in order to getting accurate results. According to Bryman and Bell (2007), there are two types of sampling, that is, probability and non-probability approaches. In probability approach, sample is selected randomly that is, any person has chance to be part of the sample, it consists of five types, namely: simple random, stratified, systematic random, cluster and multi stage
sampling. However, in non-probability sampling, it is difficult to claim that selected sample represents the
population. It contains four types of samplings: convenience, quota, purposive and snowball samplings (Easterby-Smith et al., 2015).
With the perspective of this approach, it was therefore not possible to specify the whole population in Sweden, thus, convenience specimen was implemented. The reason behind this choice is easier access to collect empirical data. It provides researchers with a high rate of responses within a specific period of time, where resources and time are main delaying factors in the research. Another reason for choosing convenience sampling is: McDonald’s is global fast food restaurants known to everyone, Swedes and other people who live in Sweden, while Max is nationwide restaurant, most popular among Swedes. Thus conducting convenience sampling helped authors reach wide variety of respondents (in terms of ages, nationalities and gender) in a very short time, which in turn facilitated exemplifying population’s perceptions about Max and McDonald’s restaurants.
3.4.3 Data collection
Besides sampling, collection of data is another important requirement needed in research method. Missing the required information will not help answer the research question of the study. Therefore, it is advisable to carefully collect most relative data in a planned and effective way that helps find answer to the research problem. There are two ways of data collection, primary data and secondary data. According to Bryman and Bell (2007), primary data is a primary source of information related to research problem and is collected by researcher himself, through interviews, surveys, experiments and questionnaire, however secondary data is secondary source of information pertaining to research problems. This information is done by other investigators and can be collected from the literature, articles, journals and internet, etc. Although time and cost are saved while conducting this way, researchers need to carefully investigate the reliability of data. In this paper, both ways were implemented in order to gather extensive information on customer’s perception towards firm’s service characteristics i.e., McDonald’s and Max restaurants. The questionnaires were circulated in two ways, online and paper based among customers in Sweden. The survey questionnaire was carried out during the month of April, 2016.
With the intention to collect maximum number of sample size, 174 customers were approached, 60 through the online survey using the website www.freeonlinesurvey.com and 114 via printed version approached by authors themselves. Out of the 174 questionnaire, 114 responses were collected. There were 10 questionnaires which were invalid because of incomplete answers and incorrect answers. Therefore, they were excluded to avoid inaccurate results.
In the online survey, different sample of customers were conducted with respect to gender, ages and profession like students etc. Similarly, the printed sheets contained two versions, English and Swedish to make it easier and motivate people to participate. The survey was distributed in three cities, Stockholm, Gothenburg and Jönköping. Specifically, at Stockholm central stations, Gothenburg central station and the central station in Jönköping. Furthermore, it includes A6, IKEA shopping centers and university campus in Jönköping. In addition to that collection of data was also done at Max and McDonald’s restaurants located outside the shopping centers and stations of the three cities. Another good of conducting the survey at Stockholm and
Stockholm is the capital and most populous city in Sweden with plenty of fast food restaurants especially for Max and McDonald’s, thus it was easier to approach larger number of respondents. On the other hand, Gothenburg is considered as tourist city comprising various immigrants and visitors from different nationalities.
Moreover, the literature and internet were credible secondary data sources. It was essential to conduct this way in order to assure the strategy of every restaurant individually, meaning that the competitive strategy of McDonald’s’ and Max restaurant. Throughout the literature, the authors ascertained the strategy at McDonald’s restaurant, which is the cost leadership strategy, on the other hand, Max’s website was the source that helped the authors ascertain competitive strategy followed at Max restaurants, which is the differentiation strategy.
3.4.4 Data analysis
According to Finn and Wang (2014) valid measures are imperative for development and testing business theory, therefore, especially in classical test theory, in order to study the relationship between the construct (i.e. latent variable) and its indicators (i.e. observed variables). For this purpose, two measurement perspectives have been studied, namely formative and reflective perspectives. In formative, latent variable is measured and caused by indicators (observed variables) while in reflective, observed variables interpret latent variable (Diamantopoulos and Winklhofer,2001; Finn and Wang, 2014).
In this paper, reflective perspective was implemented, each construct is interpreted by indicators, for example,
servicescape as a construct is interpreted by fives indicators i.e. its relative questions, service quality is
interpreted by nine indicators i.e. its relative questions, and so forth. The reason for choosing the reflective approach is that, indicators can be interchanged and removal of one indicator does not change the construct; thus, easy use and flexibility in interpreting each construct (Diamantopoulos and Winklhofer, 2001).
Another important reason for choosing reflective rather than formative perspective is the ability to assess the validity and reliability of measures using factor analysis and assessment of internal consistency (Diamantopoulos and Winklhofer, 2001). For this purpose, SPSS software was used in the analysis, since the validity and reliability of measures can be carried out easily.
The purpose of using SPSS (Statistical Package for the Social Sciences) was, it helped present data in more scientific and reliable way. It enabled the authors test hypotheses of the research using different tools like ANOVA one-Way, exploratory factor analysis (EFA) and finding mean the mean average and the standard deviation and error for every construct efficiently. Thus, it saved time and efforts during the analysis work
3.5
Trustworthiness
3.5.1 ReliabilityThe reliability of measures is affected by four factors (Saunder, 2003). These factors are: participant error,
participant bias, observer’s bias and observer’s error. However, some methods were suggested to overcome
such problems. Muijis (2004) discussed two ways to identify the reliability. Either by repetition of measurement with which same results will be shown at different periods of time, or the internal consistency. Internal consistency is measured by finding the correlation among observed variables. According to Easterby-Smith et al. (2015), the reliability of latent variables depends on the average correlation between indicators that is the observed variables and is often measured by finding the Cronbach’s alpha coefficient. The greater value is (>0, 7), the better level of reliability (Easterby-Smith et al., 2015).
Therefore, in this paper, consistency method was used; SPSS was used to get the Cronbach’s alpha coefficient for every construct. The value of alpha was found for constructs for all the four service characteristics and
customer satisfaction as shown by the analysis section.
3.5.2 Validity
Since the validity of measures has become imperative in research, extensive techniques therefore have developed in the last decades (Diamantopoulos and Winklhofer, 2001). Among these techniques, exploratory factor analysis (EFA) and confirmatory factor analysis (CFA) were established. EFA is used to measure certain factors using a set of observed factors without “imposing a preconceived structure on the outcome” however; CFA is used to measure existing construct or questionnaire without exploring it in order just to confirm it (Suhr, 2006). EFA can be carried out using the SPSS software while CFA needs special equation model software (Easterby-Smith et al., 2015).
Therefore, in this paper, EFA were implemented to measure the validity of constructs, the four service
characteristics are the construct having 22 questions as observed variables, According to Easterby-Smith et
al. (2015). EFA may have same number of common factors as observed variables, which have loading on all common factors. Common factor analysis and component factor analysis are commonly used in the analysis. Specifically, in this research principal component factor analysis were conducted, according to Suhr (2005) principal component factor analysis is a variable reduction technique, commonly used to reduce to number of observed variables into smaller principal components encompassing most of the variance in observed variables. Doing so, SPSS program was used for this purpose. Measurements and results discussions are shown in the analysis section.
4.
Results
This chapter presents the results of the survey questionnaires with the classification of data based on a number of factors including the four service characteristics being studied.
4.1
Fast-food overview
The term fast food is given to foods that are served quickly. The idea of fast foods started in US when White castle restaurant opened first restaurant in 1920’s. People liked the idea and it became quite popular. This inspired other to gradually start open fast food restaurants, such as the seven–eleven, KFC and then McDonald’s (Nguyen Thi Bich andBalami, 2011). The reason behind the rapid increase of this industry is its market profitability compared to other food industries. It generates over $570 billion revenues which is greater than economic value of many countries. The industry opened 200, 000 job opportunities in 2015 in the United States (Franchise Help, 2016). Further, it has been expected that the industry is going to have and incremental growth of 2.5% in the next coming years. However, looking into Swedish market, fast food industries registered 2% growth in 2014 compared with 2013 in spite of wellness and strong health trend by Swedes. Strong and intensive competition is created between restaurants in two different corners that is price and quality. (Franchise Help, 2016) For example Max burger that produces special types of burgers in terms of quality, using organic and natural ingredients to achieve customer’s trend and McDonald’s in terms of price which led the market and accounted 26% of fast food sales in 2014 through very successful advertising campaigns (Nguyen Thi Bich andBalami, 2011).
4.1.1 McDonald’s
McDonald’s was found by brothers Dick and Mac Donald’s in 1948 in California, United States. The restaurant started selling barbecue meals with different varieties of meals, the menu contained nine items which were:
“hamburger, cheese burger, soft drinks, milk, coffee, potato chips and slice of pie” (Nguyen Thi Bich and
Balami, 2011 p. 29). In 1954, Ray Kroc’s curiosity spurred to take a look at McDonald’s restaurant when he knew that they were using eight of his machines. That day he met one of his friends who suggested new ideas to improve burgers recipe He believed that McDonald’s was on the way of success (Wikipedia, history of McDonald’s, 2016), so, he suggested franchising the restaurant in the country which was not the brothers’ priority. He took the approval from the brothers and established the first Kroc’s McDonald’s restaurants in 1955. Few years later, the restaurant was purchased by Kroc for 2, 7 million USD aiming to reach all cities of US. In 1965, McDonald’s went public with common share price of 22, 5 $ per share. The rapid success of McDonald’s was due to skilful marketing mind-set and flexibility to achieve customer demands. It was always suggesting different types of meals with new tastes. In 1968, when McDonald’s launched the legendary Big Mac burger which has made big impact in fast food markets. In 1969, five billion of big Mac burger was sold (Wikipedia, history of McDonald’s, 2016). According to statistics, McDonald’s has 32000 restaurants in 119 countries in the world serving more than 60 million people every day (McDonald’s, 2016). However, in 1968 when McDonald’s had just went public Max burger was founded in Sweden by Curt Bergfors in Gällivare, Sweden. Today Max has 103 restaurants in Sweden (Max, 2016). On the other hand, McDonald’s as the largest fast food chain has expanded the food chain because of its observance to serve customers according to the culture and religious background of customers in every country as shown in the table 1 below. (Nguyen Thi Bich and Balami, 2011, p.30)
Table 1: Cultural diversity in McDonald’s menu (Nguyen Thi Bich and Balami, 2011 p 30)
S.N .
Country Popular Product Key ingredients Local Customs & Religious belief
1. India Maharja Mac instead of BigMac Chicken or Lamb Beef is prohibited 2. Norway McLaks- Asandwich Grilled salmon &
Dillsauce Fish-loving
3. Germany Big Mac with PilsnerBeer Beer GermanBeer
4. Canada Mclobster- a lobsterroll Lobster
5. Japan
TeriyakiMcBurger Ebi-chiki EbiFilet-O Green Tea flavoured
milkshake
Pork-patties Shrimp-nuggets
Shrimp-burger
Japanese flavor
6. Chile Burger with avocado sauce Sauce made by
avocado No ketchup
7. Arabia Saudi Mc Arabia
A grilled chicken served
on a flatbread sandwich
No pork products and all meat sold is halal
8. Sweden McFeast A quarter pound patty, lettuce, mayonnaise, tomato, onion. Swedish flavor
9. Greece Greek Mac
Burgers made of patties wrapped in
pita bread.
10. Hongkong Rice burgers Burger served in two rice patties. Rice loving country
11. Uruguay McHuevo
A regular hamburger but topped with a
poached egg.
On the other hand, it was imperative to emphasize on McDonald’s competitive strategy. According to Schmenner (2004) “Highly productive name companies such as Southwest Airlines, Wal-Mart, and
McDonald’s are all examples of services that have been refashioned for lower throughput time and/or for less variation than their competitors, either by the design of the service itself or by the operation that has been developed to deliver that service” (p. 341). In this sense, the statement confirms that McDonald is
following cost leadership strategy, further, this was also illustrated by Miles (2013). 4.1.2 Max Burger
It is the oldest fast food restaurant in Sweden founded by Curt Bergfors in Gällivare in 1968.Richard Bergfors, the eldest son is currently the president since 2002. Max restaurant was considered as the largest fast food restaurant in northern Sweden till 1980’s. However, Bergfors decided not stay in north but to expand Max’s activities in 1990’s to become a nationwide fast food restaurant. In 2015, Max’s management opened the 100th
restaurant in Lidingö, the place where Curt Bergfors came with the idea to open the first fast food chain in Sweden. Today Max chain has 103 restaurants in Sweden and opened new additional restaurants in Norway and Denmark. The core activities and features of Max is to serve the tastiest and healthier burgers.
trees in Africa. According to Max website, below are some activities that differentiate Max from other fast food restaurants:
• Max’s brand depends on the heritage of Sweden as one of the tools to compete other fast food chains especially McDonald’s and Burger King (Nguyen Thi Bich and Balami, 2011).
• At Max, quality and fresh ingredients are key driver that differentiates it from other. Every year Max management assesses the fat statement to check whether the food they deliver are healthier, that is, a very low amount of fat. Max not only delivers regular burger but also the healthier such as the deli-fresh meals that varies from 4% to 12,5% fat. Max sells further its own made of salads sauce, local beef and chicken. “Max begins to describe how it works with the health issue in fat financial statements. Results during first year are minus 83 tons of fat in 2003” (Max Hamburgerrestauranger AB, 2016). • Max offers free Wi-Fi and background music in all of its branches; furthermore, it was the first fast
food restaurants that launched food order and payment directly into mobile phone apps ((Max Hamburgerrestauranger AB, 2016).
• Max has created unique products called the low-carbohydrate burger and low carb-burger to support carbohydrate diets like the Glycemic Index and Atkins (Max Hamburgerrestauranger AB, 2016). • In 2009, Max won environmental current test against of McDonald’s and Burger King (Max
Hamburgerrestauranger AB, 2016).
• CEO of Max, Richard Bergfors won the Publisher’s Award “This year’s Green Capitalist” (Max Hamburgerrestauranger AB, 2016).
• In December, 2015, Max revealed new menu of vegetarian.
• In coordination with electric car manufacturer Tesla, Max initiated and build the first supercharger stations in Sweden for Tesla's cars in 2014 (Max Hamburgerrestauranger AB, 2016) and so many active investments toward green and healthier environment.
• Max was awarded by ISI Wissing the brand survey for 13 years as the best restaurant in Sweden from customer satisfaction point of view, further, Max was awarded by SIFO and ISI Wissing as Sweden’s tastiest hamburger for almost last eight years (Max Hamburgerrestauranger AB, 2016).
In this sense, we elicit that Max burger delivers unique products with high quality and services to customers. Max burger differentiates its products from other. Therefore, it was imperative to emphasize that Max is pursuing differentiation strategy in its chains.
4.2
Descriptive statistics of collected data
The survey questionnaires were distributed among respondents in two ways; 60 through online survey and 114 via printed copies. Printed copies of questionnaire were more effective than the online survey. From 60 online questionnaires we got only 4 responses, while 110 responses were collected from the printed questionnaires. Among these 114 responses ten were excluded due to invalidity, either uncompleted questionnaire or choosing two answers simultaneously. As a result, the response rate of the survey was above60 percent.
After collection, we categorized them into different groups of participants in terms of gender, mother tongue, visiting frequency and amount of money spent on fast food, especially McDonald’s and Max burger restaurants. The results are demonstrated below.
As shown in the table 2 below, among 1the 04 respondents 72 were male and 32 were female, representing 69% and 31% respectively.
Table 2: Gender classification of respondents
Male Female Standard Deviation Responses
All Data 72 (69 %) 32 (31 %) 20 104 Figure 7: Gender classification of respondents in pie chart form
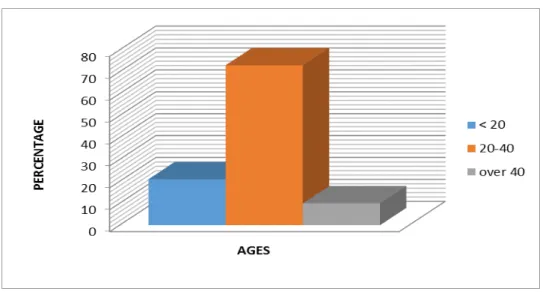
Figure 8: Classification of respondents’ w.r.t. age
With regard to the ages we have categorized into three groups, as shown in figure 8.21 were below the age of 20, second group is of people with age between 20 and 40 years. They represent 73 out of 104 respondents. Lastly 10 respondents were over 40 years old. The highest age group is therefore between 20 to 40 years which comprise 70.19% of total respondents whereas 20 or younger are 20.19%. Over 40 represent 9.61% of respondents.
We further classified our respondents on the basis of nationalities. People from different nationalities were asked to fill in the survey questionnaire to try to get to a wide variety of answers. The categorization is shown in table 3 below.
Table 3: Classification of respondents based on nationalities
All Data Swedish English German Arab Indian Other Responses
Respondents 75 4 3 8 5 9 104