VTI särtryck
Nr 207 0 1994
Pavement modelling based on measured
in-depth deflection data
Håkan Jansson and Leif G. Wiman
Paper presented at the European Symposium on
Flexible Pavements, Lisbon, September 20 22, 1993
[H
H
Väg- och
transport-farskningsinstitutet
'
V'" särtryck
Nr 207 0 1994
Pavement modelling based on measured
in-depth deflection data
Håkan lansson and Leif G. Wiman
Paper presented at the European Symposium on
Flexible Pavements, Lisbon, September 20 22, 1993
Väg- och
transport-'farslmingsinstitutet
Pavement modelling based on measured in-depth deflection data.
Håkan Jansson & Leif G. Wiman
Swedish Road and Transport Research Institute (VTI), Sweden
ABSTRACT
In-depth de ections were measured in three typical Swedish pavements during different seasonal conditions. Results from Falling Weight De ectometer loadings on one of the test sections are compared to calculated de ections. Different non-linear as well as linear moduli models are tested in nite-element analysis. For the autumn conditions, reasonable agreement between measured and calculated de ections can be found when the moduli of base and subbase are functions of bulk stresses and the modulus of subgrade is a function of the deviator stress. In the spring when the subgrade is newly thawed, there is a tendency to a lack of fit in the upper part of the subgrade. Measured de ections decrease more rapidly with distance from the load, specially close to the centre of load, which implies a stronger stress-dependence in the horizontal direction. In the spring thaw, good agreement is found when the frozen zone in the subgrade, as well as the other layers, is modelled as linear elastic.
INTRODUCTION
In a joint Norwegian/Swedish project, in depth de ections were measured in pavements
typical of these countries. Measurements were made in different seasons and repeated for
three years. One of the objectives was to study the elastic properties of different materials under the load of the FWD. The goal is to nd simple and practical models for use in design and evaluation of results from FWD measurements.
Calculation of de ections was carried out and the results were compared to measured values. A simple trial and error approach was used. Materials were assumed to be stress dependent, as well as linear elastic. The computer program used here is ILLI-PAVE, a nite element program. In this paper, results from one of the Swedish test sections, road No. 34, are presented.
INSTRUMENTATION
The section instrumented on road No. 34 is shown in Figure 1. This is a 78 cm exible pavement with a 13 cm AC layer and a subgrade of clay. Measurements of the in depth de ections were performed with four LVDTs (Linear Variable Differential Transformer) on top of steel bars anchored at different depths. De ection in different layers in the pavement
was obtained by subtraction of de ections to different depths, e.g. de ections at LVDT (C-D)
give the deflection in the subbase etc. The two layers in the subgrade are called the upper and lower subgrade.
FWD LOADING ] 2 3 30 30 30 30 30 30 cm mMVWvw NWMMMMMMMMMMW W 78 I SUB- f pc:: GRADE :: är" 150
(Clay)
&, 300
Figure 1. Design and instrumentation at test section, road No. 34, all measurements in cm. MEASURED IN-DEPTH DEFLECTIONS
De ections measured in the pavement in different layers, together with the de ection basin measured at the same time on the surface using the FWD, are presented in Figures 2-4. The results are typical for this section in different seasons. In the spring thaw, Figure 2, there is a frozen zone from 73 to 130 cm below the surface, i.e. most of the upper subgrade layer is frozen. In the spring, Figure 3, the measurement was made about two weeks after the subgrade
had thawed.
In Figure 2, no de ection in the lower part is shown, due to measurement error. The results shown in Figures 3 and 4 indicate that the de ections measured to the depth of 3 m below the surface should be somewhat greater than the de ections measured at the surface with the FWD. This is not logical, but may be regarded as measurement error. However differences are
small.
Distance from centre of load [mm]
E E:. C .9
8g
Illlllllllllllllll Subgrade-upper
Subbase 250 ' _ ' _ AC & Base - -D- ' Surface deflection 300Figure 2. Measured in-depth de ections and FWD surface de ection in spring thaw,
Table 1. Models and material properties used in calculations.
Layer Modulus Poisson's ratio Coef cient at rest
AC C 0.35 1.0
Base
C, k1>x=9 kg
0.4
1.0
Subbase
(3, mg kz
0.4
1.0
Subgrade
C, kyku d k2
0.45
1.0
Constant moduli were earlier calculated with the CHEVRON program. Values satisfying the measured deflections under the centre of load were used as an estimate. These values are shown in Table 2. The chosen values of k2 covered a wide range. For the subgrade results
from tri-axial tests on clay from a nearby section were included. The constant kl was adjusted
to give de ections in the order of the measured values. The value of Poisson's ratio will affect the calculated de ections, but in order to be as constant as possible the above values were chosen. Another value that strongly affects the results is the coef cient of earth pressure at
rest. This value, which can be much discussed, was varied in some calculations. From these results, a value of one (1.0), or close to one, seemed to give the best match to the measured de ections.
Table 2. Moduli calculated with linear elastic program to match the measured de ections
under the centreline of load, FWD 50 kN.
Layer Spring thaw (85-04- 10) Spring (87-05- 19) Autumn (87-09- 17)
AC (estimated) 6700 MPa 4700 MPa 4700 MPa
Base 210 433 533
Subbase 218 287 261
Subgrade - upper 246 10 14
Subgrade - lower
109 1)
36
57
1) From difference between surface de ection and de ection at 1.5 m depth.
COMPARISON OF MEASURED AND CALCULATED DEFFLECTIONS
In the following gures, a limited number of calculated results, together with measured de ections in different layers, are shown. Type of model for different layers and the values of
C, kl and k2 in the presented calculations, are shown in Table 3.
Table 3. Moduli used for different layers in calculations (A F) shown in the following
figures, constants (C and kl) in MPa.
Layer Calc. A Calc. B Calc. C Calc. D Calc. E Calc. F
AC 4700 4700 4700 4700 4700 6700
Base
150*9 0-2
35*6 0-5
400
150*9 0-2
150*9 0-2
150
Subbase 110*9 0.2 35>k6 0.5 230 110>|=9 0.2 110>x=9 0-2 180
Subgrade 7*Gd -1.07 15*Gd -1.07 495*Gd -1.07 7*0d -O.15 7*Gd -2.0 200
The calculated de ection in the AC and base layer depends to a great deal on the assumed modulus of the AC layer. In the three calculations shown in Figure 5, the stress-dependence of
the base varies from zero to an exponent (k2) of 0.5. The differences in de ection in the layer are, however, small. Compared to the measured de ections in spring and autumn, the
calculated values at a radius of 300 mm from the centre of load are somewhat larger. Also, the
negative deflections measured at radii of 600 and 900 mm in the spring are not calculated. However, considering the small values, some thousandths of a millimetre, there is fair agree-ment between measured and calculated de ections, independent of the model chosen for the
base layer. By adjusting the values for the base layer in the calculation, it is always possible to
obtain an exact match in the centre of load.
Deflections in the subbase layer from the same three calculations as above are shown in
Figure 6. Again, the differences in stress-dependence of the subbase and the base result in
small differences in deflection. The match with the measured deflections in spring and autumn is also good.
Distance from centre of load [mm] -1 0
3 300 _690 . ----_.--900 1 200
10 20 30
. .u- - Measured spring
De fl ec ti on [pm] 40 - -D' - Measured autumn 0 I .A 50 Cac _o Calc. B 60 - A - Calc. C 70
Figure 5. Measured and calculated deflection in AC and base layer, road No. 34.
Distance from centre of load [mm]
O 300 600 900 1200 O % % % ! 20 40 ~ 60 - "- - Measured spring ' 'D- - Measured autumn De fl ec ti on [p m] 80 ' Calc. A ___<>_ 100 Calc. B _k Calc. C 120
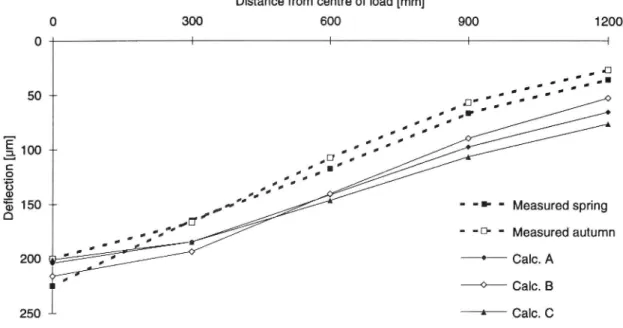
6 The same calculations as above result in the de ections in the upper part of the subgrade (between formation level and 1.5 m depth from surface, a layer of 0.72 m) shown in Figure 7. For the subgrade, the same stress-dependence as from tri-axial tests is used in the calculations. The calculation with the strongest stress-dependence for the base and subbase gives the best agreement. Compared to the de ection measured in the autumn, the de ections are at
different levels, but the shape of the de ection basins is most alike. In the spring, a higher
de ection is measured in the centre of load. The stress-dependence for base and subbase has an effect on the stress distribution in the subgrade, and the weaker this stress-dependence, the
atter the de ection basin in the upper subgrade.
Distance from centre of load [mm]
0 300 600 900 1200 0 % % % % _ :D _ ' __-_ '. 50 ** D-___._ _ _ _ 0 _ __ _l'
g 100
_D .:_ . '
s
_ '. -'
% _,"__ ' 0 E 150 ,/ ' "' ' Measured spring ICT _ .:." = ' 'D' ' Measured autumn200 q ' ' , _ f;
'
_._ Calc. A
'
<>
Calc. B
250 - A Calc. CFigure 7. Measured and calculated de ection in upper subgrade layer, road No. 34.
To show the importance of the model for the subgrade, compared to the models for the base and subbase (Figure 7), different stress-dependences in the subgrade layer are shown in Figure
8. In these calculations, the same models for base and subbase are used (k2=0.2). The weaker
Distance from centre of load [mm]O 300 600 900 1200 O % % % % _ ' '. 50 '" ._ _ _ g 100 C .9 *6' _q; 8 150 - 'l- ' Measured autumn _D Calc. A 200 g __._ Calc. D _o Calc. E 250
7 the stress-dependence, the atter the de ection basin, but the differences between the basins are small. Compared to the calculated results in Figure 7, the implication is that the way to match measured de ections in the subgrade should rather be to adjust the models for the above layers. However, this applies when the only concern is to match the de ections at different radial distance from the load in one layer, the upper part of the subgrade. If the lower part of the subgrade is also considered, the problem is more complex. In the case of the calculations that gave best agreement in the upper subgrade, Figures 7 and 8, the calculated de ections in the lower part of the subgrade are shown in Figure 9. These de ections compare better to the de ection measured in the spring, while measured de ection in the autumn is smaller. Calculations that give better agreement with the autumn de ections are made, but then on the other hand, de ections in the upper subgrade disagree.
De fl ec ti on [p m]
Distance from centre of load [mm]
o 200 400 600 800 1000 1200 0 : i i i i : 20 --40 _ ' __ -' __? 60 -80 100 _____ - -l- - Measured spring - -D- - Measured autumn 120 140 i ° Calc. B 0 Calc. E
Figure 9. Measured and calculated de ection in lower subgrade layer, road No. 34.
De fl ec ti on [p m]
Distance from centre of load [mm]
1 200 .. ; U1 O l 250
- "" ' Measured ' 'D- - Measured " "" " Measured _o Calc. F __h Calc. F + Calc. F
Figure 10. Measured and calculated de ections in AC and base, subbase and upper subgrade layer, spring thaw, road No. 34.
In the Figures 5-9, only measured de ections in spring and autumn are shown, because the de ections in the spring thaw are of somewhat different magnitude. In Figure 10, measured de ections in AC and base, subbase and subgrade are compared with calculated values. Good
agreement can be found with constant moduli of the layers. This implies that the frozen zone,
the upper subgrade, can be modelled as a linear elastic layer.
Even if the measurements shown here are typical for different seasons, there is a variation
between different measurements, either between results from different years or between
results from different loading devices on the same measuring day. This is due to natural
variation, but may in some cases also be due to measurement error. This means that, for
practical use, models giving reasonable agreement with these measured results can be
accepted and tested on other results, rather than searching for absolute agreement in these
cases. Models used in these calculations are not veri ed with measurements made with other
loads of the FWD.
CONCLUSIONS
Three typical Swedish pavements were tested, with in-depth de ections being measured during loading with FWD, among other devices. The results from one of the pavement sections, road No. 34, are compared to a limited number of calculations with different linear or non-linear models used for the pavement materials. Reasonable agreement can be found when the modulus of the base and subbase is a function of the bulk stress and the subgrade modulus is a function of the deviator stress. This is especially true for the pavement layers, where the calculated de ections are not very sensitive to the choice of model. This may be due to the fact that it is only the vertical de ections at different radial distances that are
checked, and most of the de ections are measured close to the centre of the load, as well as to
the fact that the materials do not appear to be very stress-dependent. Finding a model for the subgrade is more dif cult, especially if good agreement between measured and calculated values is to be achieved for both the upper and lower part of the subgrade with the same model. The calculated de ections in the subgrade depend not only on the model for the layer
itself, but also on the models for the above layers, which affect the stress distribution on the
subgrade. There are also other inputs in the calculations, besides the modulus model, that will strongly affect the result. For instance, it is a problem deciding what values to choose for Poisson's ratio and the coef cient of earth pressure at rest.
If calculated results are compared to measured de ections in different seasons, the best agreement here is found for the spring thaw and autumn conditions. In the spring, there is a
tendency to disagreement in the subgrade near centre of load; calculated de ection basins are
atter. Also in the AC and base layer, there is disagreement; the measured negative de ections apart from the centre of load are not calculated with these models. The frozen zone in the upper subgrade layer modelled as a linear elastic layer, as the base and as the subbase, in the spring thaw gives good agreement with measured de ections.
It is believed and shown for this pavement section that stress-dependent models in calculations sometimes give better agreement with measured de ections. However, the question still to be answered is whether they also will improve calculations of critical stresses and strains in the pavement for theoretical and practical use.
ACKNOWLEDGEMENTS
These measurements were performed in co-operation between the Norwegian Road Research Laboratory, the Norwegian Institute of Technology, the Norwegian Asphalt Industry Laboratory, the Swedish Road Administration and VTI. The Swedish part of the work at VTI is sponsored by the Swedish Road Administration.
ILLI PAVE is a pavement analysis program provided by the Transportation Facilities Group, Department of Civil Engineering, University of Illinois at Urbana Champaign.
REFERENCES
Noss P.M. and Mork H., A Norwegian/Swedish in-depth pavement deflection study (1) Instrumentation and test loading, Third International Conference on Bearing Capacity of Roads and Airfields, Trondheim 1990, pp 817 828.
Jansson H. and Wiman L.G., A Norwegian/Swedish in depth pavement de ection study (2) Seasonal variation and effect of loading type, Third International Conference on Bearing Capacity of Roads and Airfields, Trondheim 1990, pp 829 839.
Mork H., A Norwegian/Swedish in depth pavement deflection study (3) - Backcalculation of moduli, Third International Conference on Bearing Capacity of Roads and Airfields, Trondheim 1990, pp 841-852.
Arm M., Finkorniga jordmaterials egenskaper (in Swedish), VTI notat V 147 1991.
Carlsson H., Jansson H. and Wiman L.G., Provbelastning av instrumenterade vägar. Deformationsdata från mätningar på väg nr 34, 234 och 720 i Sverige 1985-87 (in Swedish), VTI notat V 148:1 101991.
Jansson H., Jämförelse mellan beräknade och mätta deflektioner, Etapp 1: ILLI-PAVE beräkningar - Fallviktsmätning väg 34 (in Swedish), VTI notat V 176 1992.
Jansson H., Jämförelse mellan beräknade och mätta deflektioner, Etapp 2: ILLI PAVE beräkningar Fallviktsmätning väg 234 (in Swedish), VTI notat V 196 1992.
Jansson H., Jämförelse mellan beräknade och mätta deflektioner, Etapp 3: ILLI PAVE beräkningar - Fallviktsmätning väg 720 (in Swedish), VTI notat V 199 1992.
Uzan J., Witczak M.W., Scullion T. and Lytton R.L., Development and validation of realistic pavement response models, 7th International Conference on Asphalt Pavements, Nottingham