Modes of transport on
short journeys
Attitudes and behavior of the inhabitants of Gothenburg
w as 0') Fl
<
N or) Qt
O Q a. E lE
Sonja Forward
Swedish National Road and
'TransportResearch Institute
VTI rapport 437A - 1999
Modes of transport on
short journeys
Attitudes and behaviour of the inhabitants of Gothenburg
Sonja Forward
Swedish National Road and
' ansport Research Institute
Printed in english 1999
Publisher Publication
VTI rapport 437A
Published Project code
_ _ 1998 40104
Swedish National Road and
Project
Behavioural factors affecting modal choice
Author Sponsor
S onj a Forward Swedish National Road Administration
Title
Modes oftransport on short journeys: attitudes and behaviour ofthe inhabitants of Gothenburg
Abstract (background, aims, methods, result)
During the past 20 years, car traf c in Europe has increased at an explosive rate, which has had a negative effect on both the external environment and the quality of life. The purpose of this study, which replicates an earlier study under the name ADONIS, was to increase understanding of the factors controlling the choice of transport mode and to provide proposals on how people can be motivated to choose a transport mode which is more favourable for the environment.
This study, which was carried out in Gothenburg, analysed short journeys on foot, cycle and car with the aid of a travel diary and an attitude survey. The attitude survey was designed in accordance with an expanded version of the Theory of Planned Behaviour which included; attitudes, subjective norm, per-ceived behavioural control and habit.
The results from the travel diary show that relatively few people in Gothenburg travel on foot or by cycle. The attitude survey showed that the variables in the expanded version of the theory explained be-tween 42 to 69 per cent of the intention to walk, cycle or drive a car for a short distance. The variables which had the highest explanatory value were perceived behavioural control and habit.
In accordance with the theory, the effects of socio-economic factors were indirect, apart from the observation that gender was an important factor in explaining the intention to walk. This means that the Theory of Flamed Behaviour together with habit can advantageously be used in the evaluation of different projects, at the same time as it contributes to increased knowledge of the best way of motivating road users to select more environmentally friendly transport modes.
ISSN Language
Preface
This research project was commissioned by Alice Dahlstrand and Thomas Bostrém, (Swedish National Road Administration, Region West). The Project Man-ager and author has been Sonja Forward (VTI/Swedish National Road and Transport Institute). Magnus Gustavsson contributed with the accumulation of data
VTI RAPPORT 437A
and data processing. Henry SoderstrOm has been respon-sible for proof-reading, Eva Gustavsson (VTI) for com-ments, VictorAmes for the English translation and Gunilla Sjoberg (VTI) for the nal lay-out and appearance of the report. Photographer, Branko,Gothenburg.
Contents
Summary ... .. 9
1 Background and purpose ... .. 11
1.1 The expansion of motoring and its effect on the environment ... .. 11
1.2 How do we travel today and why do people decide to take the car? ... .. 11
1.3 Attitudes and measures that in uence behaviour ... .. 13
1.4 Theory of Planned Behaviour (TPB) ... .. 15
1.5 Purpose ... .. l6 2 Method ... .. 17
2.1 Sample and response frequency ... 17
2.2 Non-response bias check ... .. 17
2.3 Background data of participants ... .. 17
2.4 Procedure ... 18
3 Results - Travel Survey ... .. 20
3.1 Modal split and number of trips ... .. 20
3.3 Reason for the used mode of transport ... .. 21
3 .2 Travel distance ... .. 21
3.4 Purpose of travel ... .. 22
3.5 Shorter trips ... .. 22
4 Results - Attitude Study ... .. 26
4.1 Intention to walk ... .. 28
4.2 Intention to cycle ... .. 29
4.3 Intention to drive a car ... .. 29
4.4 Individual questions and their association with intention ... .. 30
4.5 Intentions to walk, cycle or drive and socio-economic background factors ... .. 33
5 Results A pro le of pedestrians, cyclists and car drivers ... .. 39
5.1 Pedestrians ... .. 4O 5.2 Cyclists ... .. 42 5.3 Car drivers ... .. 43 6 Discussion ... .. 45 6.1 Travel survey ... .. 45 6.2 Attitude Study ... .. 46
6.3 A pro le of pedestrians, cyclists and drivers ... 49
7 Conclusions ... 52
7.1 Encouragement to walk ... .. 52
7.2 Encouragement to cycle ... .. 52
7.3 Changing short car trips into cycling or walking ... .. 53
8 References ... .. 55 Appendix 1
Modes of transport on short journeys: attitudes and behaviour of the inhabitants of Gothenburg by Sonja Forward
Swedish Road and Transport Research Institute (VTI) SE-581 95 Linkoping, Sweden
Summary
During the past 20 years, car traf c in Europe has in-creased at an explosive rate, creating a negative effect both on the environment and quality of life. Interest in environmentally friendly modes of transport has thus increased. Many of our planning actions are behavioural. An important step in the direction ofdeveloping general concepts for the implementation of supportive measures for walking and cycling would therefore be to collect enough background information about the traveller him/ herself. The purpose of this study was to evaluate how well the Theory ofPlanned Behaviour is able to increase our understanding and to produce proposals for moti-vating people to choose a transport mode that is more favourable to the environment.
This study is similar to an earlier study under the name ADONIS, which analysed attitudes to short jour-neys on foot, cycle and car in three European cities (Amsterdam, Barcelona and Copenhagen). ADONIS concentrated on short journeys of up to ve kilometres, since this distance is well suited for cyclists and pedes-trians, and also because a large proportion of car jour-neys in cities are shorter than 5 kilometres.
A random sample of 188 inhabitants in the city of Gothenburg took part in this study, which was carried out by means of a travel diary and a postal questionnaire. The questionnaire was designed in accordance with an expanded version of the Theory of Flamed Behaviour, which included attitude, subjective norm, perceived behavioural control and habit. The travel diary included all transport modes and provided data on journeys car-ried out during one day. The interviewer contacted a number of people by phone and asked questions about trip length, number of trips taken, trip purpose and rea-son. Shortly afterwards, the same group received a questionnaire by post. The questionnaire began with a description ofa scenario in which the subject had to state his/her attitudes regarding three different types oftravel: walking, cycling and driving, starting from home and travelling to a place 2.5 kilometres away. This distance was chosen to facilitate a comparative study of attitudes to the different transport modes.
The results of the travel diary showed that a rela-tively small proportion of short journeys were made on foot or riding the bicycle. Compared with many other
VTI RAPPORT 437A
cities in Europe, car usage in Gothenburg is more com-monplace.
The survey showed that attitudes to walking were positive, provided that the distance felt right, even if darkness and heavy traf c presented a deterrent. In the case of cycling, there was a considerable difference between those who had the intention of cycling and those who did not. The rst group was generally very posi-tive to cycling and the only thing that could prevent them from using the bike was ifthey had a lot to carry. How-ever, the other group had a very negative attitude: the only positive thing about cycling, in their View, was that it could improve their health and that it was good for the environment. In the case of car driving, there was also a strong connection between their attitude and what they themselves intended to do. The group which had no intention of using the car in the near future had a very negative attitude to this. The only advantage they could see was in the comfort offered by the car. Alternatively the group which intended to travel by car was consid-erably more positive, and the only aspect that could persuade them to reduce their car usage was dense traf c or good weather. A difference was also observed be-tween the groups in regard to social pressure. Those who intended to use a certain transport mode also
con-sidered, to a greater extent, that this behaviour was
ac-cepted by others. It was also interesting to note that group pressure in Gothenburg was less than in Amster-dam, Barcelona and Copenhagen when it came to avoid-ing car usage.
To further understand the factors motivating people to use their cars for short journeys, we distinguished the group which on the day of the travel diary only used their cars. For this group, the car was decidedly the best transport mode, even if their attitudes were not exclu-sively positive. They considered that the car was
expen-sive, dif cult to park, detrimental to the environment and
de nitely did not contribute to improving their health. Nevertheless, they used the car since it offered high comfort, speed and a sense of freedom. Although walk-ing was considered more relaxed, it was not as com-fortable and took far too much time. Cycling was a somewhat faster transport mode than walking, but still could not compare with car driving. In addition, cycling
was considered to involve excessive accident and risk of theft. Further analyses showed that the variables in the model helped to explain the mode of transport. In accordance with the Theory of Flamed Behaviour, the effect of socio-economic factors was indirect, apart from gender helping to explain the intention to walk. Women walked more than men, regardless of their oc-cupation, income or education. The variables with the highest explanatory value were perceived behavioural control and habit. Since perceived behavioural control describes the subjective opinion of a person s own re-sources and ability, it may be concluded that non-users experience more obstacles than others. This is also con-nected with experience, which means that resistance to cycling and walking can only be overcome if an indi-vidual gains new, positive experiences in this context.
Thus, we were able to nd that the expanded ver-sion ofthe Theory of Planned Behaviour can advanta-geously be used in the evaluation of different projects and that it helps to increase our understanding ofthe best way of motivating road users to select more environ-mentally friendly mode of transport.
In addition, the following suggestions were presented with the aim of motivating people to choose a mode of transport which is better for the environment.
0 Plan the living environment so that it is easy to walk
to work and to urban centres.
«- Improved lighting along paths and cycleways.
Introduce further measures to reduce traf c. Increase the number of pedestrian precincts. Introduce a system for borrowing cycles. Provide bicycles at places of work. Improve anti-theft protection for cycles. Increase road safety for cyclists.
Increase and improve home delivery services. Expand and improve car rentals.
Encourage car pools.
Give higher priority to environmentally friendly modes of transport and lower priority to the car.
Increase the number ofparking places for cycles and decrease the number of parking places for cars. Increase access by bicycle and reduce access by car. Increase the status ofenvironmentally friendly modes of transport.
Limit space for car advertisements.
1 Background and purpose
Introduction of the motorcar at the beginning of this century, slowly but steadily increased the geographical mobility of populations. In its infancy, the motorcar became a status symbol for only those who could
af-ford one. However, during the 19505, in combination
with economic growth, this situation changed and the number of cars increased vefold. From the political perspective, the motorcar was launched as a symbol of
the welfare state and freedom of movement,
where-upon car density became a measure of a country s pros-perity (Engstrbm, Johansson and Molt, 1993).
1.1 The expansion of motoring and its effect on the environment
In total, there are about 500 million motorised vehicles
in use in the industrialised world today. In Europe, traf-c density over the past 20 years has doubled (Kraay, 1996). In Sweden alone there are more than 3,5 million cars and 80% of the adult population have a driving licence (Engstrém, et. al., 1993). Since 1950, travel in Sweden has increased from an average distance of 10 km per person per day, to at least 40 km today (Vilhelmson, 1992). 60% of all journeys in Swe den are made by car (Annerberg and Widlert, 1997), which is less than Finland s 70% but more than Hol-land, where 45% of journeys occur by car (Hyden, Nilsson and Risser, 1998).
The fact that increased motoring has a negative ef-fect on the environment has been the focus of attention on many occasions. The transport sector is responsible for 40% of the annual consumption of fossilised fuels (Hagring, Ericsson and Odelid, 1996) and 37% of car-bon dioxide emissions (C02) in Sweden (Nilsson, 1995). To cope with the need for more space to absorb the increase in traf c density, also required expansion and redevelopment of the infrastructure, which, according to the Swedish Society for Nature Conservation, dur-ing the 19805 in Stockholm alone, resulted in the loss of a green area equivalent to two city parks (Djurgarden), to asphalt (Peterson, 1988).
In a survey conducted in Gothenburg, 80% of the respondents admitted there were traf c problems (Hyllenius, 1996). The worst aspect was emissions, as well as negative experiences relating to traf c jams and tailbacks. According to an article in Dagens Nyheter (national daily newspaper), queues and tailbacks among road haulage and distribution companies represent an annual loss in income ofbetween 4 6 billion SEK. One road haulier in Stockholm estimated that he wasted 2-3 hours per day stuck in queues (Melander, 1997). In many of the major cities in Europe, the average speed
VTI RAPPORT 437A
by car today is 15 km/hr, which is no faster than a pony and cart (Johnstone, 1998).
Forecasts over the future development of motoring, looking ahead two decades into the next century, show
a continued increase, unless some radical measures are
taken. In regard to the matter of the number of cars on the road, there are de nite signs that the curve will con-tinue to rise. Estimates indicate that distance travelled in Sweden will increase from 40 km to 50-60 km per person per day, which in principle will mean an increase in car density by as many millions (Vilhelmson, 1992). Within Europe, demand for the car has still not declined
nor been satiated, and elsewhere, outside Europe, the
numbers and demand for motorised vehicles have been explosive, while simultaneously there still remains a small minority of those who have access to a car. The asso-ciation between economic growth and owning a car is apparent to all. Countries that experienced economic growth during the '90s have simultaneously and subse-quently seen tra ic density increase substantially.
1.2 How do we travel today and why do people
decide to take the car?
The choice of transport mode for the individual can derive from a decision making process. To understand use ofthe car we therefore must rst study the factors that in uence this. In this section I will try and focus attention on those that use the car and why; at the same time a study is made of the relevance and effect that demographic (gender and age) and socio-economic backgrounds (family circumstances, occupation, in-come) may have.
1.2.1 Who uses the car?
Demographicfactors: About 80% of trips or journeys occur by car. The largest group of car users (41%) belong to the age group 30 49 years old. Men drive more than women. They account for 62% of all car journeys and women 38% (RVU 1995). A contributory factor here is that fewer women have access to a car. In a study of household routines, it was found that
women, to a larger extent, travelled collectively at those times that men used the car (Garling, Saisa and Waara,
1984). A Danish study revealed that Danish female cyc-lists not used this mode through choice but because they did not have access to a car (Jensen, 1994).
Soda-economic factors: Income and occupation are relative to usage of the car. Persons with high status, high positions and high incomes use the car more than others (Dasgrupta, 1983). Income can also help to ex-plain the association between car ownership and the
number of adults in a household. Partners/married peo-ple, with or without children, to a greater extent have access to a car, compared to single parents with or without children. In the category partner/married with children, 95% have access to a car. The corresponding figure for the category partner/married without children, is 90%. This can be compared with 66% for the cat egory single parents with children, and 47% for single parents without children (Riks-RVU, 1997).
1.2.2 What was the purpose of thejourney? There are any number of different reasons for
travel-ling. For the majority of people, a trip or journey is a means of achieving an end result (activities).
Transpor-tation to and from work, leisure activities and shopping are some of the most common reasons for taking the car. In a study conducted in Gothenburg, it was found that 56% of all those commuting to work took the car
(Trafikkontoret, 1994). It has also become more com-monplace to take the car for leisure activities and for
shopping, which in turn is partly responsible for the large increase in car traffic density (Jones, 1993). Many of the journeys made by car in reality have no purpose or could have occurred by alternative modes of transport. An RAC study in England (1990) showed that only 50% of all journeys were essential, whereas 30% weren t. 1.2.3 Why do people choose to take the car? The advantages of a car not only include a convenient and comfortable mode of transportation (Meyer, Levin and Louviere, 1979); Heiden and Rooijers, 1993; Borjesson and Kjellgren, 1993; Lei, Jensen, Nilsson and Herrstedt, 1995) but also that it saves time (Meyer, et.
al., 1979). For short trips or journeys, where the time gains are marginal, it is the convenience aspect that is
the primary reason (Nilsson, 1995; Forward, 1998). The
car is also appreciated for enabling journeys to be made
in peace, in privacy (Meyer, et. al., 1979) and in safety (Heiden, et. al., 1993).
The disadvantages of motoring include parking prob-lems (Knippenberg, 1988; Borjesson and Kjellgren, 1993;
Hyllenius, 1996), restricted access, due to traffic queues
(Borjesson and Kjellgren, 1993), plus its detrimental, contributory effect on the environment (Heiden, et. al., 1993; Borjesson and Kjellgren, 1993).
Apart from the reasons given above, the motorcar also
has a symbolic value, which explains why people choose
it, even if it is not always very convenient or efficient.
1.2.4 The symbolic value of the car
The car represents an ideal, a lifestyle (Saverman, 1990).
It symbolises pleasure, speed, power, freedom and
suc-cess. These are contributory factors why people acquire a car as soon as they can afford one from their
dispos-12
able income, and the last thing they get rid of. A car thus represents both an extension and enhancement of the
human body and presence (Hagman, 1994).
Speed and power: For many people, performance is
the decisive factor when choosing a car. Speed is syn
onymous with vitality and Virility; driving fast gives the driver a sense of power and superiority. By driving a car, a person can suddenly transport himself at a speed that would otherwise be impossible.
Freedom: Inside a car, you can be by yourself, lis-ten to your own choice of music, go wherever you want
to and whenever you want to. A car represents an inde-pendent mode and means of escape, ready to depart or arrive as you wish. The freedom to disappear, and yet also to appear and meet others. A car gives you the op portunity to travel and explore, while simultaneously shielding you within the confines of its familiar, personal shell.
Identity: The type or make of car you drive is often associated with your own person or identity. A car re-ects its owner and indicates if you are individual, in-dependent or unashamedly fearless. An exclusive car model is a reminder that its owner has attained high
sta-tus, that he/she has succeeded in life and is someone to
be noticed. This applies equally to men and women (Golob, 1997). That many women drive smaller, less expensive cars is more related to economy, rather than a lack of interest in driving more expensive, higher
per-formance cars (Source: Saab Automobile in DN, 3/
1-98).
For young drivers, ownership of a car is a means to attaining several goals at the same time: increasing in-dependence from their parents, the freedom to travel and go where they want, either alone or together with friends. A car also helps them to establish an identity and achieve some degree of status. On the whole, according to
Basch, De Cicco and Malfetti, (1987), a car is part of the transition process from juvenile to adulthood. 1.2.5 The social Dilemma
When someone has acquired their own car, irrespective
of the reason why, he/she has simultaneously made a
fundamental and relatively long term choice of his/her mode of transport, in which case he/she will make an increasing number oflonger journeys by car (RAC Car dependence, 1995 ). Taking the car becomes such a habit that people, irrespective of the distances involved, very quickly cease to consider other alternatives.
For many people, the car has thus come to be
re-garded as a necessity. But, as mentioned earlier, car
usage also has a number of negative effects, such as air pollution, trafficjams and tailbacks, noise and occasional accidents.
When people are reminded of this, there appears
what is often regarded as a form of social dilemma , whereby their own interests (convenience, exibility) come into con ict with general or public issues (in-creased environmental pollution). Self-interest is often rated higher than public interest, and this subsequently governs actions (Garvill, Laitila and Brydsten, 1994). The advantages are here and now, the disadvantages there and later.
The question is therefore, how can we induce people to refrain from choosing something that has an immediate, positive effect, for the bene t and health of everyone else? A number of different environmental projects have been planned by the Swedish Government and Parliament, aimed at creating an environmentally-adapted transportation system, additional noise
abate-ment and lower emission levels of carbon dioxide,
ni-trogen oxide and sulphur dioxide (National Road Admini-stration, Report on the Environment, 1994).
We should be able to achieve a substantial reduction in car travel, if most short journeys by car could be transformed into cycling or walking. Several Swedish surveys have shown that 42% of all car journeys in cit-ies are less than 5 km distance (SCB, April-94 to Sept.-95) - a distance well suited to this manner of transpor-tation. According to a Danish survey, the increase in traffic density over the past decade could have been lim-ited to 13%, if cycle traf c during the same period had been allowed to increase by 33% (Lei, et. al., 1995). It is therefore evident that major efforts must be made to change the commuting habits of people. This can be achieved, either through compulsive measures or by trying to change public opinion and attitudes, so that people themselves leave their cars at home, when pos-sible.
1.3 Attitudes and measures that influence behaviour
A person s mode of transport derives from a human decision of a more or less conscious nature.
The major part of our everyday behaviour is in u-enced by our experiences and habits. In spite of this, we are equally capable of consciously carrying out our own courses of action, which thus gives us the free-dom to change our behaviour. More and more people are today becoming environmentally conscious and res-ponsible, women slightly more than men (Hjorthol,
Kolbenstved and Stangeby, 1989), which, in factual
terms for example, have shown that 97% of the Swedish population return bottles and aluminium cans regularly for recycling (Consumers and the Environment, 1994). The reason why this campaign has proved so successful is largely due to introduction of a system of direct cash payments based on deposits. However, other forms ofbehaviour too, such as waste paper collection
VTI RAPPORT 437A
and glass recycling in so-called bottle igloos, have be-come more commonplace, despite no cash incentives being granted. Nine out of ten consumers today also buy environmentally-friendly, branded products, despite these often being more expensive than alternative products (Source: Man s increased interest in the environment, DN 23/1-1998).
This trend indicates that a change in attitudes has occurred: people nowadays talk about recycling rather than wear-and-tear and discard. But will this change also be re ected in shorter and fewer car journeys? Retur-ning bottles or choosing environmentally manufactured products requires a relatively low degree of activity, whereas transition from the car to a more environmen-tally friendly mode of transportation, requires changes of a much more comprehensive and far-reaching nature. A survey by Nilsson (1995) veri es this: 61% of the respondents thought that road traffic was the cause of most air pollution but of these, only 39% were willing to reduce their own use of the car. Golob and Hensher (1997) found that sole drivers in cars were less con-cerned about the threat to the environment than others. In addition, these drivers thought that the problems that exist today, could eventually be solved through techno-logical developments and advances.
Steg and Vlek (1996) pointed out that people must have a certain sense or feeling of kinship with others who advocate change, at the same time as they are con-vinced of the value or worth of their own contributory efforts. Unequivocal ndings show that environmentally conscious behaviour is minimal among those who con-sider responsibility lies with the government or commer-cial interests, whereas it is considerable among those who believe their own behaviour makes a difference (Roberts, 1996). Surveys have also shown that actions in compliance with the interests of the general public presuppose that others too will act in a similar manner. Accordingly, it was found that a higher percentage of
car drivers, who decided to commute to work without
taking the car, in uenced other car drivers to follow suit (Garling and Sandberg, 1990).
The will to use alternative modes oftransport depends not only on the opportunity to do so, but also on whether such alternatives are considered attractive.
1.3.1 Environmentally friendly modes of
trans-port for short trips orjourneys. Walking:
The proportion of pedestrian travel varies between dif-ferent countries: in Spain (Barcelona) this is very com-monplace (33%) (EMO, 1991), whereas in Copenha-gen it is relatively unusual (15%) (National Travel Sur-vey Database, 1995). In general, it seems to have be-come more unusual. The gender and inbe-come of a
son affect the choice to walk or not; women (Wigan, 1995) and those with lower incomes walk more than others (Mitchell and Stokes, 1982). One reason why the percentage ofthose who walk is declining is the signi -cance of longer distances (Adams, 1993). An
accept-able distance for most, is around 1,6 km (Mitchell and
Stokes, 1982: Jensen, 1984), even if some people re-gard a distance of more than 0,8 km as unacceptable (Demetsky and Perfater, 1975).
If the distance is acceptable, then the attitude to walking is extremely positive. People regard it as relax-ing (Heiden and Rooij ers, 1994), pleasant (Wigan, 1995), as well as giving a person a sense of freedom (Heiden and Rooijers, 1994). Factors that could reduce walk-ing, apart from distance, include a pedestrian s fear of danger or risk and personal vulnerability. The main fear of pedestrians is traf c (Mitchell and Stokes, 1982), although the fear of being attacked also plays a role (Wigan, 1995). A survey by Lynch and Atkins (1988), found that it was mainly during the hours of darkness, that 52% of women avoided going outdoors. To coun-teract this fear, street lighting was upgraded at two 10 cations in Glasgow. A year later it was found that pe-destrians felt more at ease in the areas and women now felt safer (Nair, 1994).
Cycling:
Travelling by bicycle varies substantially too, between different cities. In Barcelona for example, less than 1% of alljourneys are by bicycle (EMO, 1991), whereas in Amsterdam it increases to 28% (Ministry of Transport,
1995). In some cultures, the bicycle is not regarded as a mode or means of transport, but rather something associated with play and recreation (Adams, 1993). In many quarters but far from everywhere, cycling has become less popular, Sweden included (Kjessler and
Mannerstrale AB, 1992), and this naturally is associated
with increased motoring. One exception to this is the Netherlands, where use of the bicycle over the past six years has increased by 29% (Simon, 1987). This is partly due to the fact that in the Netherlands they have a well-developed cycling programme, and over the past two decades the bicycle has taken a natural place and position in traffic planning (Hansen, 1995).
In Sweden, it is estimated that 38% of all cyclists are people travelling to work or to school, 31% are rec-reational trips, 16% shopping trips and 15%
miscella-neous. Women in the age groups 19 24 and 40 54,
cycle more than men. Among remaining age groups, the proportions in gender are of equal size (Nilsson, 1995). An acceptable distance to cycle is around 5 km (Lei, et. al., 1995; Stahl, 1996).
Surveys have shown that positive attitudes are com-bined with a high percentage of cyclists, whereas nega-14
tive attitudes are related to a low percentage (Hansen, 1995). The benefits of cycling include convenience 03inch and Morgan, 1985; Taylor, 1996), low cost (Finch
and Morgan, 1985; Lei, et. al., 1995; Taylor, 1996), quickness (Lei, et. al., 1995), fun (Trevelyan and Dick, 1978; Finch and Morgan, 1985; Lei, et. al., 1995; Taylor,
1996), as well as environmental friendliness (Finch and
Morgan, 1985; Lei, et. al., 1995).
Some of the disadvantages ofcycling include the high risk of a bicycle being stolen (Finch and Morgan, 1985; Hansen, 1995), the fact that it is uncomfortable and strenuous to ride (Finch and Morgan, 1985), and dif -cult to transport bulky or heavy loads upon (Forward, 1998)
Another disadvantage with cycling is that it can be considered dangerous (Trevelyan and Dick, 1978; Finch
and Morgan, 1985 ; Hansen, 1995). This fear has been
justi ed on countless occasions, since the risk of a cyclist being injured is 6 times higher per kilometre than that for a car driver (Thulin and Nilsson, 1994). In Gothenburg, cyclists represent 1/3rd of those injured within the city limits, even though they only represent about 2% of the city commuting population (Street Com-mission, 1988), which naturally is of concern to many. The fear of an accident may be the cause of many peo-ple deciding not to cycle (Hyllenius, 1996). Like many other things, it is possible to in uence and reduce the risk of accidents. Two-thirds of cycling accidents are
single accidents, which, on many occasions, are caused
by either faulty bicycle design features or poor mainte-nance (Stahl, 1996). Flows of traf c are another cause. In countries with few cyclists, the risk of an accident is greater than in those countries where cycling is com-monplace (Walcyng, 1998). Thus, the relationship is not linear but starts to diminish when a ow becomes
suf-ciently large.
Both in Sweden and abroad, a number of projects are underway, with the purpose of increasing the fre-quency of environmentally friendly modes of transpor-tation. In spite of creating more cycle lanes in order to increase accessibility and comfort, this does not always result in an increase in Cyclists. To ensure that a project
concludes with the intended effect, an evaluation must
naturally be carried out. This is far from being obvious to others. In many instances, those responsible try to cut costs by either eliminating such a measure entirely, or else limiting its scope to an ineffective degree. Knowl-edge as to how we can in uence people to use environ-mentally fn'endly modes of transportation, is therefore extremely limited. We know that a person s choice of transportation is affected by human decision-taking and that attitudes are important. Despite this, it is not always possible to draw any direct conclusions from surveys conducted on attitudes, since the relationship between
the effect or end result and factual behaviour, in many
cases, has never been tested.
Within psychology today, there exist highly developed models for measuring attitudes. One example of such is the Theory of Planned Behaviour (TPB) (Ajzen, 1985). This model has been used in several surveys and it has been found that it can explain several, different types of human behaviour and phenomena, for exam-ple, such as decisions to have an abortion, to smoke marijuana, to diet and when it s traf c-related issues,
to use a seat belt, exceed the legal speed limit, but also
the choice of mode of transportation (Forward, 1998). In Knippenberg s survey (1988), it was found that the TPB is a useful model for comprehending and predict-ing people s choice of transportation. In other surveys it was found, among other aspects, that a person s in-tention to cycle was best explained with the aid of a speci c variable within the model, namely perceived
behavioural control (Lei, et. a1., 1995, Forward, 1998).
The advantage with using a well-established theory is that the nal outcome will be reliable and that future actions can be predicted.
1.4 Theory of Planned Behaviour (TPB)
According to this theory, one presupposes that a per-son is actively trying to understand and interpret his/her surroundings. A decision to react or not to react is re-garded as the product of careful consideration of the positive and/or negative consequences of an action.
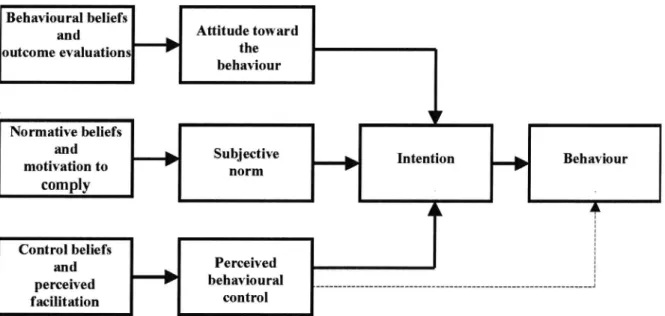
The model describes a person s intention to carry out an action, which in turn is based on attitudes, subjec-tive norms and perceived behavioural control. Additional
variables that are not included in this model, have an
indirect in uence on behaviour by way of attitudes and subjective norms, see Figure 1.
Behaviour, which is a conscious act, is a function of
intention. Intention depicts the motivation of a person, and this in turn demonstrates to what degree or extent a person is committed to achieving a speci c result or
outcome.
Behavioural beliefs
and Attitude toward
outcome evaluations the
behaviour I Normative beliefs and Subjective motivation to norm comply Control beliefs I and Perceived perceived behavioural I facilitation Control I Intention Behaviour I I I l I I I l l I I I I I l I
Figure 1 Theory ofplanned behaviour
Intention is thus the result of an attitude, a subjective norm and perceived behavioural control. The signi cance of these varies, depending on the form of behaviour in question. In some cases it is attitude and/or perceived behavioural control that is more important, whereas in other cases the social norm plays a greater role. These variables are de ned as three independent beliefs, each of which and to a different degree, in uence intention.
VTI RAPPORT 437A
The dotted line between perceived behavioural control and behaviour shows that the association can either be directly or indirectly dependent on the degree of cont-rol. It should be added that perceived behavioural con-trol represents the subjective experience of one s own ability to master a situation, and not the factual. One example of direct association could be two learner driv-ers having different levels of con dence. The one who
rmly believes in his own ability to control and master the car, will probably manage the task; whereas the learner driver who has doubts, will probably give up when problems occur.
A person may have several different beliefs of a spe-ci c action, but it is relatively few that form the
behav-iour. These are known as salient beliefs . Three, dif-ferent salient beliefs have been presented; namely, the behavioural, norm and control beliefs.
I) Behavioural beliefs: attitude is in uenced by be-havioural beliefs and outcome evaluation. A person who believes that implementation of a speci c act will lead to a positive result, is probably positive in attitude, whereas a person who believes the same act will have a negative effect, has a negative atti tude.
2) Normative beliefs: Subjective norms are the sum of what a person considers that prominent people within his/her surroundings, expect him/her to do (i.e. what norms prevail), in conjunction with the person s own will toconform to such. This can be measured through the person in question saying how probable it is that people around him/her approve a speci c form of behaviour; and how important it is for this person to adjust in compliance.
3) Control beliefs: this is associated with perceived facilitation. The greater the amount of information and fewer obstacles a person experiences, the stronger the sense of control. One example of this could be rock climbing. The experience of one s own ability in this case is affected by the amount and type of equipment one has, but acquired skills and know-how also play an important role. The perceived behavioural control is an important fac-tor if the degree of freedom of action is low, and can thus have a direct effect on behaviour. One example of this is smoking: Someone has a negative attitude to smoking and knows that it can lead to lung cancer, which naturally is assessed negatively. Within a person s surroundings, others may condemn his/her smoking, a habit which the person concerned may well wish to give up. Despite this, he/she continues to smoke. The
rea-16
son for this, according to this theory, would have some-thing to do with a perceived sense of control being low. He/she doesn t think it s possible to quit smoking, and even if they tried, that person would be convinced they would fail. This may be based on earlier experiences, either their own or those of others.
Intention plays a central role in this theory, since this is considered to have a direct association with acourse of action.
According to the Theory of Planned Behaviour (TPB), the effect of remaining variables that are not
included in the model, would be indirect. In most
in-stances this assumption has been veri ed, but, when it s a matter of habit, contradictory results have been pre-sented. Several studies have found that the association between habit and intention is many time higher than the association between variables in the model and intention (see Forward, 1994). The same applies to studies on modes of transportation where habit increased the ex-planatory value (Verplanken, Aarts, van Knippenberg and van Knippenberg, 1994).
1.5 Purpose
The continuing development of increased travel in its present form is patently unsustainable. When car usage is investigated it shows considerable growth both inside and outside Europe. It would appear the demand for cars within Europe have still to be fully met. The developed world has seen positive growth for much ofthe late 20th Century, and this is frequently linked to car ownership and usage. However, there has been a price for these countries in terms oftheir ecology. This impact is more obvious in these states than in Sweden nonetheless we should not push the problems aside for we must think globally, we are all responsible for how the future will turn out. At this very moment, we have to carefully consider whether the car journey really is necessary and if it could be performed by some other mode of travel. We must begin to use the car with greater care.
The purpose of this project is to present a theoreti-cal model ofattitudes and a travel survey in order to give suggestions on how to motivate people to change their modes of travel to something which less damaging to the environment but also to discuss how to better fa-cilitate for the use of environmentally iendly modes of travel.
2 Method
This study replicates an earlier study (ADONIS;
For-ward, 1998), where attitudes were analysed regarding
short trips or journeys on foot, by bicycle or by car in three, major European cities (Copenhagen, Amsterdam
and Barcelona).
2.1 Sample and response frequency
With the aid of Telia s telephone directory, a random
selection of 278 citizens and residents of Gothenburg, ranging in age from 21 to 70 years old was made, in the postal code area beginning 41 (central Gothenburg).
A number of persons were then contacted by phone
during April and June, 1997. Table 1 shows how many people were contacted by phone, how many couldn t participate because they were non-drivers, how many were interviewed about 1-day travel trips, and how many of these subsequently returned a questionnaire contain-ing questions on attitudes.
Table 1 Telephone interviews
Contacts Non-drivers Subjects
Questlon-interviewed nai re
respondents
278 38 230 188
Table 1 shows that 278 people were contacted by
tel-ephone. Among these 14% were non drivers and thus
could not participate. Ten other persons declined to par-ticipate for other reasons. 230 people were willing to be
interviewed about l day journeys, and among these 188
also replied to the questionnaire on their attitudes to walking, cycling and driving, which produced a response
rate of 82%. This was more than satisfactory; however,
despite this, we wished to ensure the representative value of the material by means of a non-response analysis.
2.2 Non-response bias check
The non-response analysis was done with the aid of the
travel survey. From this we could see that the categori-cal division in both groups was virtually identicategori-cal, see table 2.
VTI RAPPORT 437A
Table 2 Choice oftransportation mode as a percentage
Walking Cycling Car Other
Group 1 13 13 57 17
Group 2 12 10 57 22
Group 1 = participated in both surveys; Group 2 = participated in only one survey.
Table 2 shows that the choice of transportation mode in both groups was extremely similar. There were a few more persons in group 1 who chose walking and cycling, and a few more in group 2 who used another means oftransportation. Car usage was identical for both groups.
Table 3 Journey frequency among the groups
Walking Cycling Car Other
Group 1 1.9 2.2 3.5 1.9
Group 2 1.9 2.2 2.9 1.9
Group 1 =participated in both surveys; Group 2 = participated in only one survey.
Table 3 shows that the quantity of trips or journeys by different modes of transportation was virtually identi-cal. The only difference was that group 1 made more
trips by car. In summary one can therefore state that
non-response did not digress from the survey groups in the matter of choice of transportation mode and jour-ney frequency.
2.3 Background data of participants
A total of 188 persons participated in this survey, and
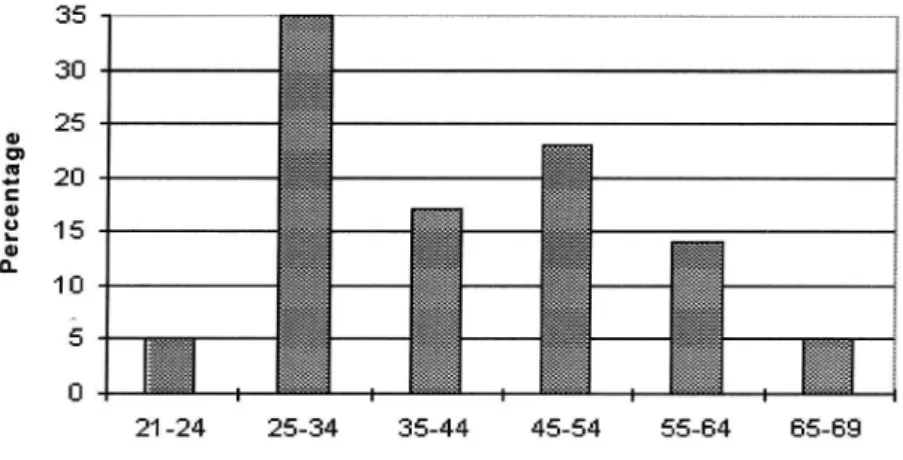
of these 56% were men and 44% women. Participants ranged from 21 to 69 years of age, see Figure 2.
Pe
rc
enta
ge
Figure 2 Age groups among respondents
Figure 2 shows that most respondents were in the age group 25 34. Compared with the total population within the municipality, we can see that in this survey the age
groups 25 34 and 45 54 were over-representative,
whereas age groups 21 24 and 55 69 were
under-:
n v I.
:- '~. ~ -. . '
ms hmr
representative (see Hylleniues, 1996). The women were slightly younger than the men. The educational back-grounds, occupations and income levels of respondents are given in table 4.
Table 4 Education, occupation and income levels of respondents.
Eductlon % Occupation % Income %
Comprehensive 11 Student, unemployed 14 < 100.000 kr 14
education or retired
person
Tech. college 37 Manual work 13 100 - 200 kr 38
University 51 Non-manual work 28 200 - 300 kr 35
Professional 45 > 300.000 kr 12
Table 4 shows that the majority of respondents had a university education, were employed in some form of
profession, and earned between 100,000 300,000 SEK
per year. Compared with the total population within the municipality, the number ofthose with a university edu-cation should be slightly higher in this selection. Women respondents, like in other parts of the country, had had a higher education than the men, but lower incomes. On the other hand there were no differences in the number of hours they worked each week, nor which occupa-tional group they belonged to. In addition, 77% of the participants had access to a car and 73% had access to a bicycle.
18
2.4 Procedure
The survey was conducted by phoning a number of persons and asking them if they possessed a driving li-cence for a car, and if they regularly made short trips (i.e. < 5 km). If the answers to these questions were af rmative, a brief explanation of the survey was then given, followed by an invitation to take part. People were asked about all the trips orjourneys they made (irrespec-tive of distance or mode oftransport) the previous day, with the aid of a travel behavioural survey (see Appen-dix 1). A questionnaire, containing different questions governing attitudes towards different modes of trans-portation, was forwarded to each interview subject
mediately after each phone call (see Appendix 1). Two weeks later, those subjects who had failed to return the questionnaire, were contacted by telephone again.
Both the travel diary and attitude surveys were a di-rect translation ofthe English version, previously used in the ADONIS (Forward, 1998) project.
The travel survey included all modes of transporta-tion during one day. Open questransporta-tions were put to par-ticipants about where theirjourneys began, what the time was when each journey began and ended, what form of transportation was used, if their choice was depend-ent of another trip or journey, what was the purpose of the trip, and what was the primary reason for their choice of transportation. The task of the interviewer was to encode the replies in accordance with a readily prepared
template.
The attitude survey was designed according to the Theory ofPlanned Behaviour , and the questions it contained therein had been formulated with the aid of three pilot studies, carried out in Barcelona, Amsterdam and Copenhagen. In each city, ten persons were invited to discuss different modes of transportation. The most common and frequent assertions was subsequently in-cluded in the nal questionnaire.
Atthe beginning of the poll a scenario was presented, whereby the person concerned was asked to give an opinion on three different forms of travel: walking, cy-cling and driving a car, all of which started from the home to a destination 2,5 km away. A distance of 2,5 km was chosen in order to facilitate a comparative study of attitudes for the different modes of transportation.
Attitude, the subjective norm and perceived
behav-VTI RAPPORT 437A
ioural control are measured by means of a scale graded from 1 to 7, a so-called Osgood scale. Attitude to be-haviour is measured with the aid of bebe-havioural beliefs, which contains eleven different questions (questions 9-l9) and outcome evaluation (questions 31-41). Subjec-tive norms are measured by means of normaSubjec-tive beliefs (questions 24-27) that contain questions relating to friends, partners and family. Perceived behavioural con-trol is measured with the aid of concon-trol beliefs (ques-tions 42-46) which contains five different ques(ques-tions about what factors could make travelling more or less of a probability, and the frequency this occurred (tions 49-53). The section Intention contained two ques-tions (quesques-tions 47-4 8): one if people planned to walk, cycle or drive within the next three or four weeks, and one if they really intended to do the same. The ques-tions were formulated in order to illustrate the degree of distinction between general re ection and true inten-tion. Habit (questions 54-56) was measured by the per-son concerned lling in details about how often they walked, cycled or travelled by car over the past two months. Habit was also measured with a general ques-tion on whether people regarded their choice of travel mode as an automatic act (question 57). A number of questions about people s background were also included, as well as questions relating to personal experience of social pressure (question 28), the behaviour of others (question 29), the in uence of others (question 58), whether they had discussed a choice oftravel mode with family members at all (question 59), plus some general questions about their attitudes (questions 21.23) and their personal sense of control (questions 20 + 30).
3 Results - Travel Survey
This survey is based onjourneys carried out during one day.
3.1 Modal split and number of trips
Figure 3 presents the number of trips as a percentage for the respective modes of travel or transportation. The pie chart illustrates that most subjects in the survey
pri-Nun be r of tr ips
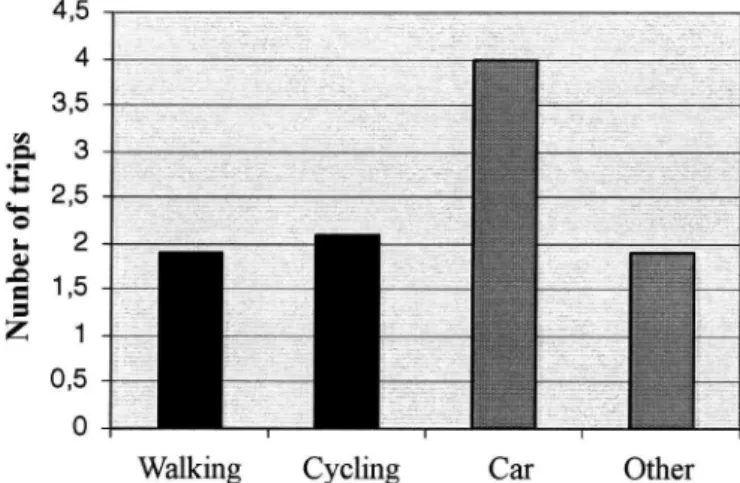
Figure 4 shows that the number of trips made over a single day in the categories Walking (1,9), Cycling (2,1)
O wr hm g
Cycling 13%
Car 59%
Figure 3 Modal Sp]it
marin chose to use acar , followed by other , which comprises either bus, train or tram. Walking and cycling
were equally as common.
Cycling Car Other
Walking
Figure 4 Number oftrips per day: Mean value
siderably more frequent, and those subjects in the sur vey reached a mean value of 4.0 trips by car. and Other (1,9) were very similar. Car travel was
con-1 Car refers to both driver and passengers.
3.2 Travel distance 20 18 16 14 k m D ID -b 0 3 0 3 0
Walking Cycling Car
Figure 5 Average travel distance by different modes of transport.
Figure 5 shows that the average distance travelled was furthest by car (18,5 km), and the shortest distance
3.3 Reason for the used mode of transport
Table 5 gives the most common reasons why people chose to either walk, cycle or go by car, All other
rea-covered by walking (1,9 km). Cycle trips averaged
4,2 km.
sons mentioned and recorded at less than 10% have been excluded from the table.
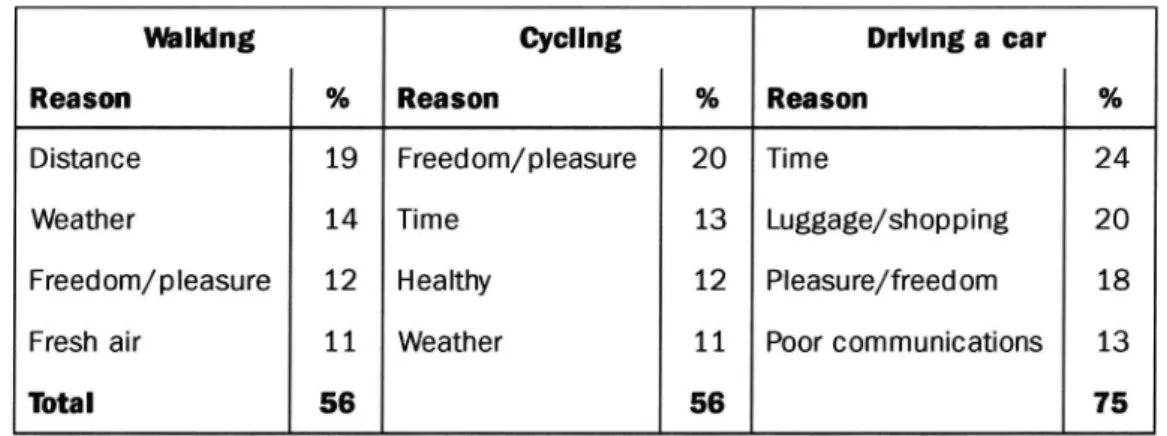
Table 5 Most common reasonsfor choice of travel mode.
Walking Cycling Driving a car
Reason % Reason % Reason %
Distance 19 Freedom/pleasure 20 Time 24
Weather 14 Time 13 Luggage/shopping 20
Freed om/ pleasure 12 Healthy 12 Pleasure/freed om 18
Fresh air 1 1 Weather 1 1 Poor communications 13
Total 56 56 75
In table 5 we can see that the reason for walking involved distance, i.e. a sufficiently short distance, followed by the weather, freedom/pleasure and the intake of fresh air. The most common reason for cycling, was that it was pleasant, it provided some degree of freedom, fol-lowed by being relatively fast, bene cial to health, weather permitting. The most usual reasons why
peop-VTI RAPPORT 437A
le decided to drive, was mainly that it was quicker but also that they had a lot of luggage to carry, to go shop-ping, that it was pleasant and gave people a certain mea-sure of freedom. 13% of the subjects nally mentioned the inadequacy and poor public transport communica-tion systems. Other reasons given were less than 10%.
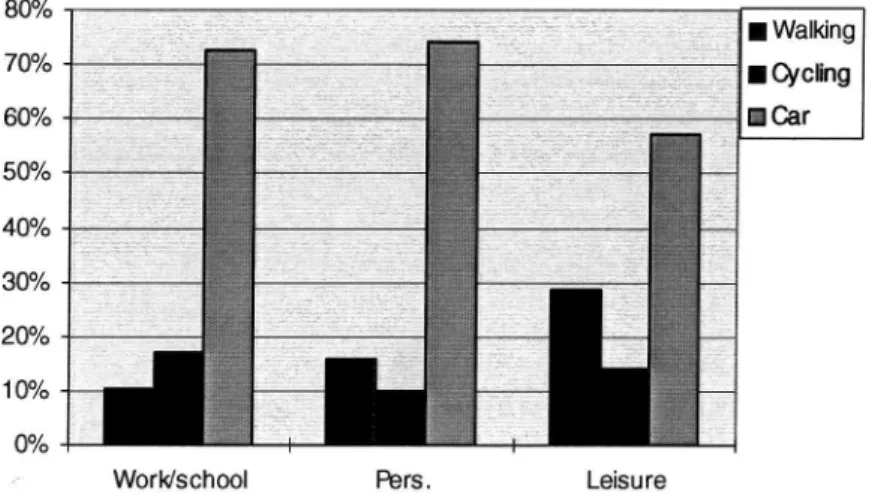
3.4 Purpose of travel
The purpose of travel, which is stated in the travel sur school (2,3,42), personal business (5,6,9) and leisure
ac-vey, was divided into three different categories, work/ tivities (7,8). Figure 6 lists the purpose of travel.
' ' lWaIking
70%
I Cycling
60%
a Car
Work/school Pers. Leisure
Figure 6 Purpose of travel.
The total number of trips to work/school was 172, most 3.5 Shorter trips
ofwhich were by car, then bicycle and nally, walking. During this study, we were mainly interested in shorter
Trips taken to accomplish different tasks totalled 82 and trips or distances (5 km or less), and Figure 7 illustrates
W611 here, mOSt Ofthese inVOlVed a can In these 03368, how distance in uence the choice of transport mode. cycling was the least common alternative. Trips to and
from different leisure activities totalled 63, and most of
these were accomplished by car, followed by walking. Here too, bicycles were the least used.
Other W31km g
Figure 7 Categorical division of trips 5 km or less.
2These numbers refer to the travel survey, Text 1, see Appendix 1.
Figure 7 shows that the frequency of car trips declined from 57% to 42%, and the walking and cycling catego-ries each increased from 13% to 23% and 21% respec-tively. Trips by other transport modes remain relatively unchanged a reduction from 17% to 14%.
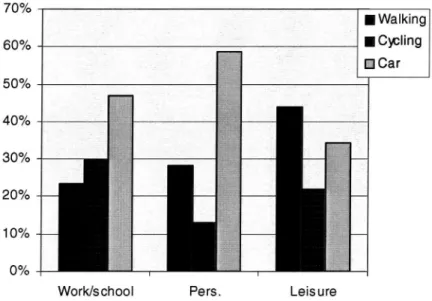
70%
Figure 8 shows the purpose or reasons for the subjects travelling by different means, when the distance was 5 km or less. 60% l Walking l Cycling Car 50% 40% 30% 20% 10% 0%
Work/s chool Pers. Leisure
Figure 8 Purpose oftrip at a distance of5 km or less.
The total number of trips to work/school was 77, most of which were made by car, even if the distances in these cases were less than 5 km. The number of car journeys to and from work/school, which, in Figure 6 reached 73%, has now dropped 26 percentage units to a level of 47%. The number of trips on foot and by bicycle in-creased proportionally in keeping with a reduction in distance. In both cases, the increase reached 13 percent-age units. The number of trips taken to accomplish
per-sonal businesss totalled 46, most of which were
under-taken by car, followed by walking and, to a lesser ex-tent, by cycling. If we compare with the trips given in Figure 6, we noted that the number of car trips declined
VTl RAPPORT 437A
by 15%, and that for the walking and cycling catego-ries, these increased by 12 and 3 percent respectively. The number of trips taken for leisure purposes, at dis-tances less than 5 km, totalled 32; these primarily oc-curred by walking, followed by driving and by cycling. Compared with Figure 6, the number of trips on foot and by bicycle increased by 15 and 8 percent respec-tively, whereas those by car reduced by 22%.
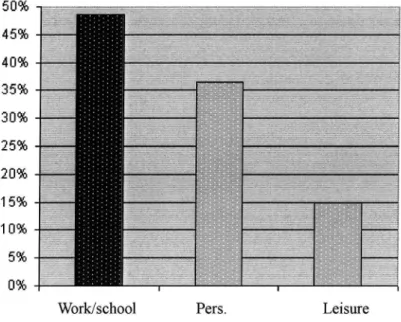
3.5.1 Short trips by car
The following analysis will ascertain the reasons for people driving short distances. Figure 9 gives some of the reasons for these car trips.
50% 45% 40% 35% 30% 25% 20% 15% 10% 5% 0% Work/school Pers.
Figure 9 Purposefor driving 5 km or less.
In Figure 9 above, we can see that from all the short car trips presented, the most common reason for tak-ing the car was travel to and from places ofwork (49%), followed by personal business (36%) and nally leisure activities (15%). Even though Figure 9 lists the purpose or reason for travel, we also wanted for nd out why
Other " 38% Luggage/task 15% Leisure
people preferred to drive rather than use an alternative mode of transportation (see Figure 10). The only pur-pose or reason given in more than 10% of the cases
studied is described here, whereas others are listed
un-der Other 3. Weather 2% Time factor 22%
1 Comfort/freedom23%
Figure 10 Reasons for using a car on trips of5 km or less.
3 Weather = 1, distance = 2, time factor =3, comfort/freedom = 4,6 & 7, luggage/task = 8 & 9, other = 10 42, see Appendix 1, text 2.
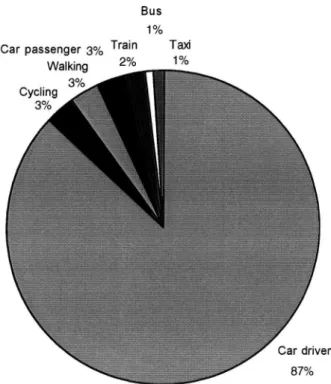
Figure 10indicates that the primary, personal reasons continue to drive during the remaining part of the same
for people taking the car on short trips are: comfort, the day, irrespective of the opportunity to leave the car at
time factor, baggage and nally, weather conditions. home. Figure 11 shows what mode of transport a
per-Several studies have shown that if someone uses a son elects to use during the day, having initially made
car for the rst trip during the day, then he/she will the rst trip by car.
Bus 1%
Taxi 1% Car passenger 3% Train
Walking 2%
3% ,
Cycling 3%
Car driver 87%
Figure 11 Modal choice during remainder of day, following initial trip by car.
In Figure 11, we can see that 87 % of those who used a rest of the day. The divisions for other modes of
trans-car for the rst trip of the day, continued to drive the port were relatively similar and low, between 1 and 3%.
4 Results - Attitude Study
In this study, people were asked if they intended
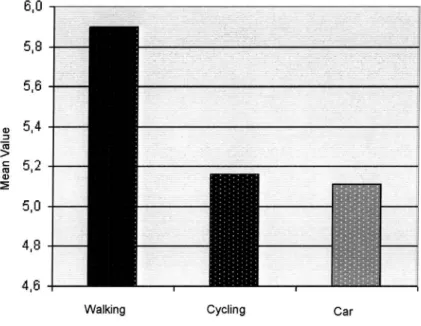
walk-ing, cycling or driving a distance of 2,5 km within the next three weeks. Figure 12 shows the results from thisanalysis.
5,0
5,35
5,5
5,4
5,2 -M e a n Va lue4,3
-4,5 Walking 5I _ V 7 - . u . - . -. Cycling1= De nite No; 7= Definite Yes.
Figure 12 Intentions to walk, cycleor drive a car: Mean values.
Figure 12 shows the mean value of intentions to walk, cycle or drive a car. The majority of the subjects in this study concurred that they would walk (mean value 5,90; SD 1,75) this distance within the very near future. The division between cycling or driving was relatively
bal-anced, even if the intention to cycle (mean value 5,16;
SD 2,32) was slightly higher than the intention to drive
(mean value 5,11; SD 2,34). The standard deviation
26
when it came to either cycling or driving, was higher than 2, which indicates that the group s answers were relatively widespread.
In this study, we were also interested as to which mode of transport was used most regularly. Figure 13 gives the mean values of the habit or behavioural pat tern in question relating to walking, cycling and driving.
M e an va lue 4 h. ) -t In m m : 3 I'll D I Walking Cycling 1 = Never; 6 = Always Car
Figure 13 Walking, cycling and driving habits.
Figure 13 shows that car driving was the most
com-mon (mean value 4,25; SD 1,88), followed by walking (mean value 4,09; SD 1,46) and last, cycling (mean value
3,09 ; SD 1,99). The standard deviation relating to cyc-ling and driving, was about 2, which indicates a rela tively large dispersion among the respondents answers.
According to the Theory ofPlanned Behaviour, vari-ables in the model should illustrate a strong association
with intention. Other variables outside the model,
accord-ing to this, only have an indirect effect. In the followaccord-ing
analysis, we have analysed whether or not this
asser-tion was correct, i.e. about attitudes, subjective nouns
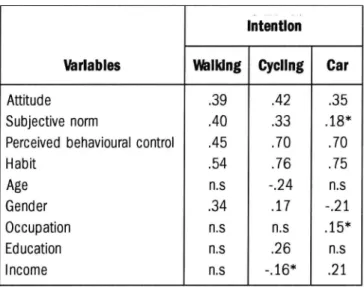
and perceived behavioural control, correlated higher with intention than with the other variables. Since the results were not normally dispersed, we used Spearman s cor-relation coe icient test. Table 6 shows the corcor-relation between variables in the Theory ofPlanned Behaviour, as well as the habit pattern, socio-economic and demo-graphic variables.
Table 6 Correlation between intentions to walk, cycleor drive a car, and variables in the Theory ofPlanned
Behaviour.
Intention
Varlables lllhIklng Cycllng Car
Attitude .39 .42 .35
Subjective norm .40 .33 .18*
Perceived behavioural control .45 .70 .70
Habit .54 .76 .75 Age n.s -.24 n.s Gender .34 .17 -.21 Occupation n.s n.s .15* Education n.s .26 n.s Income n.s -.16* .21
* = signi cant to a level of = < .054. Remainder all signi
-cant to a level of = <.01
4 P <.05 states that the signi cant level is <.05, which indicates that the difference between groups has been accurately determined to 95%.
From table 6, we can observe that the relationship be-tween the intention to walk and variables in the model were strong. We can also see that habit was strongly associated with the intention to walk. Accordingly, we can see that those who intended to walk were more positive to the act, had a higher level of approval from others, better control and had in the past walked far more than those who didn t intend walking. The relationship between the socio-demographic variables and the inten-tion to walk, was slightly lower. The inteninten-tion to walk was not reliant on one s occupation- 3, income level or educational background, but rather one s gender.
Women, in this case, were more inclined to walk than
men.
Variables in the model had a strong af liation with the intention to cycle. In this instance the value for the relationship between perceived behavioural control and intention, was slightly lower than for habit. Other vari-ables that were also correlated with the intention to cycle, were age, education and gender. In general, one could claim that younger people most often women with a higher education, had a higher tendency and intention to cycle than others.
In this study, the women respondents were certainly better educated, younger and had lower incomes than
the men; which, to a certain extent, could explain the
measured association. Additional analyses were con-ducted in order to ascertain the effect of gender. The ndings showed that gender explained the association between income and the intention to cycle. Although, the relationship between education and intention could not be explained by gender.
Correlation between the intention to drive a car and variables within the model, was consistently high. Per-ceived behavioural control was the variable that had the
highest value. In this case, however, a more noticeable connection between habit and intention was indicated,
even though the difference was very slight. Ofthe other variables, gender and occupation were correlated with intention. Here, a connection was found between being
a man and his intention to drive; also those who were
unemployed or students, were less inclined to drives. In keeping with the above analyses, the effect of
gen-der was also checked, but in this case the association
remained.
The aim of this study was to assess the Theory of
Planned Behaviour model, and to ascertain how
effec-tively it could explain the travel habits of people. In the relevant analyses, a regression analysis was used, where intention represents the dependent variable. Three
sepa-rate analyses were conducted; the rst with only vari-ables that exist in the model, i.e. attitude, subjective norm and perceived behavioural control; the second analysis
also included habit and the third, socio-economic and
demographic variables. Table 7 shows the ndings from the rst analysis, and also how effectively the model explained intention to walk a distance of 2,5 km.
4.1 Intention to walk
Table 7 Multivariate Regression analysis ofintention to
walk. Varlabel R2 Beta p Perceived behavioural .33 a: control Subjective norm .23 am Au ude _20 * Total _32 * - <.05; *** - <.001
Table 7 shows the result of the regression analysis where the dependent variable was represented by inten-tion, and the independent variables by perceived behavi-oural control, attitude and subjective norm. 32% of the variance was explained by the following model. The variable that had the highest explanatory value was PBC, followed by subjective norm and attitude, which in prin-ciple were equally explanatory. In the analysis presented
in Figure 8, in addition to the above variables, habit too
was included.
Table 8 Multivariate Regression analysis of intention to
walk.
Variable R2 Beta p
Hab .40 ***
Perceived behavioural _25 "a:
control
Subjective norm _13 **
Total _42
** = <.01; *** = <.001
From the table above, we can see that the inclusion of
habit increased the explanatory value to 42%. Habit be-came the variable which explained most ofthe variance, followed by perceived behaviour control and subjective norm. The nal analysis examined whether socio-eco-nomic and demographic variables, instead of habit, would further increase the explanatory value of TPB, see Table 9.
5 Occupations grades as follows: 1 = unemployed, student, retired person, 2 = manual work, 3 = non-manual work, 4 = Executive position.
Table 9 Multivariate Regression analysis ofintention to walk.
Variable
'
R2
Beta
p
Perceived behavioural .32 * * * control Gender _25 * a: * Subjective norm 20 *4: Attitude _18 a: Total _39 * = <.05; ** = .01; *** = <.001Table 9 shows that gender contributed to the explana-tion of the intenexplana-tion to walk, and the explanatory value increased by 7%, when compared with merely the vari-ables included in the model. On the other hand, gender vanished from the model when habit was also added, thereby becoming not signi cant. Consequently, we can thus state that the intention to walk was best explained by a model that also included the habit variable. Gender was the sole factor of the socio-economic and demo-graphic variables that contributed to the intention to walk.
4.2 Intention to cycle
Table 10 shows the ndings from the regression analy-ses, in which intention was included as the dependent variable; and attitude, subjective norm and perceived behavioural control as independents.
Table 10 Multivariate Regression analysis ofintention to cycle. Varlable R2 Beta p Perceived behavioural _73 *** control Total _53 *** = <.001
In the table above, we can see that the only variable that contributed to the explanation of an intention to cycle, was perceived behavioural control. The analysis pre-sented in table 11, apart from the above, also included the habit variable.
Table 11 Multivariate Regression analysis ofintention to cycle. Varlable R Beta p Perceived behavioural .47 *** control Hahn .37 *** Total _ao *** = <.001
VTI RAPPORT 437A
Table 11 shows that perceived behavioural control was still the factor that explained most of the variance, even though habit was added to the model. Perceived behav-ioural control and habitjointly explained 60% o the vari-ance. Even though the socio-economic and the demo-graphic variables were tested, it was not found that ei-ther ofthese contributed to the explanation of intention to cycle a distance of 2,5 km. The conclusion from this
here too, is that the variables in the TPB theory, in
con-junction with habit, is the model that most effectively explains why people intend to cycle.
4.3 Intention to drive a car
Table 12 shows the results from another regression analysis, where intention was included as the independ-ent variable, and attitude, subjective norm and perceived behavioural control, were included as the independent variables.
Table 12 Multivariate Regression analysis of intention to drive a car. Variable R2 Beta p Perceived behavioural _75 a: conUol Total _53 *** - <.001
In table 12, we can see that the perceived behavioural control accounted for 58% ofthe variance. The remain-ing variables vanished from the model. In the followremain-ing analysis, another variable was added, namely habit.
Table 13 Multivariate Regression analysis of intention to drive a car. Variable R Beta p Habn .47 *** Perceived behavioural .43 as control Total 39 *** = <.001
Table 13 shows that habit was the variable that explained most of the variance, closely followed by perceived behavioural control. Jointly, these two variables ac-counted for 69% of the variance. The socio-economic and demographic variables were tested also and the nd-ings showed that neither of these contributed to expla-nation. In keeping with the other cases, the conclusion
will thus be, that TPB in combination with habit, is the
model that provides the best explanation of intention to drive a car.
Attitude, subjective norm and perceived behavioural control are in uenced by so-called salient beliefs .
Three different beliefs are described; behavioural beliefs,
normative beliefs and control beliefs. In the survey these are illustrated by means of different questions to the subjects. The behavioural beliefs comprised eleven ques-tions, the normative beliefs comprised three questions and the control beliefs, seven questions. Inorder to comprehend what lies behind people s behaviour, these questions were subjected to in-depth analysis.
4.4 Individual questions and their association
with intention
The next step was to survey the association between the different beliefs and intention. This analysis was conducted in two stages: 1) association between beliefs and intention were tested with the aid of Spearman s correlation coe fzcient test. 2) Those beliefs considered to be signi cant in accordance with analysis in stage 1, were included in the next stage, whereby the differences
between those who had intended to use aspeci c trans-port mode (group A), were compared to those who hadn t intended to do so (group B). The division among these two groups was based on their replies to the ques-tion of intenques-tion, of which group A had replied in the af rmative (5-7), whereas group B had given a
nega-tive answer (1 3,9). The intermediate group that had
replied neither/nor were excluded from this analysis. The difference between these two groups was tested by means of a so-called T-test which measurethe dif-ference between mean values.
4.4.1 Factors that influence intention to walk. In the regression analysis, we found that perceived
be-havioural control, subjective norm and attitude,
ac-counted for 32% of the variance. Table 14 shows the ndings from the T-test, besides demonstrating the dif-ferences between the two groups, together with corre-lation between beliefs and intention.
Table 14 Association between intention to walk and individual questions, and the di erence between group A and
B: Mean values.
Question Intention Group A Group B
r (Intent) (Unintent) p
(n=188) (n = 138) (n = 26)
Control I would be more or less likely to drive a distance of
beliefs approx. 2.5 km in the next three to four weeks if:
there was very heavy traffic .46* * 4.94 2.54 * * *
it was nice weather .45** 5.68 3.42 * **
it was in the evening .23** 4.05 2.85 **
you had a lotto carry .19* 2.04 1.19 ***
Normative These people would strongly approve/strongly
beliefs disapprove of me engaging in this activity?
Friends .20** 6.33 5.65 n.s
partner .31** 6.39 5.33 **
Family .29** 6.50 5.58 *
Behavioural If I carried out the suggested journey then it will:
beliefs be good for your health and physique? .24** 6.58 5.85 *
be thoroughly enjoyable? .19* 3.59 2.73 *
make you more relaxed? .35** 5.60 4.16 **
increase your sense of freedom? .31** 5.46 3.96 **
help to improve the environment? .26* * 6.76 5.85 *
increase the accident risk to you in traffic? -.216** 3.03 4.08 **
The higher the mean value, the greater a subject s af rmation ofthe assertion (maximum value 7). * = <.05 ; ** = <0 1; ** * = <.001; n.s = not signi cant; r = correlation value the higher the value, the stronger the
association.
From table 14, we can see that the replies to the ques-tions as to the possibility ofwalking or not walking, Show a striking difference between the two, separate groups. Those subjects in group A (intentional) who replied and
indicated their intention to walk within the near future,
30
were also more inclined to do so in heavy traf c and in good weather; compared with those in group B (unin-tentional) who didn t feel inclined to do so. In the latter group there were strong signs of reluctance to walk in view ofthe prevailing conditions, and in particular ifthey