Master’s Thesis
Mechanical, Microstructural and Corrosion performance
for MIM materials based on coarse (-45µm) powders of
ferritic stainless steel
Master Thesis Student: Mr. Syed Ali Afraz
Project Supervisor: Mr. Jens Rassmus
Project Sponsor: Ms. Anna Larsson
Examiner at KTH: Dr. Anders Eliasson
I
Abstract:
The purpose of this research is to investigate the mechanical, microstructural and corrosion performance of the ferritic stainless steel coarse powders, used in Metal Injection Molding (MIM) process. Three coarser powders made by Höganäs AB, were examined along with a commercially available fine MIM powder and samples from sheet metal. The studied
powders were individually mixed with binders and then injection molded in the shape of dog bone shaped tensile bars. These green samples were then debinded and sintered to examine under different characterization methods. The methods used for examining the samples were tensile test, hardness test, metallography, SEM, chemical analysis, and salt spray test. After a comparative study of these different materials, it turns out that the chemical composition and the process parameters have more effect on materials properties
compared to only particle size distribution in studied materials. After this study, 434 coarse powder was preferred upon the PolyMIM 430 fine powder, because of its lower price and same performance as that of PolyMIM 430.
II
Acknowledgement:
This master thesis work was carried out at Höganäs AB, from March 2012 till August2012. I would like to thank, Mr. Jens Rassmus, for supervising this project and Ms. Anna Larsson, for her technical expertise and for sponsoring this project. Dr. Anders Eliasson, supervisor and examiner at KTH, is also appreciated for his help and support. I would also like to thank all the employees of Höganäs AB, who helped me throughout this project.
III
Table of Content:
1 INTRODUCTION: ... 1
2 METAL INJECTION MOLDING: ... 3
2.1 FEEDSTOCK MIXING: ... 3 2.2 INJECTION MOLDING: ... 5 2.3 DEBINDING: ... 5 2.4 SINTERING: ... 6 3 EXPERIMENTAL METHODOLOGY: ... 7 3.1 MATERIALS: ... 7 3.1.1 410: ... 7 3.1.2 430: ... 7 3.1.3 434: ... 7 3.1.4 REFERENCE POLYMIM 430: ... 7
3.1.5 STAINLESS STEEL SHEET MATERIAL: ... 8
3.2 SIEVING: ... 8 3.3 TAPPED DENSITY: ... 10 3.4 PYCNOMETRIC DENSITY: ... 11 3.5 FEEDSTOCK MIXING: ... 11 3.6 INJECTION MOLDING: ... 12 3.7 DEBINDING: ... 12 3.8 SINTERING: ... 13
4 EXPERIMENTAL RESULTS AND DISCUSSION: ... 14
4.1 DEBINDING AND SINTERING PROPERTIES: ... 14
4.1.1 WEIGHT LOSS: ... 14 4.1.2 DIMENSIONAL CHANGES: ... 15 4.1.3 SINTERED DENSITY:... 16 4.2 METALLOGRAPHIC ANALYSIS: ... 16 4.2.1 POROSITY: ... 17 4.2.2 MICROSTRUCTURAL ANALYSIS: ... 18 4.2.3 GRAIN SIZE: ... 18 4.3 MECHANICAL TESTING: ... 19 4.3.1 TENSILE TESTING: ... 19 4.3.2 HARDNESS TESTING: ... 20 4.4 CORROSION ANALYSIS: ... 21
IV
4.4.1 SALT SPRAY TEST FOR CORROSION: ... 21
4.4.2 LIGHT OPTICAL MICROSCOPY (LOM): ... 31
4.4.3 SCANNING ELECTRON MICROSCOPY (SEM): ... 32
5 PROBLEMS AND DISCUSSION (POSSIBLE ERRORS): ... 34
6 CONCLUSION: ... 37
6.1 FUTURE WORK: ... 37
7 REFERENCES: ... 38
1
1 Introduction:
Powder Injection Molding (PIM), which encompasses Metal Injection Molding (MIM) and Ceramic Injection Molding (CIM), is a major manufacturing technology with estimated sales of more than $1 billion.
PIM is a truly global business, with nearly 400 parts producers located worldwide. According to recent data, Asia is the world’s largest PIM producing region by sales, followed by Europe and North America. [1]
PIM, particularly MIM parts have major applications in automotives industry, medical and dental parts, firearms application and consumer products. MIM parts production accounts for around 90% of the market for PIM products, which is seeing annual growth of between 10-20% worldwide. Some of the regional variation in MIM applications is shown in Figure 1.
Figure 1: Regional concentration of MIM applications [1]
MIM basically uses fine powder particles (with 10µm particle median) whereas PM (Powder Metallurgy) uses powder of median size 50-100 µm. PM is more used for 2D-shaped
component manufacturing and usually MIM is used for more intricate, complex and 3D-shaped components. Unlike PM made components, MIM made components have higher
2
density (93-97%). Components made by MIM are relatively expensive because of the expensive equipment, higher process cost and higher material cost.
There have been some studies done to use coarser powder to reduce the material cost for MIM process. These studies show that by increasing particle size, the quality of the
components decreases. This is due to the fact that finer particles have higher surface area, which gives higher surface interaction among the particles and hence giving higher density during sintering. That is one of the reasons for good mechanical properties of these
components. But coarser powder particles can be used for manufacturing components which does not require higher performance and the cost of these components can be lowered. [2]
This project is done to see if coarser powder can be used for MIM process, to reduce cost for stainless steel grade components and to check the corrosion performance of these
materials. For that regard, 410, 430 and 434 stainless steel powders, produced by Höganäs AB, were used for MIM process. For reference materials, commercially available PolyMIM 430 stainless steel feedstock and samples cut from sheet metal were used. Sheet metal is used to check the pitting corrosion and for checking pitting corrosion on samples with no porosity.
3
2 Metal Injection Molding:
Metal injection molding (MIM) process includes four major steps, which are explained below:
Feedstock mixing
Injection molding
Debinding
Sintering
All these steps are shown in Figure 2 and are explained afterwards.
Figure 2: A flow chart of MIM process. [3]
2.1 Feedstock mixing:
Feedstock mixing is done to get a homogeneous mixture of polymeric material (commonly known as binder) and metal powder. Binders are used to get good moldability of metal powders. The mixture should be homogenized without any separation or segregation of materials. The blend of metal powder and binder is mixed in hot state until the metal powder particles are coated with the binder. After mixing for a specific amount of time, the mixture is taken out of the machine and allowed to cool. As it gets cold and hard, it is then ground to get feedstock pellets which are then used for molding in MIM machine. Binders
4
are usually 15-50 vol. % of the feedstock mixture. The vol. % binder depends on the solid loading of feedstock. Eq. 1 is used to calculate the critical loading for feedstock mixing, and optimal solid loading is usually 2.5% less than critical loading.
( ) eq. 1 The parameters for feedstock mixing process are mixing time, temperature, powder particles’ size & shape, formulation of binder system, shear rate, sequence of materials’ addition, and solid loading. During feedstock mixing, a rheological graph is made, which shows the change in temperature and torque with respect to mixing time. In the rheological graph shown in Figure 3, it can be seen that with every addition of input blend (binders and metal powder), the temperature of mixture decreases and the torque increases, until the solid loading point occurs where there are no significant changes in torque and temperature. A properly mixed feedstock consists of uniformly dispersed metal powder in binder without having internal porosity or agglomerates. If it is an inhomogeneous mix, it will cause non-uniform viscosities, uneven molding and improper sintering. To get good mixing, higher shear is preferred, but not too high to damage powder particles or overheat (degrade) the binder. Small or irregular particles require more time to mix homogeneously and there are more chances of getting agglomeration. After selecting the powder size/shape, binder system and procedure of mixing, feedstock density is set to get the maximum homogeneity. The effect of input material on the torque can be seen in the Figure 3, the torque acting on mixing blades is higher when the binder isn’t in molten form and torque gets uniform, when the mix gets homogenized.
5
2.2 Injection molding:
Injection molding process is carried out after feedstock is homogeneously mixed. The feedstock (at ambient temperature) is grinded first and then put in the feed hopper of MIM machine.
Figure 4: A typical illustration of a MIM machine [5].
In the Figure 4, different parts of the MIM machine can be seen and the feedstock moves from hopper to mold in the following way.
The pellets of feedstock go to the barrel when the screw is rotating and this feedstock is melted in the barrel because of the heaters on the circumference of the barrel. As the feedstock passes through the barrel, it undergoes some frictional forces between the threads of the screw and the internal wall of the barrel. These frictional forces also raise the temperature of the barrel but its effect is relatively smaller than the temperature rise because of heaters.
After homogeneously plasticize the feedstock, it is ready for molding. The mold of MIM machine is joined to the barrel containing feedstock via sprue. When some feedstock accumulates on front of screw in barrel, it is then injected into the mold via sprue. A set amount of pressure is then applied on the feedstock in mold by the screw, which helps feedstock to properly fill the cavity of the mold. Then the screw rotates in backward direction and fills in the feedstock from hopper for next injections. In the meanwhile, the injection molded component is allowed to cool down by the help of cold water tubes in the mold. After cooling time is finished, the mold opens by the help of hydraulic system and the molded component is ejected from the cavity by ejector pins.
2.3 Debinding:
Debinding is done to remove the binder from the green parts which are taken out of injection molding machine. A binder usually have three components; backbone (which provides strength to the molded part), surfactant (which acts as a bridge between the binder and metal powder) and a filler part (which acts as plasticizer).
6
Debinding can be done in a number of ways, but the three main categories are; solvent debinding, thermal debinding and catalytic debinding. Debinding is a delicate process and debinding method depends on the filler part of binder system. The removal of binder happens in two steps; first during debinding and then during pre-sintering cycle. The filler part of binder system is removed during first stage of debinding and the rest of the binder including backbone polymer is removed during pre-sintering cycle. Backbone binder actually helps in handling the component after debinding and before sintering.
2.4 Sintering:
After debinding, the samples are sintered in order to get good mechanical properties. The powder particles fused together during the sintering process. Sintering temperature for a material is always less than its melting point. Figure 5 shows the progress in fusion of particles during sintering process:
Figure 5: A typical illustration of sintering process [6].
After keeping the samples in sintering condition for a reasonable time, the samples are taken out with some porosity. The amount of porosity depends on the temperature and time of sintering. Porosity decreases with increase in sintering temperature and time. The engineering properties increase with increase in sintering temperature or time. But over-sintering (i.e. providing too high temperature or too long time) occurs after the properties reached the peak and starts to decline because of microstructural changes.
The surface curvature and the surface area of the powder particles provide the driving force for sintering. And during sintering, as the surface area and curvature of particles decreases, it slows the sintering processes as well. During sintering process, the shrinkage of the samples occurs. This happens because the pores created during debinding tend to close by the fusion of particles. Some pores are filled completely and some are left slightly, these left ones define the porosity of the material. During sintering, the density of the samples
increases because of this volume shrinkage. The pores between the particles are filled also by the redistribution of material during sintering process.
7
3 Experimental Methodology:
The sample manufacturing method for this master’s thesis project was performed in the following order: Materials Sieving Tapped density Pycnometric density Feedstock mixing Injection molding Debinding Sintering
All the stages of this methodology are briefly described.
3.1 Materials:
The materials used, in this project work, were taken from Höganäs AB as well as some commercially used materials. Three different iron based powders were taken from Höganäs AB. Their names and properties are given below:
3.1.1 410:
It falls in the category of ferritic-martensitic stainless steels. The general chemical composition of 410 is shown in Table 1. It is a heat treatable stainless steel. It is more hardenable than 430 & 434, shows good hardness but less corrosion resistant. It is a ferro-magnetic grade of stainless steels. [7]
3.1.2 430:
It is a ferritic stainless steel and its general chemical composition is shown in Table 1. As it has more Cr content, so it is more corrosion resistant than 410 stainless steel. It is also ferro-magnetic and show good ferro-magnetic properties. It has good formability and is used in
decorative applications. It is the most popular non-hardenable chromium stainless steel. [7]
3.1.3 434:
It is a modified version of 430 with addition of Mo, which increases its corrosion resistance performance. The general chemical composition of 434 is shown in Table 1. It shows good oxidation resistance up to 800⁰C. It is ferro-magnetic and has good formability as well, which is because of its good ductility. Primarily used in automotive trim applications and other exterior environments. [7]
3.1.4 Reference PolyMIM 430:
The reference PolyMIM 430 has fine powder particles in it and the chemical composition is shown in Table 1, according to the feedstock datasheet.
8
Table 1: General chemical composition (in mass %) of all the stainless steels used.
Fe C Cr Mo Mn Ni Si P S
410 Balance <0.15 12.0 - - 0.75 - - -
430 Balance <0.12 17.0 - - 0.75 - - -
434 Balance <0.12 17.0 1.0 - 0.75 - - -
Ref 430 Balance <0.12 16.0 - 18.0 - <1.0 - <1.0 <0.04 <0.03
Some properties are quite different from the 430 coarse powder taken from Höganäs AB because of the particle size difference. This material is denoted as ‘Ref 430’ in this report. 430 and 434 are ‘L’ grade stainless steels because of their Carbon content lower than 0.12%.
3.1.5 Stainless steel sheet material:
Stainless steel 430 sheet was cut into tensile bar samples by water jet cutting method. The dimensions of the design were taken as to equate the surface area of sintered samples. The design shown here was made with all measurements in millimeter (mm) and surface area of these samples were kept same as that of the sintered samples (which was 1280mm2). The design used for cutting the sheet metal is shown in Figure 6. The general chemical
composition of sheet metal is same as that of regular 430 stainless steel and can be seen in Table 1.
Figure 6: Design for making tensile bar samples from sheet metal
3.2 Sieving:
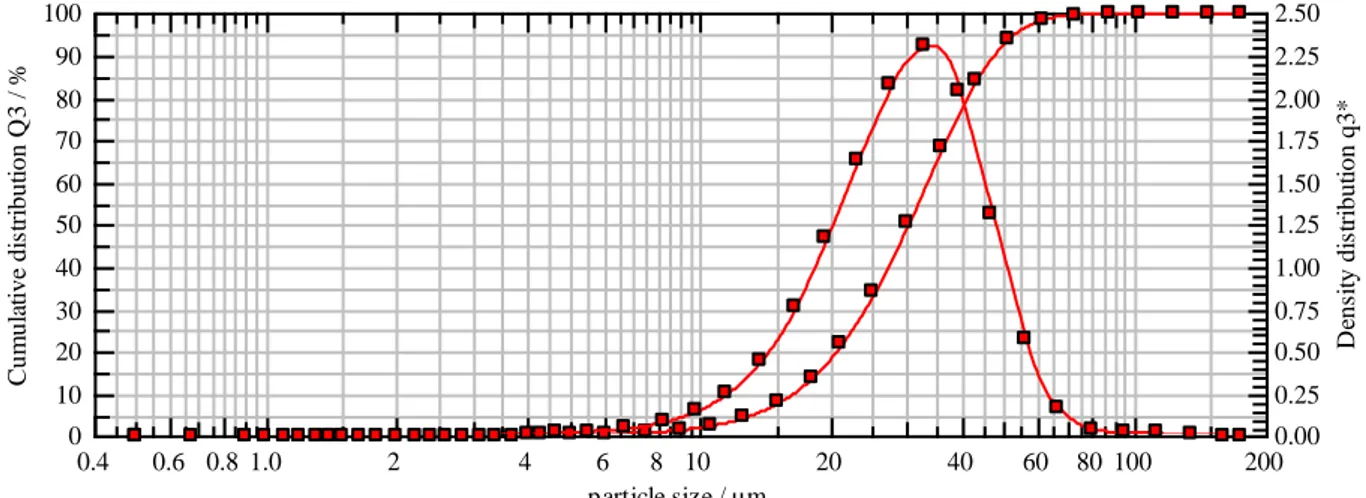
410 and 434 powders were sieved by using two different sieves to get -45µm sieve cut powder. But 430 powder was already -45µm production sieved. So there was some difference in powder particle size distribution (PSD) between recently sieved (410,434) powders and already sieved 430 powder. This difference certainly created a little variation among the coarser powders and can be seen in some of the results. The particle size distribution (PSD) of coarser (-45µm) powders are shown in Figures 7, 8 & 9.
9
x10 19.03µm x50 36.72µm x90 61.44µm SMD 31.53µm VMD 39.25µm
x16 22.23µm x84 55.77µm x99 97.19µm SV 0.19m²/cm³ Sm 1903.10cm²/g
Figure 7: PSD of 410 powder, which was recently sieved.
x10 16.17µm x50 29.97µm x90 47.89µm SMD 25.85µm VMD 31.34µm
x16 18.90µm x84 42.97µm x99 68.50µm SV 0.23m²/cm³ Sm 2320.93cm²/g
Figure 8: PSD of 430 powder, which was production sieved.
0 10 20 30 40 50 60 70 80 90 100 C um ul at ive d is tri bu ti on Q 3 / % 0.00 0.25 0.50 0.75 1.00 1.25 1.50 1.75 2.00 2.25 D ens it y di st ri bu ti on q 3* 0.4 0.6 0.8 1.0 2 4 6 8 10 20 40 60 80 100 200 particle size / µm 0 10 20 30 40 50 60 70 80 90 100 C um ul at ive d is tri bu ti on Q 3 / % 0.00 0.25 0.50 0.75 1.00 1.25 1.50 1.75 2.00 2.25 2.50 D ens it y di st ri bu ti on q 3* 0.4 0.6 0.8 1.0 2 4 6 8 10 20 40 60 80 100 200 particle size / µm
10
x10 19.87µm x50 37.14µm x90 59.95µm SMD 32.09µm VMD 39.19µm
x16 23.12µm x84 54.66µm x99 93.09µm SV 0.19m²/cm³ Sm 1869.99cm²/g
Figure 9: PSD of 434 powder, which was recently sieved.
These PSD graphs show that there is some difference in median between the 430 powder (production sieved) and 410 & 434 powders (recently sieved). Although the mesh size, for the -45µm sieve used in laboratory and one used in production plant, is the same. But there may be some difference in the process parameters, which would result in this particle size variation. There might be some sort of tiny holes in laboratory sieves which might have let through the coarser particles while sieving. There is a possibility that during production sieving, some undersize powder particles might have flown out of the sieve alongside the oversize particles, causing a variation from laboratory results. These possible differences can be seen in some of the characterization results shown later in the report.
3.3 Tapped density:
The tapped densities of the powders were measured using the “Jolting Volumeter” and the apparent densities were measured by “Hall Flowmeter”. At first apparent density was calculated by filling a density cup of known volume (i.e. 25.04cm3) without applying any pressure/force on it. Then the powder from this cup was taken out and weighed its mass. By dividing this mass by the known volume (i.e. 25.04cm3), the apparent density was calculated. In order to measure the tapped density, ISO 3953 standard was followed. 100g of powder was weighed and put it in to the graduated cylinder. The cylinder was placed on to the holder of Jolting Volumeter. 3600 taps were set and started the machine. The machine lifts cylinder to 3mm and drop under its own weight during one tap. The machine does 250 taps in one minute [8]. After 3600 taps the volume of the powder is measured from the
graduated cylinder. By dividing 100g mass of powder by this tapped volume, tapped density is calculated. The results of apparent and tapped densities are shown in Table 2.
0 10 20 30 40 50 60 70 80 90 100 C um ul at ive d is tri bu ti on Q 3 / % 0.00 0.25 0.50 0.75 1.00 1.25 1.50 1.75 2.00 2.25 2.50 D ens it y di st ri bu ti on q 3* 0.4 0.6 0.8 1.0 2 4 6 8 10 20 40 60 80 100 200 particle size / µm
11
Table 2: Apparent and tapped densities of coarser powders.
3.4 Pycnometric density:
Gas expansion pycnometer uses helium gas (which acts as ideal gas) for the measurement of pycnometric density. It has two chambers; one used as reference and other for sample handling. The basic principle of this method is that helium under pressure takes up the volume of the chamber. The more the volume taken by helium means more the pressure of gas. So by measuring the pressure difference of the gas, the volume taken by the sample can be calculated. The mass of the sample is measured before placing it in chamber, by using mass balance. The built-in program asks for mass and does all the calculations by itself, hence giving the pycnometric density of the sample. The results obtained are shown in the Table 3. [9]
Table 3: Pycnometric density of coarser powders.
Samples Mass (g) Avg. Volume (cm3) Avg. Density (g/cm3)
410 15.80 2.08 7.60
430 17.99 2.37 7.60
434 15.71 2.07 7.58
Some more information on gas pycnometer along with detailed results from it, are given in the Appendix I.
3.5 Feedstock mixing:
The results gathered from PSDs, tapped density and pycnometric density, were used for the formulation of binder system and solid loading. Then, feedstock mixing was done using a binder system and stainless steel powders. Binder system consists of filler and backbone polymer. Some amount* of binders were taken and mixed manually in a beaker. After getting a homogenous mixture, 75 %wt. of metal powder was added in the beaker. After getting it homogenized mixture in beaker, this blend was added in kneader of feedstock mixer. Feedstock mixing was done with solid loading of 51 vol. % and 11.7 %wt. binder system. Mixing was done at 140⁰C and at 40rpm. After 15 minutes, the rest of 25 %wt. metal powder
*
The specific binder recipe is not disclosed in this master’s thesis report because of research’s confidentiality.
Method Properties 410 430 434 Mass (g) 76.39 76.99 73.34 Apparent Volume (cm3) 25.04 25.04 25.04 Density (g/cm3) 3.05 3.08 2.93 Mass (g) 100.00 100.00 100.00 Tapped Volume (cm3) 25.00 26.23 25.73 Density (g/cm3) 4.00 3.81 3.89
12
was added directly into the kneader. After 75 minutes of feedstock mixing, the mix was taken out and allowed to cool. After the mix cool down to ambient temperature, it was ground into pellets for injection molding process.
3.6 Injection molding:
The injection molding parameters changes with changing binder system in feedstock mixing. So, injection molding parameters for 410, 430 and 434 were different from the parameters used for Ref430.
The coarser powder (410, 430 & 434) feedstock was injection molded with nozzle
temperature at 140⁰C, cylinder temperatures of 135⁰C, 135⁰C, 125⁰C while tool temperature was kept at 25⁰C and hopper temperature was held at 25⁰C. Injection speed was kept at 5cm3/s with 16cm3 volume of feedstock for injection. Screw’s circumferential speed was kept at 140mm/s. 3000bar of max injection pressure, 1200bar of after pressure and 10bar of packing pressure was taken for these feedstocks. 20 seconds were given as cooling time before the opening of tool after the injection.
The ‘as received Ref 430 feedstock’ was injection molded with nozzle temperature at 187⁰C, cylinder temperatures of 184⁰C, 180⁰C, 175⁰C while tool temperature was kept at 50⁰C and hopper temperature was held at 35⁰C. Injection speed was kept at 20cm3/s with 15cm3 volume of feedstock for injection. Screw’s circumferential speed was kept at 166mm/s. 3000bar of max injection pressure, 600bar of after pressure and 25bar of packing pressure was taken for this feedstock. 5 seconds were given as cooling time before the opening of tool after the injection.
It should be noted that small variations in the parameters were applied accordingly, if the molding samples started to have defects after some number of injection cycles.
3.7 Debinding:
Solvent debinding was performed on coarse powder samples with an organic-solvent in a water bath. The water bath was kept at a temperature of 50-60⁰C and a container (Beaker) filled with organic-solvent was placed in the water bath. Solvent container was separated from the walls and bottom of water bath by a support. Water bath was used to gradually increase the temperature of solvent and keep it homogenized. The samples were placed on a wire gauge grid and each sample was separated from the other one. This wire gauge was then fully immersed into the organic-solvent container placed in water bath. The container was closed by glass lid to avoid evaporation of solvent. The samples were kept in this container for 14 hours and then taken out and dried.
For debinding Ref 430 samples, distilled water with the addition of 2% corrosion inhibitor was used as solvent. Debinding temperature was maintained 60⁰C for 10 hours in an oven. After debinding, the samples were dried for 2 hours at 100⁰C in a laboratory oven. All the results of weight-loss and dimensional changes, during debinding process, are discussed later in the Experimental results and discussion section.
13
3.8 Sintering:
Sintering of debinded samples was done with 100% dry Hydrogen gas and non-metallic base in a batch furnace. The temperature profile used for sintering is shown in Figure 10 below:
Figure 10: Temperature profile (sintering cycle) used for sintering.
The results of shrinkage in volume, dimensional changes and sintered density are shown later in Experimental results and discussion section.
25 300 300 600 600 1350 1350 0 200 400 600 800 1000 1200 1400 1600 0 92 122 222 342 492 612 1000 Tem p ( °C) Time (min)
Sintering Cycle
Degassing (30 min) Degassing (120 min) Sintering (120 min)14
4 Experimental results and discussion:
The experimental work and measurements that were performed on the studied samples are as follows:
Debinding and sintering properties o Weight loss o Dimensional changes o Sintered density Metallographic analysis o Porosity o Microstructural analysis o Grain size Mechanical properties o Tensile testing o Hardness testing Corrosion analysis o Salt spray testing
o Light optical microscopy (LOM) o Scanning electron microscopy (SEM)
4.1 Debinding and sintering properties:
There were some physical properties measured after debinding and sintering of the MIM samples. These properties include; weight loss, dimensional changes and sintered density.
4.1.1 Weight loss:
After getting green samples from the MIM machine, debinding was done and during
debinding the weight of the samples decreases because of the removal of binder. Depending on the powder particle size and solid loading of feedstock, the total weight loss varies. The weight losses during debinding and sintering are shown in Table 4 and Table 5, respectively.
Table 4: Weight loss during debinding. Debinding weight loss
Samples Weight
Before (g)
Weight After (g)
Average weight loss %
410 12.87 11.79 8.42
430 13.00 11.86 8.76
434 12.86 11.82 8.11
15
Ref 430 feedstock might have higher solid loading, which means more metal powder and less binder, as it is obvious from higher weight of green (injection molded) Ref 430 samples in Table 4. So during debinding & sintering of Ref 430, this less binder will remove and the percentage in the weight loss would be less. The weight-difference among the coarse powder samples might be an effect of manual mixing fault, variance in process parameters and/or degradation of binder. Degradation of binder may occur if feedstock is passed through injection molding machine’s heating barrel more than 2-3 times.
Table 5: Weight loss during sintering and overall weight loss.
Sintering weight loss Overall
Samples Weight
Before (g)
Weight After (g)
Average weight loss % weight loss %
410 11.79 11.41 3.20 11.35
430 11.86 11.42 3.69 12.13
434 11.82 11.44 3.18 11.03
Ref 430 14.59 14.16 2.91 6.49
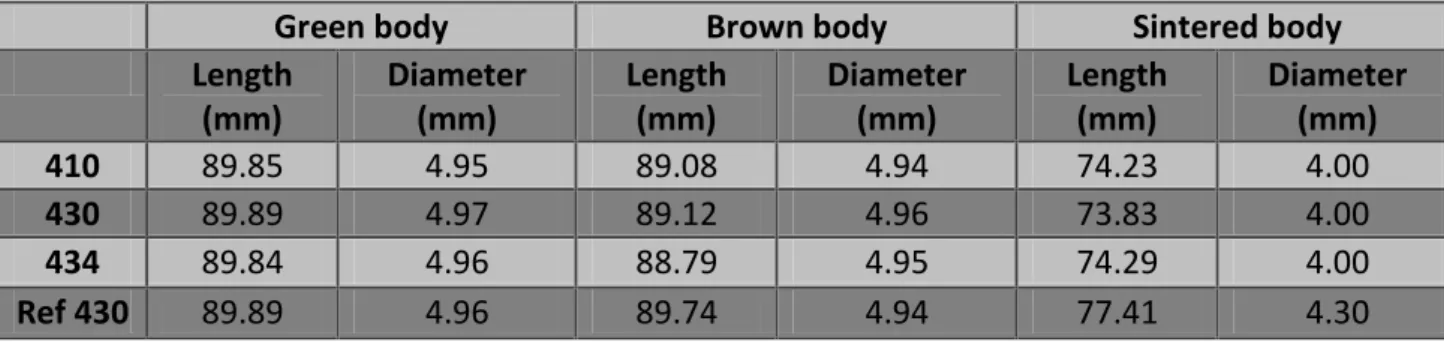
4.1.2 Dimensional changes:
By dimensional changes, we mean the changes in length and diameter during debinding and sintering of the MIM samples. In Table 6; green body means the samples taken from MIM machine, brown body means the samples taken after the first step of debinding (i.e. solvent debinding) and sintered body means the samples taken after the sintering process.
Table 6: Dimensions of samples at different process stages.
Green body Brown body Sintered body
Length (mm) Diameter (mm) Length (mm) Diameter (mm) Length (mm) Diameter (mm) 410 89.85 4.95 89.08 4.94 74.23 4.00 430 89.89 4.97 89.12 4.96 73.83 4.00 434 89.84 4.96 88.79 4.95 74.29 4.00 Ref 430 89.89 4.96 89.74 4.94 77.41 4.30
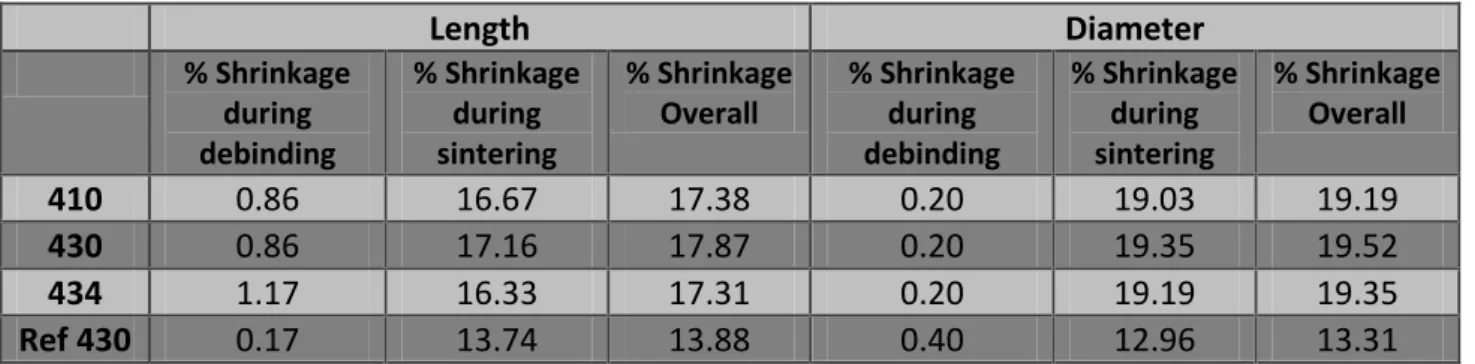
In Table 7, the results show that the dimensional changes increases with the increase in the powder particle size after debinding and sintering. But the larger shrinkage occurs during sintering process. It is because of the fact that during sintering process the powder particles fuse together more tightly, making the pores (which occur during binder removal) to shrink.
16
Table 7: Dimensional changes after debinding and sintering.
Length Diameter % Shrinkage during debinding % Shrinkage during sintering % Shrinkage Overall % Shrinkage during debinding % Shrinkage during sintering % Shrinkage Overall 410 0.86 16.67 17.38 0.20 19.03 19.19 430 0.86 17.16 17.87 0.20 19.35 19.52 434 1.17 16.33 17.31 0.20 19.19 19.35 Ref 430 0.17 13.74 13.88 0.40 12.96 13.31
The shrinkage in length and diameter should be same for each type of sample but it differs because of segregation within the sample.
4.1.3 Sintered density:
Sintered density is also a measure of the dimensional change. Sintered density is calculated by measuring the mass of the sample in air and then in water.
Table 8: Sintered density of samples.
Material Mass in air (g) Mass in water (g) Sintered density (g/cm3)
410 11.39 9.82 7.28 410 11.41 9.85 7.31 430 11.47 9.92 7.42 430 11.52 9.96 7.41 434 11.39 9.83 7.31 434 11,40 9,84 7,31 Ref 430 14.10 12.25 7.60 Ref 430 14.07 12.22 7.59
In Table 8, it is shown that finer powder samples (430 & Ref 430) have higher sintered density than coarse powder samples (410 & 434). Eq. 2 is used for calculating sintered density.
( ) eq. 2
4.2 Metallographic Analysis:
After sintering, few samples were cut down to small parts for mounting in metallographic polymer. These metallographic samples were then grinded and polished according to the Höganäs AB’s standard metallographic procedures for PM components. Etching of the samples for microstructure and grain size measurement was done with Vilella’s reagent [10]. Porosity, microstructure and grain size were examined during this metallographic analysis.
17
4.2.1 Porosity:
Figure 11: Effect of powder particle size on the porosity of samples.
Figure 11, shows the amount of the porosity in different MIM samples. It can be seen that, with the decrease in particle size, the amount and volume of porosity also decreases. In ‘Sieving’ section of this report, it is mentioned that the particle size of 430 is a bit less than the particle size of 410 and 434. This effect can be seen in these microstructures. Ref 430 is the finest powder of all, so the amount of porosity is least in it. The amount and volume of pores become smaller and tend to form more circular/spherical shape in Ref 430 samples. This is because of the fact that the formation of spherical shape is most stable form of all the shapes.
410 430
18
4.2.2 Microstructural analysis:
Figure 12: Effect of powder particle size on the microstructure of samples.
The grains of 410 and 434 are finer as compared to the grains of 430 and Ref 430. The grains of 430 and Ref 430 are coarser because of their finer particle size. If the particle size is fine, the samples would have less porosity in it and less porosity means that the resistance in grain growth will be less, so the grains will be coarser. The surfaces of the pores in the sample hinder the growth of grains. So, having less pores will generate large grains. Figure 12, shows that with the increase in powder particle size, the grain size decreases.
4.2.3 Grain size:
Figure 13: Circular method for grain size
410 430
19
In order to calculate the grain size (in µm) and ASTM grain size number, a built-in program in the LOM’s software PAXit was used. In this program, there are different ways of calculating grain size but circular method for grain size measurement was used.
In this program, three circles appear on the image. The intersections of the circles and the grain boundaries are clicked. These clicks are counted by the software itself. This intercepts’ count is then divided by the length of the lines and it gives grain size (in µm). Table 9, shows the grain size (in µm) and ASTM grain size number of MIM samples:
Table 9: Grain size and ASTM no. of the samples.
Samples Intercepts Length (µm) ASTM no. Grain size (µm)
410 44.80 4000 4 89.30
430 37.85 4000 3 105.7
434 40.50 4000 3-4 98.80
Ref 430 25.33 4000 2 157.9
All these values in the table are the average of all the results of this experiment. It is clear that the powder particle size has an effect on the porosity in the sample, which has an effect on the grain size or grain growth.
4.3 Mechanical Testing:
4.3.1 Tensile testing:
The dog bone shaped tensile samples were tested on Zwick Z100 tensile testing machine, according to SS-EN10002-1 standard. The tensile graphs are included in Appendix II of this report.
Table 10: Tensile properties of the samples.
Sample Young's Modulus
(GPa) Yield Strength (MPa) (MPa) UTS Strain (%)
410 145.8 200.7 314.3 34.23
430 157.3 205.4 313.8 29.33
434 153.2 211.9 315.3 28.85
Ref 430 163.0 200.5 303.9 36.24
SM 242.9 382.8 571.3 32.87
As shown in Table 10, except the sheet metal samples, all other samples show almost the same UTS, yield strength and young’s modulus. Sheet metal samples show superior
mechanical properties because of no porosity in them and sheet metal samples are not heat treated in the same way as the sintered samples, which are softly annealed during sintering process. The fine grain size also increases the mechanical properties of sheet metal samples.
20
It can be seen that at the % strain of the MIM samples, there is some variation among different samples. Ref 430 has higher strain because of low porosity but 410 has higher strain because it has less chromium (Cr). On the other hand, 430 and 434 have higher amount of Cr which increases the brittleness and decrease the ductility. Chromium
promotes ferrite phase, which is a softer phase, so it may have affected the strain (ductility) of the samples.
4.3.2 Hardness testing:
Vickers hardness number was measured according to ISO 6507-1:2005 standard. A magnification of 10x and a 10kg weight was used during this testing. The Hardness values among different powders don’t vary much but sheet metal has highest of all.
Table 11: Vickers hardness number for the samples.
Sample no. 410 430 434 Ref 430 Sheet Metal
1 143.40 137.00 153.60 139.90 161.50 2 140.90 136.30 166.10 120.20 159.90 3 131.60 133.60 147.80 134.10 163.10 4 134.00 142.00 154.80 139.30 160.50 5 143.30 141.40 149.20 133.30 166.40 6 144.40 131.60 150.70 133.30 164.40 7 145.60 127.70 156.10 141.70 168.10 8 143.30 140.40 142.50 138.30 169.90 Average 140.80 136.30 152.60 135.00 164.20 Standard Deviation 4.55 4.46 6.15 6.00 3.22 Confidence Interval 0.05 0.05 0.07 0.07 0.04
In Table 11, 430 and Ref 430 have less hardness because of their coarser grain size and SM shows higher hardness because it is not softly annealed as the sintered samples. SM
samples’ non porosity and smaller grain size also adds up in increasing the Vickers hardness number.
21
4.4 Corrosion analysis:
All the images taken by Stereo-Microscope, Light Optical Microscopy (LOM), and Scanning Electron Microscopy (SEM); are shown in this part of the report. These results are briefly discussed as well, accordingly.
4.4.1 Salt spray test for corrosion:
A salt spray test is used to check the corrosion resistance properties by providing an artificial environment. This test runs in cyclic behavior with; salt spray, fogging/misting, wetting, purging and drying, as its main steps.
ISO 16701:2008 standard method was used in Ascott CC450xp for an eight weeks period. Sodium Chloride (NaCl) salt was dissolved in distilled/deionized water to a concentration of 10g/l + 1g/l. The conductivity of the distilled or deionized water used, should not be higher than 20µS/cm at 25⁰C + 2⁰C. Check the pH of the salt solution by using potentiometric measurement at 25⁰C + 2⁰C. Finely adjust the pH of the salt solution to a value of 4.2 + 0.1 by standard addition of a diluted sulfuric acid solution. These conditions can be taken as three times more severe as that of ordinary sea water. 10 of each 5 different type of samples (i.e. 10 x 5 samples) were placed inside the salt spray chamber. A sample of each type was taken out of the chamber after 1 day, 3 days, and 1-8 weeks (at the start of every week). These samples were dried in air after taking out of the chamber and then their surfaces were examined under stereo-microscope. At the end of 8 weeks, the final samples were also cut at cross sections and were examined under LOM and SEM.
4.4.1.1 1 day:
410 430 434
Ref 430 SM Figure 14: Stereo-microscope images taken after 1 day of salt spray test.
22
Usually samples of salt spray tests are examined on weekly bases, but some samples were taken after 1 and 3 days, just to check the initiation of corrosion process on these samples. After 1 day of salt spray test, there wasn’t any initiation of corrosion on the samples. And all the samples were intact even after such severe conditions as shown in Figure 14.
4.4.1.2 3 days:
410 430 434
Ref 430 SM
Figure 15: Stereo-microscope images taken after 3 days of salt spray test.
As it is obvious from the Figure 15 that there isn’t any notice able corrosion or rust particles present. But after closely examining the samples, some corrosion initiation was observed in 410 at the ‘runner inlet’ of the sample, as shown in Figure 16:
Figure 16: Corrosion initiation on 410 after 3 days of salt spray test.
This rust particle was found on the edge of the runner inlet of the samples and the reason could be the surface conditions at that point. The surface roughness is more at this point which means more surface is exposed to the corrosive environment. The surface energy will also be more at this point which will help the corrosion process.
23
4.4.1.3 1 week:
410 430 434
Ref 430 SM
Figure 17: Noticeable corrosion after 1 week of salt spray test.
After 1 week, the corrosion process has started in 410. The rest of the samples were almost intact with unnoticeable corrosion products (rust), as shown in Figure 17. The picture of 434 here shows a point of rust as well. A magnified image of the corrosion products of 410 is shown below in Figure 18:
24
4.4.1.4 2 weeks:
410 430 434
Ref 430 SM
Figure 19: Corrosion after 2 weeks of salt spray test.
After 2 weeks, there isn’t as much corrosion products as there was on samples after 1 week, as shown in Figure 19. So from this observation, it can be assumed that during the initial 3-4 weeks of salt spray test, it would be wrong to predict the corrosion behavior by visual examination. That’s why; the standard salt spray test is minimum 6 weeks long test.
Figure 20: Corrosion initiation on the edges of SM after 2 weeks of salt spray test.
But after 2 weeks, one thing was confirmed that; the corrosion process happening, at the parting lines of the MIM samples and at the edges of the sheet metal samples, was much faster than the corrosion happening on the plainer surfaces. Figure 20 shows the corrosion edges of the sheet metal sample. From here, it is obvious that corrosion depends on the surface conditions and surface energy.
25
4.4.1.5 3 weeks:
410 430 434
Ref 430 SM Figure 21: Corrosion products after3 weeks of salt spray test.
After 3 weeks, now the things become clearer and clearer. 410 and SM shows corrosion products but they both seemed different of nature. In Figure 21, 430 shows more wet and sticky localized corrosion products whereas the corrosion products on SM seem to be dry and more uniformly distributed. This might be the cause of difference in surface wetness.
Figure 22: Salt deposition on 430 after 3 weeks of salt spray test.
Figure 22, shows the 430 after 3 weeks in salt spray chamber. The deposition of the salt crystals on the surface of the sample is quite visible. These salt deposits may cause localized corrosion because of the high concentration of chloride (Cl-) ions at these points.
26
4.4.1.6 4 Weeks:
410 430 434
Ref 430 SM
Figure 23: Much more corrosion products after 4 weeks of salt spray test.
In Figure 23, 430 and Ref 430 have started to corrode as well. SM is showing its nature of corrosion, which obviously seems to be pitting corrosion. The nature of other samples’ corrosion is hard to judge, as they are having much corrosion products at corrosion points. 434 is showing better corrosion performance as compared to the other samples, this can be due to 1% molybdenum (Mo) which helps stainless steels in corrosion resistance.
27
4.4.1.7 5 weeks:
410 430 434
Ref 430 SM
Figure 24: Comparison of corrosion on different samples after 5 weeks of salt spray test.
After 5 weeks, as shown in Figure 24, corrosion is getting serve and more severe. 410 and SM are heavily corroded. But it should be mentioned here that the sheet metal has two different surface roughnesses on either side of the sample. It is rough at one face and a bit smoother on the other face of the sheet. So the side with more roughness is the one which is shown here, which exhibit more corrosion. 410 shows some orange colored liquid (rust + salt solution), which goes into the pores of the sample and help to corrode more.
28
4.4.1.8 6 weeks:
410 430 434
Ref 430 SM Figure 25: Corrosion behavior after 6 weeks of salt spray test.
After 6 weeks (which is the minimum time for this salt spray test), it can be seen in Figure 25 that 410, 430 and SM are showing the worse performance. On the other hand, 434 and Ref 430 shows better corrosion resistance in this severe corrosive environment. 434 is showing good behavior because of 1% Mo but Ref 430 is good because of its finer powder particles, low surface porosity and better surface conditions.
29
4.4.1.9 7 weeks:
410 430 434
Ref 430 SM Figure 26: Corrosion products after 7 weeks of salt spray test.
After 7 weeks of salt spray test, the results are getting obviously clearer now. But if we compare Figure 25 and Figure 26, it becomes clear that corrosion performance also changes from sample to sample within the same group. 410 and 430 showed more corrosion
products after 6 weeks as compared to these after 7 weeks. 434 is showing some salt crystal deposition now, which might initiate corrosion on its surface later.
30
4.4.1.10 8 weeks:
410 430 434
Ref 430 SM
Figure 27: Final comparison of corrosion products after 8 weeks of salt spray test.
After 8 weeks and at the end of this salt spray test, the final results are shown in Figure 27. All the samples are corroded because of the severe corrosive environment, but some
samples are more corroded than the others. And from this comparative study we are able to give some recommendation and suggestions about these materials and their applications in corrosive environments.
410 has shown the worst results of all, this is because of the low content of chromium (~11.6% Cr). 430, Ref 430 and SM; these all have same amount of chromium content (~16% Cr). So, their difference in corrosion behavior is because of porosity and surface conditions (surface roughness). 434 has shown the best results in coarser powder MIM samples, because of its 16% Cr with an addition of 1% Mo.
It can be concluded that, finer powder samples (i.e. Ref 430) and coarser powder samples with 1% Mo (i.e. 434) shows almost the same corrosion behavior in severely corrosive environments.
31
4.4.2 Light optical microscopy (LOM):
In order to get more information about the corrosion on the samples, LOM was done on the cross-sectional area of the samples, which were in salt spray chamber for 8 weeks. Corrosion pits were observed at the cross-section of the samples. The depths of the corrosion pits indicate the corrosion performance of that material. Deeper the corrosion pit, less corrosion resistant the material will be. Some micrographs are shown in Figure 28, to illustrate this factor; all micrographs are taken at 5x magnification to show more information.
Figure 28: LOM images showing corrosion pits in different samples.
Figure 28, shows the difference in depth of corrosion pits in different samples, and the Ref430 and 434 shows better corrosion resistance then 410 and 430. 410 shows the most corrosion pits in all of the samples. In Figure 29, SM shows deep corrosion pits as well, this might be the effect of the mechanical processing (deformation/cold working) during sheet metal forming. These pits are caused by the chloride (Cl-) ions, which came from the sodium chloride (NaCl) salt. In case of MIM samples, it’s hard to judge that the pits on the surface are either formed by corrosion or they are the surface pores.
410 430
32
Figure 29: (a) shows corrosion pits in SM at 5x magnification, (b) is taken at 20x magnification.
4.4.3 Scanning electron microscopy (SEM):
SEM was done to take a look at the corroded samples’ surface. SEM is a good examination technique for these samples, as the surface doesn’t have to be grind or polished. So, the surface morphology and texture can be easily seen by SEM. In Figure 30, are some SEM images taken at different magnifications (shown at the bottom bars of the images).
Figure 30: SEM images of corroded MIM samples after 8 weeks of salt spray test.
SM (a) SM (b)
410 430
33
The interesting thing that was observed in the SEM images of 430, 434 and Ref 430, was the lamellar texture of the surface. Finer the lamellar texture, better the corrosion resistance that material has. And this texture was neither found in 410SS nor in SM samples.
This lamellar texture was assumed to be chromium oxide (Cr2O3) layer, formed in MIM
samples. Figure 30 does not show much information about this lamellar texture, so some bigger versions of these images are provided in Appendix III.
Figure 31 of SM sample shows the corrosion pits on the surface of samples after 8 weeks of salt spray test; and the magnification of the images are mentioned at the bottom bars of these images.
34
5
Problems and Discussion (possible errors):
The problems that occurred during this project are mentioned here along with their
remedies that were performed. But still there is some possibility of errors which might have altered the results a bit.
During metal injection molding process, the feedstock (with this particular binder mix) was sticking in the sprue of MIM machine. And to get defect free samples, the residual injection molded parts (i.e. runner, inlet gates, etc.) and rejected samples, were grinded and re-injection molded. This results in the degradation of binder from feedstock because the feedstock passes through the heating barrel more number of times than desired. This degradation of binder causes variation in dimensional changes, weight-loss and sintered density. To avoid this problem in future, a heating system for the sprue was installed in the machine, to keep the temperature of sprue as that of heating barrel. So, the feedstock sticking was minimized and this increased the process speed and decreased the material wastage. But unfortunately, this heating sprue was installed after samples manufacturing of this project, so that is why the samples have some errors in debinding & sintering properties. During debinding of 434 green MIM samples, cracks on the heads of some samples were observed. This problem was randomly occurring in some 434 samples. This mystery has still to be resolved but it might be an effect of binder swelling. The mechanical properties of 434 might not be as accurate because of some minor internal cracks, generated during this debinding swelling, and errors might have carried throughout the project.
During corrosion salt spray testing, the surface roughness of the samples to be characterized should be same. So, surface roughness of the samples was examined by following the
standard ISO 4287:1997. The results gathered are shown in Table 12 (a).
Table 12 (a): Surface roughness of the samples. Table 12 (b): Surface roughness of grinded SM.
Samples Ra (µm) 410 3.1039 430 2.3067 434 2.7658 Ref 430 1.5726 SM rough 0.1898 SM fine 0.0505
These results give an idea about the difference in surface roughness of samples with change in powder particle size. Ref 430 being the finest powder gave less surface roughness among MIM samples.
430 powder was already sieved (production sieved), so it shows a difference from 410 and 434, which were sieved before feedstock mixing. SM samples had two different faces with
Grinding Paper Ra (µm) 180 0.2463 220 0.2338 320 0.1593 500 0.0643 800 0.0577
35
different surface roughness. And the rough surface was more sensitive to corrosion then its finer surface. The SM samples were grinded on SiC grinding papers to make them as rough as MIM samples. But it turned out that even the coarsest grinding paper made less rough surface then the MIM samples’ original surface roughness, as shown in Table 12 (b). So the SM samples were used in their original form. This variation of surface roughness among samples may have some effect on the corrosion results.
During the metallographic examination of SM samples, some unidentified phases were observed. The micrograph of SM at 50x magnification and etched with vilella’s reagent.
Figure 32: Micrograph of etched SM at 50x.
Two different phases can be seen in Figure 32, one phase has large grain and was identified as ferrite, but the other phase with really small dark dots was unknown. There were two options about these dark dots, either these were sigma phase (Fe-Cr phase) or some
carbides (Chromium carbides). In order to solve this problem, chemical composition analysis of all the samples were done. Table 13, shows the results from this chemical composition analysis.
This analysis was also useful to see the change in chemical composition among MIM
samples. The only difference in 430 and 434 is that of ~1% Mo in 434. This chemical analysis also shows that the MIM samples have very low carbon content (i.e.0,004%). But SM
samples have relatively high carbon content with 0,036%C. So the dark dots appeared in SM microstructure may be some carbides. These carbides might have formed during the
thermo-mechanical treatments (i.e. hot rolling) in sheet metal forming. As the sheet metal forming process is unknown, so it is hard to say anything for sure. But the results from corrosion and chemical analysis points towards the carbide presence in SM. The chemical composition analysis was done according to Spectro ICP-OES.
36
Table 133: Chemical composition analysis of the samples.
Samples Cr Mn Mo Ni P Si C N O S 410 11,6 0,14 0,03 0,21 0,03 1 0,004 0,002 0,094 0,001 430 16,1 0,13 0,04 0,13 0,04 0,91 0,004 0,002 0,147 0 434 16,1 0,09 0,83 0,13 0,03 0,96 0,004 0,003 0,142 0 Ref 430 16,2 0,58 0,02 0,23 0,01 0,57 0,004 0,003 0,021 0,001 SM 15,6 0,51 0,01 0,13 0,02 0,36 0,036 0,042 0,006 0,001
During salt spray test, inside the corrosion chamber, the samples were hanged by knotting fishing line on to the heads of samples. These knots and fishing line around the samples caused crevice corrosion. So this might have affected the corrosion testing results as well. The salt spray test for corrosion analysis is not that effective, as it only give a comparative analysis and not some specific values. And during this test, the droplets of salt water condensed on the samples might have fallen on to samples under them, which might have altered the results. The handling of samples (from sintering till placing them in salt chamber) is also important, as a lot of contamination transfers from the human hands to the samples causing more possible errors.
37
6 Conclusion:
The conclusion of this Master’s thesis report can be summarized in the following points: • Sintered density increases with decrease in powder particle size.
• More pores occur in coarse powder samples and less in fine powder samples.
• Irregular pores occur in coarse powder samples as compare to spherical pores in fine powder samples.
• Grain size increases with decrease in porosity, and porosity decreases by decreasing powder particle size.
• Coarse powder samples show a bit better tensile properties than fine powder samples. • Hardness decreases with decrease in powder particle size.
• Addition of Cr and Mo shows great influence on the corrosion resistance of samples. • 434 coarse powder shows same corrosion behavior as that of fine Ref 430 powder.
•
Carbides/Sigma phase decreases the corrosion resistance of sheet metal.6.1 Future work:
In future, the corrosion performance, of these coarser powder MIM samples, can be
quantified by using electro-chemical methodology. And new binder systems can be tried for 434 to avoid binder swelling during debinding process.
38
7 References:
1. Inovar Communications Ltd. 2010. A dynamic $1 billion-plus global industry. [ONLINE] Available at:
http://www.pim-international.com/what_is_metal_injection_moulding/introduction_to_metal_injecti on_molding_MIM_PIM. [Accessed 20 August 12].
2. Rassmus Jens, Larsson Anna and Grosser Heike, 2011. An approach to cost effective low alloyed materials for MIM. Powder Injection Moulding International, Vol. 5 No. 3, 78-82.
3. http://www.custompartnet.com. 2009. Metal Injection Molding. [ONLINE] Available at:http://www.custompartnet.com/wu/images/metal-injection-molding/mim.png. [Accessed 13 August 12].
4. http://www.mcik.com. 2005. Laboratory Mixers. [ONLINE] Available at:
http://www.mcik.com/data/database/D0004/1140422651254.pdf. [Accessed 22 May 12].
5. http://www.ent.mrt.ac.lk. 2007. INJECTION MOLDING. [ONLINE] Available at: http://www.ent.mrt.ac.lk/~040087/index_files/image10321.jpg. [Accessed 30 May 12].
6. O. Lame et al., (2002), In situ Microtomography Study of Metallic Powder
Sintering [ONLINE]. Available
at:http://www.esrf.eu/UsersAndScience/Publications/Highlights/2002/Materials/MA T3/fig081 [Accessed 26 June 12].
7. HAZ metal. 2001. STAINLESS - stainless steels and their properties. [ONLINE] Available at:http://www.hazmetal.com/f/kutu/1236776229.pdf. [Accessed 17 August 12]. 8. www.pharmacopeia.cn. 2008. Bulk density and Tapped density. [ONLINE] Available
at: http://www.pharmacopeia.cn/v29240/usp29nf24s0_c616.html. [Accessed 15 May 12].
9. www.pharmacopeia.cn. 2012. Gas pycnometer. [ONLINE] Available at: http://en.wikipedia.org/wiki/Gas_pycnometer. [Accessed 17 May 12].
10. Metallography, Höganäs handbook for sintered components.
11. Randall M. German, 1997. Injection Molding of Metals and Ceramics. Edition. Metal Powder Industry.
12. Randall M. German, 2003. Powder Injection Molding Design & Applications. Edition. Innovative Materials Solutions.
13. Höganäs Handbook” Höganäs iron and steel powder for sintered components”, www.hoganas.com/pmc
14. O. Lame, D. Bellet , M. Di Michiel and D. Bouvard ,European Materials Research Society 2002 Proceedings, to be published in Nuclear Instruments and Methods in Physics Research B.
15. Chih-Chun Hsieh and Weite Wu, “Overview of Intermetallic Sigma (𝜎) Phase Precipitation in Stainless Steels,” ISRN Metallurgy, vol. 2012, Article ID 732471, 16 pages, 2012. doi:10.5402/2012/732471
16. Joseph R. Davis, 1995. Stainless Steels (Asm Specialty Handbook) (06398G). Edition. ASM International.
39
17. Erhard Klar, 2007. Powder Metallurgy Stainless Steels: Processing, Microstructures, and Properties. Edition. ASM International.
18. Kay Geels, 2007. Metallographic and Materialographic Specimen Preparation, Light Microscopy, Image Analysis and Hardness Testing. Edition. ASTM International. 19. Joseph I. Goldstein, 1981. Scanning Electron Microscopy and X-Ray Microanalysis: A
40
8 Appendixes:
Appendix I: Gas Pycnometer:
A gas pycnomter is a laboratory device used to measure the density or volume of solids. The solids can be in the form of powder. The gas pycnometer works on the principle of Boyle’s law. The gas pynometer is also known as Helium pynometer.
The formula used by the machine, for the calculation of volume (density), is given below:
Where Vs is the volume of the sample, Vc is the volume of the empty chamber, Vr is the volume of the reference chamber, P1 is the pressure in the sample chamber and P2 is the pressure after the expansion of gas into combined volume sample chamber and reference chamber [2].
42 Appendix II:
Tensile graphs of sintered MIM samples and SM samples:
410 430 434 Ref 430 SM 0 10 20 30 40 0 100 200 300 Strain in % S tre ss i n M Pa 0 10 20 30 0 100 200 300 Strain in % S tre ss i n M Pa 0 10 20 30 0 100 200 300 Strain in % S tre ss i n M Pa 0 10 20 30 40 0 100 200 300 Strain in % S tre ss i n M Pa 0 10 20 30 0 200 400 600 Strain in % S tre ss i n M Pa
43 Appendix III:
SEM images of 8 weeks corroded samples: 410
44 434
![Figure 4: A typical illustration of a MIM machine [5].](https://thumb-eu.123doks.com/thumbv2/5dokorg/4628962.119635/10.892.114.813.228.499/figure-typical-illustration-mim-machine.webp)
![Figure 5: A typical illustration of sintering process [6].](https://thumb-eu.123doks.com/thumbv2/5dokorg/4628962.119635/11.892.182.708.442.705/figure-typical-illustration-sintering-process.webp)