1(4)
SAFETY IMPACTS OF IMPLEMENTING MEDIAN BUS LANE SYSTEM
IN SEOUL METROPOLITAN AREA: VEHICLE-TO-VEHICLE AND
VEHICLE-TO-PEDESTRIAN CRASHES
Keechoo Choi Ajou University
World Cup-ro 164, Yeongtong-gu, Suwon, Gyeonggi-do 16499, Republic of Korea Phone: +82-31-219-2538 E-mail: keechoo@ajou.ac.kr
Co-authors; Jaeyoung Lee, University of Central Florida; Ingon Ryu, Ajou University; Yongju Yi, Ajou University
1.
INTRODUCTION
In metropolitan areas, public transportation has been encouraged as a sustainable mode because they can effectively transport many people and have less impact on traffic congestion and environment. In order to increase public transportation ridership, many jurisdictions have attempted to provide improved travel time and reliability of the public transportation system. These efforts include installing transit signal priority, dedicated median/curb bus lanes, bus rapid transit, bus bypass shoulder lanes, et cetera. In Korea, dedicated median bus lanes have been installed and operated since 1996. Currently, approximately 116km of the dedicated median bus lanes on 38 corridors are operational. The implementation of the dedicated median bus lanes in Seoul Metropolitan Area have been successful as they it resulted in the increased travel speed (15 km/h to 19km/h), bus arrival time accuracy (±1 min to 2 min), and daily bus-ridership (from 5.6 million to 5.75 million).
Although there have been several studies that evaluated the operational effectiveness of the exclusive bus lanes in Seoul, few studies have assessed the safety impacts. This study aims at estimating the impacts of implementing median bus lane system in Seoul Metropolitan Areas for vehicle-to-vehicle and vehicle-to-pedestrian crashes. In order to achieve the objective, a before-and-after study with comparison group method was employed and estimated crash modification factors (CMFs).
2.
METHODOLOGY
The before-and-after study with comparison group estimates safety effects of the treatment not only using crash data for treatment sites but also those for untreated sites, which are chosen as comparison sites. The method compensates for the external causal effects that could affect the change in the number of crashes (Hauer, 1997). Many studies have adopted the comparison group method to explore the safety effects of countermeasures (Lee, 2017).
The expected number of crashes for the treated sites that would have occurred in the ‘after’ period had no improvement been applied been applied (Nexpected, T,A) can be calculated using Equation 1 (Hauer, 1997): B C, observed, A C, observed, B T, observed, A T, expected,
N
N
N
N
=
(1)If the similarity between the comparison and treated sites in the yearly crash trends is ideal, the variance of Nexpected, T,A can be estimated from Equation2:
2(4)
)
N
/
1
N
/
1
N
/
1
(
N
)
Var(N
observed,T,B observed,C,B observed,C,A 2 B T, expected, A T, expected,=
+
+
(2)The CMF (Crash Modification Factor) and its variance can be estimated using Equations 3 and 4 as follows:
))
)/N
(Var(N
)/(1
/N
(N
CMF
=
observed,T,A expected,T,A+
expected,T,A expected,T,A2 (3)2 2 A T, expected, A T, expected, 2 A T, expected, A T, expected, A T, observed, 2
]
)/N
(Var(N
[1
)]
)/N
((Var(N
)
[(1/N
CMF
Var(CMF)
+
+
=
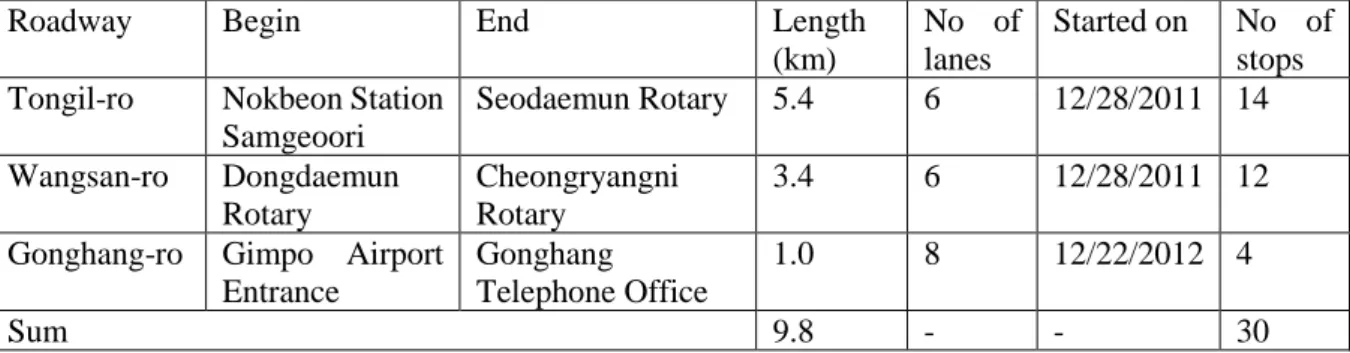
(4)The research team chose the study sites that implemented the median bus lanes between Dec 28, 2011 and Dec 21, 2012. The transition period (from Dec 28, 2011 to Dec 21, 2012) was not used in the analysis. Three major arterials: Tongil-ro, Wangsan-ro, and Gonghan-ro were used as treated sites. The total length of the treatment sites are 9.8 km with 30 bus stops. Comparison groups were randomly selected from candidate sites with similar in crash rates before the treatment, and those with similar in annual average daily traffic (AADT) and bus ridership after the treatment. The ratio between the treated and comparison sites was set to 1:2. The study periods and treated sites are presented in Tables 1 and 2, respectively.
Table 1: Study periods
Before-Period Transition After-Period
01/01/2010 to 12/27/2011 (Approx. 2 years) 12/28/2011 to 12/21/2012 (Approx. 1 year) 12/22/2012 to 12/31/2015 (Approx. 3 years)
Table 2: Treated study sites
Roadway Begin End Length
(km)
No of lanes
Started on No of stops Tongil-ro Nokbeon Station
Samgeoori Seodaemun Rotary 5.4 6 12/28/2011 14 Wangsan-ro Dongdaemun Rotary Cheongryangni Rotary 3.4 6 12/28/2011 12
Gonghang-ro Gimpo Airport Entrance
Gonghang Telephone Office
1.0 8 12/22/2012 4
Sum 9.8 - - 30
Table 3 compares AADT and bus ridership in treated and comparison sites after the treatment in the year of 2014. The t-test results indicated no significant difference at 95% confidence interval. In other words, exposures were well controlled in this study.
3(4)
Table 3: AADT and bus ridership in treated and comparison sites
Exposure Treated Sites Comparison Sites t-test
Mean S.D. Mean SD. t-stat p-value
AADT 47573 24797 57018 22451 -1.8167 0.0727
Daily bus ridership 4526.4 2606.8 3483.8 2826.3 1.6919 0.0942
Before estimating the CMFs, it is important to confirm that the crash patterns are similar before the median bus lane system was implemented. Thus, the number of crashes (per year) before the treatment at the treated and comparison sites were compared using student’s t-tests. The results of the t-test showed that there is no significant difference in the annual number of crashes between the two types of sites before the treatment (Table 4).
Table 4: t-tests for the annual crash frequency of treated and comparison sites
Crash type Severity level Treated Sites (Before the treatment) Comparison Sites (Before the treatment) t-test
Mean S.D. Mean SD. t-stat p-value
Vehicle-to-vehicle Total 16.87 10.71 19.32 8.58 -1.090 0.281 Minor injury 10.70 7.06 12.75 7.17 -1.291 0.202 Severe 6.17 4.81 6.57 2.53 -0.427 0.672 Vehicle- to-pedestrian Total 6.83 4.25 6.27 2.94 0.632 0.531 Minor injury 3.20 2.66 3.27 2.93 -0.108 0.914 Severe 3.63 2.46 3.85 2.63 -0.385 0.701
3.
RESULT
Subsequently, CMFs were estimated for vehicle-to-vehicle crashes and vehicle-to-pedestrian crashes by severity level (Table 5). The results showed that total and minor injury vehicle-to-vehicle crashes were significantly increased after the treatment by 17.2%. and 19.5%, respectively, compared to their comparison sites. Regarding the severe crashes, there was not significant increase in the relative number. In addition, vehicle-to-pedestrians crashes for all severity levels were significantly increased by 37.6% to 57.8%. The increase of severe vehicle-to-pedestrian crashes was the largest (57.8%).
Table 5: Estimated CMFs for vehicle-to-vehicle and vehicle-to-pedestrian crashes by severity level
Crash type Severity level CMF S.E. p-value
Vehicle-to-vehicle Total 1.172** 0.065 0.008 Minor injury 1.195* 0.082 0.018 Severe 1.119 0.106 0.260 Vehicle-to-pedestrian Total 1.376** 0.106 <0.001 Minor injury 1.452** 0.155 0.004 Severe 1.578** 0.149 <0.001
4(4)
4.
CONCLUSION
This study estimated the safety effects of the dedicated median bus lane system in Seoul using the comparison group before-and-after method. The results suggest that there are significant increases in the number of crashes for both vehicle-to-vehicle and vehicle-to-pedestrian crashes. In the case of vehicle-to-vehicle crashes, the increased crash frequency may be caused by more conflicts between buses themselves or between buses and other vehicles. Concerning the vehicle-to-pedestrian crashes, the median bus lane system might result in more number of jaywalking pedestrians. In order to reduce the number of such crashes effectively, it is recommended to provide 3E treatments (i.e., engineering, education, and enforcement) simultaneously. It would be necessary to physically separate pedestrians and vehicles at bus stop areas by providing pedestrian bridges or underpasses. Or more pedestrian-oriented signal timing might be effective. It has been proven that education or safety campaign are effective to reduce crashes for both drivers and pedestrians if they are properly provided. Lastly, more stricter enforcements and/or an increased fine might be effective countermeasures.
REFERENCES
Hauer, E. (1997). Observational before/after Studies in Road Safety. Estimating the Effect of Highway and Traffic Engineering Measures on Road Safety. Pergamon, Tarrytown: New York.
Lee, J., Abdel-Aty, M., Wang, J. H., and Lee, C (2017). Long-Term impacts of the universal helmet law changes on motorcyclist fatal crashes: comparison group and empirical Bayes approaches. In Paper Presented at the 96th Annual Meeting of the Transportation Research Board.