Marginal costs for railway level crossings in Sweden
Lina Jonsson – WSPlina.jonsson@wsp.com Gunilla Björklund – VTI gunilla.bjorklund@vti.se
Gunnar Isacsson – Swedish Transport Administration gunnar.isacsson@trafikverket.se
CTS Working Paper 2019:1
Abstract
The purpose of the present study is to estimate accident risks and marginal costs for railway level crossings in Sweden. The marginal effect of train traffic on the accident risk is used to derive the marginal cost per train passage that is due to level crossing accidents. The estimations are based on Swedish data from 2000 to 2012 on level crossing accidents, train volume, and crossing characteristics. In this study we estimate the accidents risk for both motorized road traffic and vulnerable road users. As a proxy for road traffic flow we use three categories of road type, and to capture the influences of pedestrians and bicyclists we use information about the number of persons living nearby the level crossing. The results show that both protection device, road type, traffic volume of the trains, and number of persons living nearby the level crossing have significant influences on the accident probability. The marginal cost per train passage regarding motor vehicle accidents is estimated at SEK 1.51 on average in 2012. The corresponding number for accidents with vulnerable road users excluding suicides is SEK 0.79 or including suicides SEK 5.02. The cost per train passage varies substantially depending on type of protection device, road type, the traffic volume of the trains, and number of persons living nearby the crossing.
Keywords: Railway, Marginal cost, Accident probability, Level crossings JEL Codes: D62, H23, R41
Centre for Transport Studies
SE-100 44 Stockholm Sweden
2
1 INTRODUCTION
1Railway is in general a very safe transport mode but collisions between road users and trains at level crossings are still a problem due to the, often severe, outcome of the accidents. During the years 2008-2012, 59 level crossing accidents (of which 37 were collisions with motor vehicles) occurred on the Swedish railway network, in all rail operations except metro and tram. As a consequence of these accidents, 34 fatalities and 29 severe injuries occurred among the road users. Corresponding numbers for the years 2003-2007 were 83 accidents (of which 65 were collisions with motor vehicles), leading to 41 fatalities and 47 severe injuries among the road users. Suicides and attempted suicides are not included in these numbers. (Trafikanalys, 2013b)
An important keystone in Swedish transport policy is marginal cost pricing. It is therefore important that external marginal costs of level crossing accidents are reflected in the price paid by train operators. The infrastructure charge of train operators set by the Swedish Transport Administration includes a component for rail-road level crossing accidents that should be based on the marginal cost principle. This means that the train operators should be charged for the expected cost due to level crossing accidents that results from driving one more train on the line. The cost of interest here is the cost that without a charge completely falls on the road users or the rest of society and is therefore external to the train operators. Charging the operators for this external marginal cost even though they do not legally bear the responsibility for the accidents is a way of internalizing the effect that train traffic has on the accident risk of the road users. This line of reasoning has a long tradition in road traffic (Vickrey, 1968, Newbery, 1988, Vitaliano, & Held, 1991, Elvik, 1994, Jansson 1994, Dickerson et al., 2000, Peirson et al. 2002, Lindberg, 2001, 2005 and 2006, Isacsson & Liss, 2016), but it is obviously relevant also to other types of traffic (see for example Nash, 2003, for a general discussion). For an overview of the development of the Swedish accident charges, see Lindberg (2002; 2006).
The purpose of the present study is to estimate the marginal cost associated with rail-road level crossing accidents, i. e. to find out how much the expected accident cost due to collisions between trains and road vehicles at a given crossing will change when an additional train passes the crossing. Separate models are estimated for motor vehicles accidents and vulnerable road user accidents (here, pedestrians and bicyclists). The expected accident cost depends on both the relationship between train volume and accident risk and the expected cost per accident. The relevant accident cost is the cost that falls on the road users and is taken from the official Swedish values of fatalities and injuries used in cost benefit analyses in the transport sector.
As far as we know, no other country, apart from Sweden, includes the external marginal level crossing accident cost in the infrastructure charge for railway traffic. Studies on the
1This study was funded by the Swedish Transport Administration and the Swedish government. However, views expressed in the study do not necessarily correspond to those of the Swedish Transport Administration or the Swedish government. The financial support is gratefully acknowledged. The authors would also like to thank Anna Vadeby for comments on an earlier version and Kristofer Odolinski for help with the traffic data. Any remaining errors are solely ours.
3
relationship between train traffic and accident risk for road users at level crossings are therefore rare. This paper, thus, provides empirical evidence that may be informative to railway infrastructure authorities in other countries where marginal cost pricing in the transport sector is considered important.
The paper is organized as follows. In section 2 we outline the main principles of marginal cost pricing of railway level crossing accidents. The main principles provide the key input for the structure of the empirical models outlined in section 3. The data used to estimate the models are presented in section 4 and the empirical results are outlined in section 5. A summary and discussion of the results are provided in section 6.
2 MARGINAL COST CHARGING AND LEVEL CROSSING ACCIDENTS
Accidents between road users and trains at level crossings are almost always caused by some kind of misbehaviour from the road user. Either by not looking for trains, not observing flashing lights or closing barriers, or even by intentionally disregarding warning signs. It might therefore seem remarkable to put a charge on the train operators that internalizes the costs that otherwise are completely borne by the road users. However, the expected accident cost is external to the train company’s decision to run the train; i.e. the managers do not consider the expected accident cost in the decision on traffic. From this perspective, the amount of traffic is not efficient. This is in line with the corresponding reasoning concerning road traffic (for references see the introduction of this study).
More specifically, a theoretical motivation for using marginal cost based charges related to accidents in level crossings can be found in the accident and law literature on how liabilities and costs should be split between involved parties to achieve optimal risk reduction at lowest cost (Shavell, 2004). Accidents between road users and trains at level crossings are bilateral as the actions in the form of care taking and the activity level of both the road user and the train affect the accident risk. Even though it is almost impossible for an engine driver to take any action to avoid a crash when approaching a crossing with a car standing on the track (due to the long stopping distance), the level of activity, i.e. the number of times a train passes a crossing, does affect the accident risk. This means that the train operator has the possibility to reduce the risk by running fewer trains. For the road user, both the effort cost related to additional attention necessary when crossing a railway and the number of times he crosses a railway (the activity level) affect the accident risk.
As Shavell (2004) shows, the rules of liability affect both the behaviour and the chosen activity level of the injurer and the victim. But no liability rule, neither strict liability nor negligence, will by itself lead to an optimal level of activity for both parties in bilateral accidents.2 A condition for an optimal choice of activity level of both parties is that they
both pay for the expected marginal accident costs related to their actions. A charge on
2 There are two major rules of accident liability. Strict liability implies that the injurer is liable for the
harm he causes regardless of whether he was negligent or not. Under the negligence rule, on the other hand, the injurer is only liable if his level of care is below some minimum standard specified by the court.
4
trains corresponding to the expected increase in accident costs of road users is a means to internalize the expected external marginal accident cost of train operators.
Note that the largest part of accident costs in a level crossing pertains to injuries of the driver and passengers in the road vehicle and material damage to the road vehicle. Thus, these costs are primarily borne by the road user. In Sweden and other countries with substantial public funding of health care, costs are also borne by the tax payers to a large degree. By charging train operators for the expected external marginal cost, train operators will take into account the effect on the accident risk from train traffic. In this way, the train operator and the road user face the full expected marginal accident costs from level crossings and will, in theory, therefore both choose the optimal level of traffic. Here we adopt the marginal cost framework proposed by Lindberg (2002; 2006). It says that the number of accidents where trains are involved is a function of the traffic volume of trains (QT) and other explanatory variables (X), including the traffic volume of motor vehicles at level crossings (for accidents between trains and motor vehicles):
𝑌𝑌 = 𝑓𝑓(𝑄𝑄𝑇𝑇, 𝑋𝑋) (1)
where Y represents the number of accidents (in a generic case this should be seen as a vector with rows representing different degrees of injury severity related to the accidents). Related to the accident and each injury severity level is a set of cost components: the willingness-to-pay of the involved user (a), the willingness-to-pay of relatives and friends (b), and system external cost, i.e. mainly medical costs paid by the social security system (c). The marginal cost (MC) with respect to QT follows from the total cost (TC):
𝑇𝑇𝑇𝑇 = 𝑌𝑌(𝑎𝑎 + 𝑏𝑏 + 𝑐𝑐) (2)
𝑀𝑀𝑇𝑇 =𝜕𝜕𝑄𝑄𝜕𝜕𝜕𝜕
𝑇𝑇(𝑎𝑎 + 𝑏𝑏 + 𝑐𝑐) (3)
The willingness-to-pay of relatives and friends (b) is relatively uncertain and is normally not included in calculations of the external marginal cost for traffic accidents (Isacsson & Liss, 2016). Therefore, we will only use the cost components (a) and (c) in our calculations of the marginal costs. Both these components are included in the official Swedish values of fatalities and injuries that were mentioned above. These values are 27.7 millions SEK3
for fatalities, 5.1 millions SEK for severe injuries, and 0.3 millions SEK for light injuries (Trafikverket, 2016, values adiusted to the price level in 2017).
The external marginal cost 𝑀𝑀𝑇𝑇𝑒𝑒 is calculated as:
𝑀𝑀𝑇𝑇𝑒𝑒 = 𝑀𝑀𝑇𝑇 − 𝑃𝑃𝑀𝑀𝑇𝑇, (4)
where 𝑀𝑀𝑇𝑇 is the marginal accident cost and PMC is the private marginal cost already internalised by the train operator. The external marginal cost is, thus, the part of total marginal cost relevant to internalize with a charge on infrastructure use of a railway track. The private marginal cost could include delay costs for the operator and any costs due to
5
injuries of the driver or passengers that the operator compensates the passengers for. If we ignore the train operator’s own accident cost, the external marginal cost at level crossings is the same as the marginal cost (Lindberg, 2002; 2006). When we henceforth discuss the external marginal cost, we mean the cost that falls on the road user or the rest of society due to injuries when an accident between a train and a road user occurs.
3 EMPIRICAL MODELS OF THE ACCIDENT PROBABILITY AND THE
MARGINAL COST
As noted in the introduction, the empirical models used in this paper pertain to two different types of level crossing accidents: (i) accidents involving motor vehicles and (ii) accidents involving vulnerable road users (pedestrians and bicyclists). The main reason is to consider potential heterogeneity in the relationship between accidents and traffic flows. Furthermore, vulnerable road users can use crossings where no motor vehicles can cross and the information on traffic flows of motor vehicles and vulnerable road users differ. This implies that we estimate two separate models for the two types of accidents. In what follows we outline a generic model for the two accident types and describe how the included control variables differ between the models. We then describe how we use the estimated models to arrive at estimates of: (i) the marginal cost per train passing the level crossing and (ii) the corresponding marginal cost expressed in vehicle kilometers. To estimate the marginal costs we first need an estimate of the accident probability. A suitable count data regression model like the Poisson model or the negative binomial model is a natural choice when modelling the number of events during a given time period. However, during the 13 years covered in our dataset there is at most one accident per crossing and year, with two exceptions being two crossings with two accidents during the same year.4 We therefore choose to model the probability that (at least) one accident
will occur at a given crossing during a specific year using a logit model.
𝑃𝑃(𝑦𝑦 = 1|𝑊𝑊) =1+𝑒𝑒𝑒𝑒𝑊𝑊′𝛽𝛽𝑊𝑊′𝛽𝛽 = Λ(𝑊𝑊′𝛽𝛽) (5)
where y=1 indicates the occurrence of an accident (resulting in at least a personal injury) in that crossing and y=0 otherwise, W’=(QT, X) is the set of independent variables, β is the related set of parameters, and Λ(𝑊𝑊′𝛽𝛽) is the logistic cumulative distribution function. In the model of motor vehicle accidents the set of independent variables includes: the number of passing trains, indicator variables for road type, and indicator variables for protection device. Information on road type is used as a proxy for information on traffic flow of motor vehicles that is missing in our data set. In the model of accidents involving vulnerable road users the set of independent variables includes: the number of passing trains, the number of individuals living in proximity (0-2 kilometers) of the crossing and indicator variables for protection device. Information on the number of individuals living in proximity of the crossing serves as a proxy for information on traffic flow of vulnerable road users that is missing in our data set. The general idea behind this proxy variable is,
4 One of these crossings had two motor vehicle accidents and the other one had one motor vehicle accident
6
thus, that individuals living nearby the crossing generate traffic flows of pedestrians and bicyclists.
Note that when analyzing accident frequencies on roads with count data models the length of the road segment is usually entered as a so-called offset variable among the independent variables with parameter equal to one (e.g. Isacsson and Liss, 2016). This serves the purpose of expressing the number of accidents in terms of accidents per kilometer (or some other measure of distance). This is motivated by the fact that the frequency of accidents is necessary larger on longer road segments (all else equal). In addition, the width of the road is also an important control variable in models of road accidents. Level crossing accidents occur, however, at a specific place and the variation in length and width between different crossings is relatively small. We assume that the small differences in the length and the width of the crossing is captured by the control variables for type of protection device and type of road.
The fact that our dataset on crossings is a panel opens up for estimation methods that use the variation in accident risk, traffic and crossing characteristics within the same crossing over time to estimate the effect of traffic on the accident risk. The fixed effects estimator uses a time-invariant individual specific constant to get unbiased and consistent estimates even in the case of unobserved effects that are correlated with the regressors. The downside with the fixed effects estimator is that time-constant variables cannot be included and that the within-variation, the variation within the same crossing over time, is the only source behind the estimation of the effect of train traffic on the accident risk. In cases where the variation over time within the same crossing is very small compared to the variation between crossings the fixed effects estimator is not a suitable alternative. The random effects estimator uses both the variation within a crossing and the variation between crossings and is a good choice if it can be assumed that unobserved individual specific effects are uncorrelated with the regressors. If the variation within a crossing over time is very small the random effects estimator approaches the pooled estimator.
In our dataset the variation over time within the same crossing when it comes to train passages is very small. The fixed-effects estimator is therefore not an appropriate choice. The estimation of a random effects logit model shows that the within-variation is insignificant, i.e. the variation over time within the same crossing is so small that it cannot help explain the variation in accident probability. Due to this fact the models in the paper are estimated with a pooled logit with clustered robust standard errors where each cluster consists of one crossing.
The (external) marginal cost per train passage can be calculated as the marginal effect on the probability multiplied by the expected accident cost, here estimated by the average cost per accident in the sample (C):
𝑀𝑀𝑇𝑇 = 𝜕𝜕𝑃𝑃 𝜕𝜕𝑄𝑄⁄ 𝑇𝑇× 𝑇𝑇 (6)
Since the marginal effect is crossing specific (see equations 7’-9’ below) the marginal cost will also vary depending on traffic volume, protection device and type of road/number of persons living in proximity of the crossing. The cost per accident in the sample is estimated from the information available for all years in the sample. The motivation is that the number of accidents in a given year is small and there is some variation in the
7
related cost across years. Hence, when applying equation (6) to a specific year there is a risk that this year is atypical. However, improvements in protection devices during the sample period may have reduced the average cost per accidents between the early and later years in the sample. Hence, there is a risk that we underestimate (overestimate) the marginal costs in earlier (later) years. Albeit we believe that it is preferable to reduce the stochastic variation in accident costs across years to arrive at a more precise estimate of the average cost per accident.
Theory gives us no direct guidance when it comes to model specification. Three natural choices are to estimate the accident probability as:
(i) a linear function
𝑃𝑃(𝑦𝑦 = 1|𝑋𝑋, 𝑄𝑄𝑇𝑇) = Λ(𝛿𝛿𝑄𝑄𝑇𝑇+ 𝑋𝑋′𝛼𝛼), (7)
(ii) a function including a quadratic term
𝑃𝑃(𝑦𝑦 = 1|𝑋𝑋, 𝑄𝑄𝑇𝑇) = Λ�𝛿𝛿𝑄𝑄𝑇𝑇+ 𝛾𝛾𝑄𝑄𝑇𝑇2+ 𝑋𝑋′𝛼𝛼� (8)
(iii) a function of the natural logarithm of train passages
𝑃𝑃(𝑦𝑦 = 1|𝑋𝑋, 𝑄𝑄𝑇𝑇) = Λ(𝜂𝜂 ln(𝑄𝑄𝑇𝑇) + 𝑋𝑋′𝛼𝛼) (9)
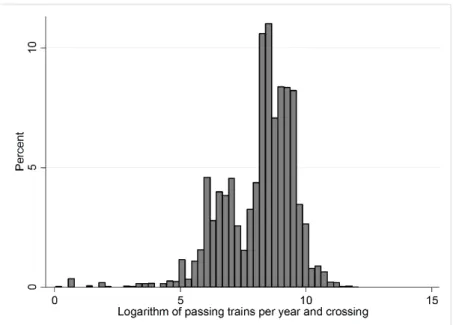
The fact that the distribution of train passages is extremely skewed (see Figure 1 in the data section below) complicates the analysis. By taking the natural logarithm of train passages the variable becomes more symmetric (Figure 2 in the data section). We have tested the fit of the three different alternatives with the data to arrive at preferred model specification. Clearly, the choice of functional form has implications for the estimated marginal cost. The marginal effects in (6) corresponding to (7), (8) and (9) are:
𝜕𝜕𝑃𝑃 𝜕𝜕𝑄𝑄⁄ 𝑇𝑇= Λ(𝑊𝑊′𝛽𝛽)�1 − Λ(𝑊𝑊′𝛽𝛽)� 𝛿𝛿, (7’)
𝜕𝜕𝑃𝑃 𝜕𝜕𝑄𝑄⁄ 𝑇𝑇= Λ(𝑊𝑊′𝛽𝛽)�1 − Λ(𝑊𝑊′𝛽𝛽)� (𝛿𝛿 + 2𝛾𝛾𝑄𝑄𝑇𝑇)and (8’)
𝜕𝜕𝑃𝑃 𝜕𝜕𝑄𝑄⁄ 𝑇𝑇= Λ(𝑊𝑊′𝛽𝛽)�1 − Λ(𝑊𝑊′𝛽𝛽)� 𝑄𝑄𝜂𝜂𝑇𝑇 (9’)
respectively where W’=(QT, X).
We use equation (6) to obtain an estimated marginal cost per train passing a level crossing using data in 2012 to calculate the marginal effects. The reason for using this year is to provide the most recent year in the data set. This is subsequently aggregated to a weighted average marginal cost per train passage with weights being equal to each crossings share of the total number of train passages. However, infrastructure charges are usually expressed in terms of vehicle kilometers (or some other measure of distance). For this reason, we convert the weighted average marginal cost per train passage simply by noting that the number of crossings included in the model for motor vehicle accidents in 2012 was 5 406. These crossings were found on 188 different track sections, the total route length of which was 10 369 km. Hence, we divide the weighted average marginal cost by 1.92 (the average distance between crossings) to arrive at an estimate of the external marginal accident cost of motor vehicle accidents per train kilometer. Similarly, the number of crossings included in the model of vulnerable road user accidents in 2012
8
was 5 765. These crossings were found on 190 different track sections, the total route length of which was 10 415 km. Hence, the weighted average marginal cost is divided by 1.81 (the average distance between crossings) to arrive at an estimate of the external marginal accident cost related to vulnerable road user accidents per train kilometer. An alternative simpler approach to obtaining an estimate of the marginal external accident cost (cf. equation 6), is to use the fact that
𝑀𝑀𝑇𝑇 = 𝜀𝜀 × 𝐴𝐴𝑇𝑇 (10)
where 𝜀𝜀 is the risk elasticity and AC is the average accident cost per train passage. Note that here AC is the average accident cost per train passage whereas C in equation 6 is the average cost per accident. We use equation 10 in some sensitivity analyses and to provide an alternative calculation of MC to the weighted average marginal cost presented in the main analysis.
4 DATA
The information on accidents, train traffic flows and level crossings was obtained from a database administered by the Swedish Transport Administration. The database (“plk-webb”) contains information on existing and closed level crossings with information on, e.g. protection devices, speed limits of the trains, and the type of road that crosses the railway. We have used information pertaining to the years 2008-2012 from this database. For the years 2002-2007 we use information from reported inspections of level crossings in other databases. The dataset used in the analyses presented here is further supplemented with information from 2000 and 2004 from an earlier analysis of accidents between road users and trains at level crossings (Lindberg, 2006).
Information on accidents between 2009 and 2012 has been obtained directly from the aforementioned database. For earlier years the accident records have been retrieved from The Swedish Rail Agency (now The Swedish Transport Agency) in combination with information from the Swedish Transport Administration. Some manual work was required to connect all the accidents to the relevant crossing. For each accident the number of persons killed or injured is recorded. The severity of each injury is classified as either light or severe. Only level crossing accidents leading to personal injuries are included in the analyses and only accidents that involve road users are included; i.e. in the analyses personal injuries among the train crew are not included. Information on suicides and attempted suicides are available in the data on accidents between 2010 and 2012. In our data suicides are only relevant in accidents involving vulnerable road users. We estimate separate vulnerable road user models that include and exclude such accidents. The main reason is that previous recommendations on marginal costs of level crossing accidents in Sweden are based on estimates excluding suicides; see e.g. an earlier edition of the so-called ASEK report (SIKA, 2008).5 Recent estimates of external marginal costs of
5 The ASEK report is the main Swedish document setting out principles, costs, prices and shadow-prices to be
used in CBA in the transport sector. The Swedish Transport Administration sets the guidelines and the current version of the report is published on the web site of the The Swedish Transport Administration (there is also a summary in English).
9
road traffic accidents also exclude suicides (Isacsson & Liss, 2016). Hence, comparisons of the results presented here with earlier estimates of the marginal accident cost of level crossing accidents and marginal accident costs on roads should be based on the models estimated on the data set excluding suicides. Nevertheless, we believe that it may be informative to present the results with suicides included in the data set. The main reason is that various investments surrounding the railway infrastructure are aimed at preventing suicides.
The information on traffic flows (no. of trains) is collected on a yearly basis. Flows may vary across different parts of each track section but all other information in the analyses pertains to track sections rather than the parts of the track section. Hence, we use a yearly average traffic flow over the whole track section as our measure of railway traffic flow. Furthermore, data on traffic flows for the station areas is imputed.6 Track sections with a
traffic volume of less than one train per year are excluded from the analyses. The number of track sections varies over the years as sections are divided or merged, new sections open and some are closed. The number of different track sections used in the analyses; i.e., sections where we have information on both train traffic flow and existing crossings are 213.7 The length of the track sections varies from less than one km to nearly 274 km
and the number of crossings at each section varies from only one or two (or even zero for some of the years) to almost 300 crossings. In addition, the amount of traffic on each section/crossing varies substantially, as shown in Figure 1. The distribution is skewed with a mean yearly traffic volume of 6 836, i.e. 19 trains per day, and a median value at 4 619, i.e. 13 trains per day. In Figure 1 we have excluded the 456 crossings that have more than 50 000 passing trains per year. Figure 2 displays the corresponding distribution of the logarithm of the number of crossings. This distribution is obviously less skewed.
6 The imputation procedure is outlined in Andersson (2006).
7 Including the Swedish state-owned rail network and the so-called “Inland track” (“Inlandsbanan” in
10
Figure 1. Traffic volume distribution
Figure 2. Logarithm of traffic volume distribution
The data on crossings used in the analysis covers thirteen years (2000-2012). During this period some crossings have been closed, others have been reconstructed with a new type of protection device while some new crossings have also been built.8 This means that our
data set is an unbalanced panel but the variation over time within the same crossing when it comes to traffic flow and protection devices is very small compared to the variation between crossings. The crossings are divided into four categories based on protection device, which obviously also affect accidents rates (Cedersund, 2006): (i) full barriers, (ii) half barriers, (iii) light/sound and (iv) totally unprotected/crossings with crossbucks. Full barriers are barriers that close both the approach side of the crossing and the exit side while half barriers only close the road at the approach side. The category light/sound consists of crossings without barriers but with protection devices in the form of flashing lights and/or sound. The fourth category consists of passive crossings with neither barriers nor lights or sounds. Some of these crossings are equipped with crossbucks or other simple devices while others totally lack protection device. We pool these in a common category. This is motivated by a former study (Cedersund, 2006) on Swedish level crossings showing that crossings with and without crossbucks are equally risky. Hereafter, we call the crossings included in the fourth category unprotected crossings. Traffic flows of motor vehicles and unprotected road users are important control variables in our models. The larger these flows are, the larger is the probability of an accident during a year. To capture the influence from traffic flow of motor vehicles, information on the type of road that crosses the railway is used as a proxy variable. In a previous Swedish study, Lindberg (2006) compared the results obtained with a model estimated on a sample using this proxy variable and a subsample of his original data including road traffic flow. He found that the same conclusions regarding rail traffic and
8 An inspection of the data shows that 90 level crossings have been reconstructed with a new protection
device sometime between 2010 and 2012. However, it is difficult from the information in the data to find out when, and maybe if at all, this reconstruction has been made. For these crossings, we have set the year of the reconstruction to 2010.
11
protection devices could be drawn from both models and that the results regarding the road type reflected the expected road traffic volume. We follow Jonsson (2011) in using three categories for road type: (i) national/regional, (ii) street/other roads, and (iii) private roads.9 As a proxy variable for the number of vulnerable road users (pedestrians
and bicyclists) passing the crossings, we use the number of persons (no age restriction) living within 2 kilometers from the crossing (cf. Isacsson and Liss , 2016). This data has been received from Statistics Sweden. The number of persons living in an area within 2 kilometres from the crossing is 2 188 persons on average (median = 348), and the range is from 0 to 108 870 persons.
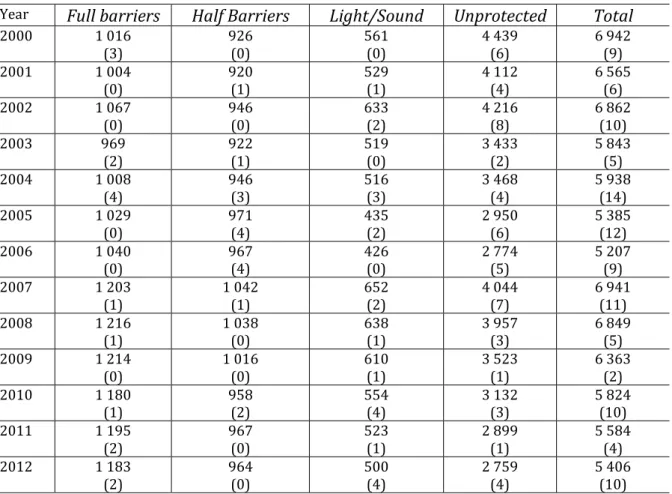
In Table 1a, the numbers of crossings and accidents are presented for each year included in the model of motor vehicle accidents. The corresponding information included in the model of vulnerable road user accidents is presented in Table 1b. The sum of observations on crossings over all years in the original data pertaining to motor vehicle accidents is 81309 (years 2000 to 2012), which implies a yearly average number of crossings of approximately 6 776. Due to missing information on key variables or other problems with the data, we use a total of 79 709 observations on crossings in the model of motor vehicle accidents. The corresponding number of observations used in the model of vulnerable road user accidents is 17 913 (years 2010 to 2012). The “other data problems” pertain, for example, to difficulties in matching each individual crossing over the years to other data sources used. Most of the problems pertain to unprotected crossings, which make it look like the number of these crossings is first decreasing and then again is increasing heavily between the years 2006 and 2007. In 2012, our data (from “plk-webb”) included 7 178 crossings after all closed crossings are omitted. Another 1 032 crossings are omitted due to no train traffic on those sections (according to data from the Swedish Transport Administration) or because the crossings are located on a yard. Finally, another 210 crossings have to be omitted because missing data in some of the variables included in our models, resulting in 5 936 crossings year 2012. According to official statistics (Trafikanalys, 2013a) there existed 7 380 level crossings in the Swedish rail network in 2012. The reason why this number differs from our number of crossings is, besides the reasons already mentioned, that our data material is only based on information from tracks that are administered by the Swedish Transport Administration (i.e., Swedish state-owned rail network and “Inlandsbanan”).
Note also that in the model of motor vehicle accidents no footpath crossings are included. However, we include crossings where the railway is crossed by a road that are for pedestrians only because we consider the possibility that also mopeds and other such motorized vehicles could pass such crossings. In the model of vulnerable road users all types of crossings are included. However, due to the fact that the Swedish Transport Administration earlier did not categorize accidents between vulnerable road users and trains as crossing accidents, we only have information about these accidents for the years 2010 to 2012. From Tables 1a and 1b we also see that the number of accidents between trains and motor vehicles for the years 2000 to 2012 is 107 and the number of accidents between trains and vulnerable road users for the years 2010 to 2012 is 31 (including suicides).
12
Table 1a. Number of crossings and related accidents (in parentheses) in the sample 2000-2012: motor vehicle accident model
Year Full barriers Half Barriers Light/Sound Unprotected Total
2000 1 016 (3) 926 (0) 561 (0) 4 439 (6) 6 942 (9) 2001 1 004 (0) 920 (1) 529 (1) 4 112 (4) 6 565 (6) 2002 1 067 (0) 946 (0) 633 (2) 4 216 (8) 6 862 (10) 2003 969 (2) 922 (1) 519 (0) 3 433 (2) 5 843 (5) 2004 1 008 (4) 946 (3) 516 (3) 3 468 (4) 5 938 (14) 2005 1 029 (0) 971 (4) 435 (2) 2 950 (6) 5 385 (12) 2006 1 040 (0) 967 (4) 426 (0) 2 774 (5) 5 207 (9) 2007 1 203 (1) 1 042 (1) 652 (2) 4 044 (7) 6 941 (11) 2008 1 216 (1) 1 038 (0) 638 (1) 3 957 (3) 6 849 (5) 2009 1 214 (0) 1 016 (0) 610 (1) 3 523 (1) 6 363 (2) 2010 1 180 (1) 958 (2) 554 (4) 3 132 (3) 5 824 (10) 2011 1 195 (2) 967 (0) 523 (1) 2 899 (1) 5 584 (4) 2012 1 183 (2) 964 (0) 500 (4) 2 759 (4) 5 406 (10)
Table 1b. Number of crossings and related accidents (in parentheses) in the sample 2010-2012: vulnerable road user accident model
Year Full barriers Half barriers Lights/sound Unprotected Footpaths Total
2010 1 176 (6) 947 (1) 539 (1) 2 953 (0) 534 (0) 6 149 (8) 2011 1 192 (6) 953 (2) 510 (0) 2 733 (0) 535 (1) 5 923 (9) 2012 1 179 (10) 951 (0) 485 (0) 2 592 (0) 528 (4) 5 735 (14)
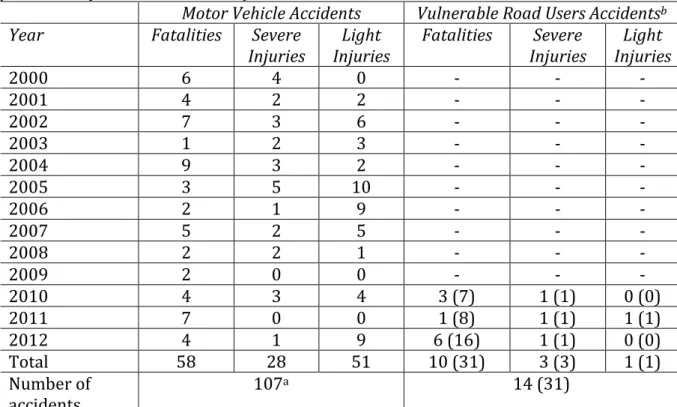
Table 2a presents descriptive statistics on the number of persons being killed, severely or lightly injured in accidents between trains and motor vehicles and vulnerable road users (pedestrians and bicyclists) for each year between 2000 and 2012 and the corresponding totals. The table displays the information excluding and including suicides for the latter type of accident. In 2012, for example, 4 persons were killed and 1 was severely injured and 9 were lightly injured in accidents between trains and motor vehicles. In the same year and excluding suicides, we see that 6 vulnerable road users were killed and 1 was severely injured while no vulnerable road user was lightly injured. The number of vulnerable road users killed in 2012 increases to 16 when we include suicides. At the bottom of the table we see that the total number of motor vehicle accidents in the data set between 2000 and 2012 is 107 (Table 1a contains information on the number of accidents
13
each year). The total number of accidents involving vulnerable road users is 14 when excluding suicides and 31 when including suicides. Note that we only have information for vulnerable road user accidents in 2010, 2011 and 2012.
Table 2a. Descriptive Statistics: Distribution of injury severity (including suicides in parentheses) and total number of accidents
Motor Vehicle Accidents Vulnerable Road Users Accidentsb
Year Fatalities Severe
Injuries Injuries Light Fatalities Injuries Severe Injuries Light
2000 6 4 0 - - - 2001 4 2 2 - - - 2002 7 3 6 - - - 2003 1 2 3 - - - 2004 9 3 2 - - - 2005 3 5 10 - - - 2006 2 1 9 - - - 2007 5 2 5 - - - 2008 2 2 1 - - - 2009 2 0 0 - - - 2010 4 3 4 3 (7) 1 (1) 0 (0) 2011 7 0 0 1 (8) 1 (1) 1 (1) 2012 4 1 9 6 (16) 1 (1) 0 (0) Total 58 28 51 10 (31) 3 (3) 1 (1) Number of accidents 107 a 14 (31)
Notes: (a) In the data there was 107 motor vehicle accidents. However, two of these pertain to the same crossing and is treated as one accident in the empirical analysis. Hence, we use 106 accidents when calculating the average cost per accident (cf. equation 6 and Table 2b). (b) We only use data on vulnerable road user accidents in 2010-2012 in the analyses for reasons given earlier in the text.
By combining the totals of fatalities, severe and light injuries in Table 2a with information from the ASEK 6.0 report (Trafikverket, 2016) on the values of saving a statistical life (VSL) and avoiding a statistical severe injury (VSI) and a statistical light injury (VLI), respectively, we can estimate the average costs per accident in the data set (cf. equation 6). These values cover both material costs in the form of lost income and health care and risk valuation and they are displayed in Table 2b. Here we see that the average cost per accident for motor vehicle accidents is 16.0 millions SEK and the corresponding figure for vulnerable road user accidents is 20.9 millions SEK when excluding suicides. The latter figure increases to 28.2 millions SEK when including suicides in the calculation.
Table 2b. Descriptive Statistics: VSLa, VSIb and VLIc (Millions SEK) and average cost per
accident (C) - Millions SEK (including suicides in parentheses)
Motor Vehicle Accidents Vulnerable Road Users Accidents
VSLa VSIb VLIc VSLa VSIb VLIc
Valued 27.7 5.1 0.3 27.7 5.1 0.3
C 16.0 20.9 (28.2)
Notes: SEK 1 ≈ EUR 0.1. (a) VSL is short for the value of a statistical life, (b) VSI is the value of a statistical severe injury, (c) VLI is short for the value of a statistical light injury, (d) Price level in 2017
14
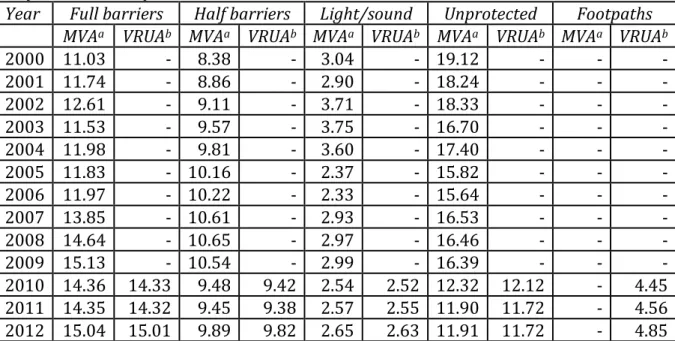
Table 3 presents the total number of train passages in level crossings for each year by type of accident (motor vehicle accidents or vulnerable road user accidents) and type of protection device (full barriers, half barriers, light/sound, unprotected and footpaths). We see for example that in 2012 some 15 million trains passing crossings where the protection device was full barriers. We also see that there is an increase between 2000 and 2012 in the number of trains passing in crossings with full barriers and that the number of trains passing unprotected crossings decreases between the same years. This is partly an effect of changes in the number of crossings with different protection devices observed in the data discussed above (cf. Table 1a). Note also that the change over time in total number of train passages depend on the total number of crossings included in the data set (cf. Table 1a).
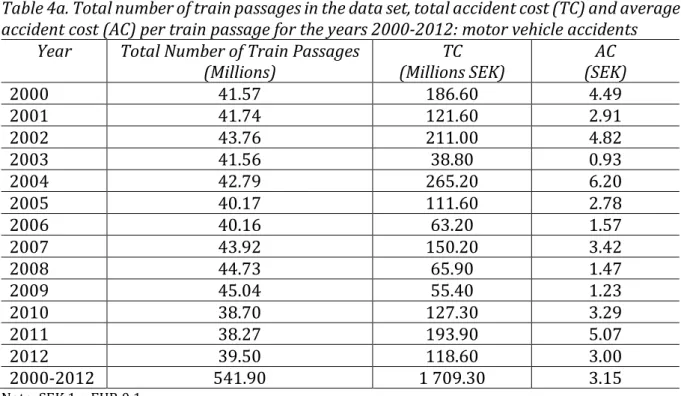
Table 4a presents the total number of train passages summed over the different types of crossing in Table 3, the corresponding total accident cost and average accident cost per train passage pertaining to motor vehicle accidents for each year 2000-2012. Here we see for example that the total accident cost in 2012 was 118.60 millions SEK and that the corresponding average cost per train passage was 3.00 SEK. There is a dip in the total number of train passages between 2009 and 2010. This was explained earlier in this section (cf. Table 1a). Table 4b presents the corresponding information pertaining to vulnerable road user accidents. Here we see, for example, that the total accident cost in 2012, excluding suicides, was 171.30 millions SEK and that the corresponding average cost per train passage was 3.89 SEK. The corresponding figures when including suicides are 448.30 millions SEK and 10.18 SEK.
Table 3. Descriptive Statistics: Total number of train passages (millions) by type of crossing and year in the sample
Year Full barriers Half barriers Light/sound Unprotected Footpaths
MVAa VRUAb MVAa VRUAb MVAa VRUAb MVAa VRUAb MVAa VRUAb
2000 11.03 - 8.38 - 3.04 - 19.12 - - - 2001 11.74 - 8.86 - 2.90 - 18.24 - - - 2002 12.61 - 9.11 - 3.71 - 18.33 - - - 2003 11.53 - 9.57 - 3.75 - 16.70 - - - 2004 11.98 - 9.81 - 3.60 - 17.40 - - - 2005 11.83 - 10.16 - 2.37 - 15.82 - - - 2006 11.97 - 10.22 - 2.33 - 15.64 - - - 2007 13.85 - 10.61 - 2.93 - 16.53 - - - 2008 14.64 - 10.65 - 2.97 - 16.46 - - - 2009 15.13 - 10.54 - 2.99 - 16.39 - - - 2010 14.36 14.33 9.48 9.42 2.54 2.52 12.32 12.12 - 4.45 2011 14.35 14.32 9.45 9.38 2.57 2.55 11.90 11.72 - 4.56 2012 15.04 15.01 9.89 9.82 2.65 2.63 11.91 11.72 - 4.85
15
Table 4a. Total number of train passages in the data set, total accident cost (TC) and average accident cost (AC) per train passage for the years 2000-2012: motor vehicle accidents
Year Total Number of Train Passages
(Millions) (Millions SEK) TC (SEK) AC
2000 41.57 186.60 4.49 2001 41.74 121.60 2.91 2002 43.76 211.00 4.82 2003 41.56 38.80 0.93 2004 42.79 265.20 6.20 2005 40.17 111.60 2.78 2006 40.16 63.20 1.57 2007 43.92 150.20 3.42 2008 44.73 65.90 1.47 2009 45.04 55.40 1.23 2010 38.70 127.30 3.29 2011 38.27 193.90 5.07 2012 39.50 118.60 3.00 2000-2012 541.90 1 709.30 3.15
Note: SEK 1 ≈ EUR 0.1
Table 4b. Total number of trains passages in the data set, total cost (TC) and average cost (AC) per train passage for the years 2000-2012: vulnernable road user accidents (costs including suicides within parentheses)
Year Total Number of Train Passages
(Millions) (Millions SEK) TC (SEK) AC
2010 42.85 88.20 (199.00) 2.06 (4.64)
2011 42.54 33.10 (227.00) 0.78 (5.34)
2012 44.03 171.30 (448.30) 3.89 (10.18)
2010-2012 129.41 292.60 (874.30) 2.26 (6.76)
Note: SEK 1 ≈ EUR 0.1
5 RESULTS
5.1 Model specification and results
It seems likely that the flow of traffic increases the probability of an accident by increasing the number of occasions when a train can collide with a road vehicle or a vulnerable road user (conditional on crossing characteristics). In other words, exposure will increase with the traffic volume of both trains and road vehicles. The speed of both the trains and the road vehicles also influences the probability of an accident. At the same time, a crossing with more frequent train traffic will induce a more precautional behaviour from the road users hence reducing the probability of an accident. This behavioural effect among road users could in some traffic situations override the effect from more collision occasions. In that case the accident probability would fall with the number of passing trains and the marginal cost would be negative. Thus, it seems relevant to consider the functional form
16
of the empirical model relating accidents to traffic flows.10 Here we tested the functional
forms outlined in equations (7), (8) and (9).
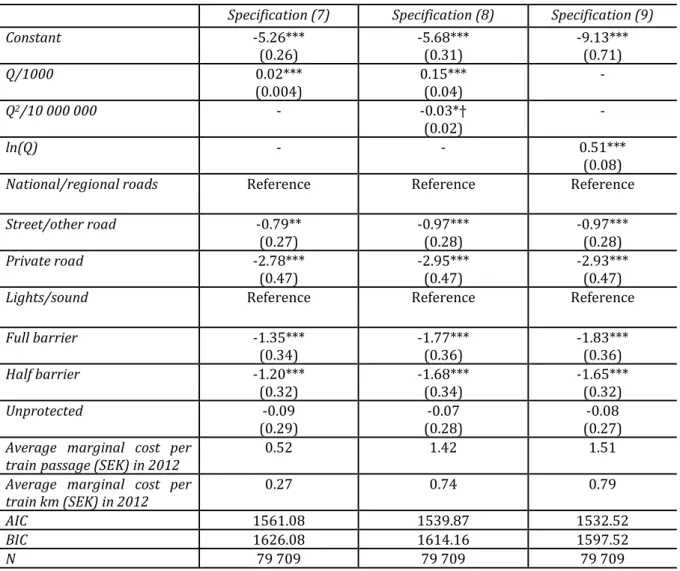
As noted previously, the logarithm of train passages (ln(Q)) significantly increases the accident probability (specification 9). Since the probability of an accident is very low in the sample, the parameter indicates that the average risk elasticity is close to 0.51.11 The
road type variables are significant and with the expected signs where crossings with streets/other roads and private roads have a significantly lower accident probability than the reference category national/regional roads where the flow of cars are relatively large. Crossings with full and half barriers have a significantly lower accident probability than the reference category crossings with lights/sound while the unprotected crossings do not differ from the reference category.
10 More precautional behaviour is not without cost (Steimetz, 2008). This risk-reducing behaviour in the form of
speed reduction or possible anxiety that the road user feels when passing a crossing that is perceived as unsafe should be included in a full measure of the accident cost. Unfortunately, it is impossible or at least very hard to observe this risk-reducing behaviour and our measure of the accident externality from train traffic therefore only includes the estimated effect on the accident probability and not the increase in accident avoidance costs for the road users. A level crossing accident may also lead to costs in the form of time delays for both train users and road users. This cost is not included in our estimates.
11 From equations 9 and 9’ we see that the risk elasticity is equal to 𝜕𝜕𝜕𝜕
𝜕𝜕𝑄𝑄𝑇𝑇
𝑄𝑄𝑇𝑇
17
Table 5. Regression results and implied marginal costs, motor vehicle accidents
Specification (7) Specification (8) Specification (9)
Constant -5.26*** (0.26) -5.68*** (0.31) -9.13*** (0.71) Q/1000 0.02*** (0.004) 0.15*** (0.04) - Q2/10 000 000 - -0.03*† (0.02) - ln(Q) - - 0.51*** (0.08)
National/regional roads Reference Reference Reference
Street/other road -0.79**
(0.27) -0.97*** (0.28) -0.97*** (0.28)
Private road -2.78***
(0.47) -2.95*** (0.47) -2.93*** (0.47)
Lights/sound Reference Reference Reference
Full barrier -1.35*** (0.34) -1.77*** (0.36) -1.83*** (0.36) Half barrier -1.20*** (0.32) -1.68*** (0.34) -1.65*** (0.32) Unprotected -0.09 (0.29) (0.28) -0.07 (0.27)-0.08
Average marginal cost per
trainpassage (SEK) in 2012 0.52 1.42 1.51
Average marginal cost per
train km (SEK) in 2012 0.27 0.74 0.79
AIC 1561.08 1539.87 1532.52
BIC 1626.08 1614.16 1597.52
N 79 709 79 709 79 709
Notes. Standard errors within parentheses are corrected for clustering on crossing. *p < .05, **p < .01, ***p < .001. SEK 1 ≈ EUR 0.1
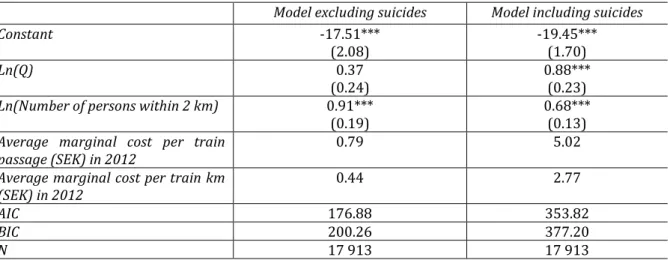
In Table 6, the results from the model of accidents involving vulnerable road users are presented.12 Here we focus on the logarithmic specification of the model. However, and
as noted earlier, for vulnerable road users it is important to consider potential differences between the model estimated on the sample with or without suicides included. The logarithm of train passages increases the accident probability also in this model. The probability of an accident is very low also in this sample hence the parameter indicates that the average risk elasticity is close to 0.37 in the model excluding suicides and close to 0.88 when suicides are included. The p-value of the estimated parameter in the model excluding suicides is, however, slightly above 10 percent indicating that the number of train passage is not significantly different from zero at conventional levels of significance. Hence, the implied weighted average marginal cost per train passage and the corresponding marginal cost per train kilometer must be interpreted cautiously. With this
12 In 106 observations, the number of persons living within 2 kilometres from the crossing was zero.
Because we use the logarithm of this variable in the model, we chose to replace these values with the value 1 to not lose these observations. A comparison between a model with and without these observations show that the values of the coefficients were exactly the same.
18
remark in mind we note that the average marginal cost in 2012 per train passage is 0.79 SEK and 0.44 SEK per train kilometer when suicides are excluded. The model including suicides suggests that the corresponding figures are 5.02 SEK per train passage and 2.77 SEK per train kilometer.
Table 6. Regression results from the logarithmic model and implied marginal costs, vulnerable road user accidents
Model excluding suicides Model including suicides
Constant -17.51***
(2.08) -19.45*** (1.70)
Ln(Q) 0.37
(0.24) 0.88*** (0.23)
Ln(Number of persons within 2 km)
0.91*** (0.19) 0.68*** (0.13)
Average marginal cost per train
passage (SEK) in 2012 0.79 5.02
Average marginal cost per train km
(SEK) in 2012 0.44 2.77
AIC 176.88 353.82
BIC 200.26 377.20
N 17 913 17 913
Note. Standard errors within parentheses are corrected for clustering on crossing. *p < .05, **p < .01, ***p < .001. SEK 1 ≈ EUR 0.1
5.2 Marginal cost heterogeneity
From equation 9’ it is clear that the marginal cost will vary between different crossings depending on crossing characteristics. This heterogeneity in the estimated marginal cost is displayed in Table 7. The table shows weighted average marginal cost estimates per passage for each combination of road type and protection device where crossings with many passages have a higher weight than crossings with few passages. Because the marginal effect decreases with the number of passages, the differences between the crossings increases when weighting by the number of passages than when taking an unweighted average across the crossings. The differences between crossings reflect both differences in protection device, road type, and number of train passages.
Table 7. Marginal cost per train passage for different combinations of road type and protection device – based on weighted average traffic and motor vehicle accidents, year 2012 (SEK)
Full barrier Half barrier Light/sound Unprotected
National/regional 1.12 1.60 17.82 -
Street/other road 0.47 0.62 4.26 3.89
Private road 0.06 0.07 0.43 0.63
Notes. The marginal costs are derived from specification 9 of the model. SEK 1 ≈ EUR 0.1
5.3 Sensitivity tests
We have conducted a number of sensitivity tests of the results pertaining to specification 9 of the motor vehicle accident model. First, train speed probably also influences the accident probability and one way of capturing train speed is to distinguish between
19
freight trains and passenger trains where freight trains in general are slower than passenger trains. However, we did not find any separate effect from different train types in the estimation.
Secondly, in the main analysis of the model of motor vehicle accidents we used road type as a proxy for the flow of motor vehicles. An alternative to this is to use the logarithm of the number of persons within 2 km of each crossing; i.e. the same control variable for traffic flow as in the model of accidents involving vulnerable road users. We tested this and the results indicated a substantially higher risk elasticity and a weighted average marginal cost of 3 SEK per train passage. We conjecture that this is a consequence of road type being a better proxy for the flow of motor vehicles. The number of persons within 2 km of each crossing is probably less relevant for explaining motor vehicle flows than the flow of pedestrians and cyclists since these modes are used for shorter trip distances than motor vehicles. Hence, the flow of train traffic may pick up more of the effect of motor vehicle flows in the model using the number of persons within 2 km of each crossing as a proxy for motor vehicle flows. In other words, some of the effect pertaining to the flow of motor vehicles will wrongfully be attributed to the flow of trains.
Thirdly, using road type as a proxy for motor vehicle flows fails to account for potential trends in motor vehicle flows. Hence, there is a risk that the effect of motor vehicle flows will wrongfully be picked up by the number of train passages. For this reason we estimated a model including a full set of yearly dummy variables. The estimated risk elasticity was more or less the same, however, as in the model reported in Table 5 (specification 9).
Fourthly, the number of accidents is rather small in a given year and varies substantially across the years in the sample. To illustrate this we calculated the marginal accident cost per train passage using equation 10. Since the probability of an accident is ‘small’, the risk elasticity is approximately equal to the parameter related to the logarithm of train passages (specification 9 in Table 5). By comparing the results obtained with equation 10 applied to specification 9 in 2012 to the properly calculated weighted average marginal cost in Table 5, we also provide an assessment of the accuracy of using the simple formula in equation 10. This sensitivity test suggest that the marginal cost per train passage varies between 0.93 SEK (in 2003) and 6.20 SEK (in 2004). This illustrates the problem of using the average cost per accident in one year to calculate the marginal cost per train passage (cf. Table 5 and 7) when the number of accidents is small in a given year and there is substantial variation in the number of accidents between years. We also found that the estimated marginal cost obtained with equation 10 is 1.53 SEK per train passage in 2012.
6 DISCUSSION
In this paper, we have estimated accident probability models for level crossing accidents both for motor vehicles and for vulnerable road users (pedestrians and bicyclists) and based on these models we estimated marginal accident costs. The results show that the probability of an accident increases with the train traffic volume and that the marginal costs differ substantially between different road types and between different protection devices. The probability of an accident also increases as the number of persons living nearby a crossing increases.
20
The accident charge today in Sweden due to level crossing accidents is set to 0.34 – 0.80 SEK per train kilometer (Trafikanalys, 2014) based on an earlier study using accident records for 2000-2008 (Jonsson, 2011) and motor vehicle accidents only. The accident charge per km in the present study was estimated to SEK 0.79 for accidents between trains and motor vehicles and SEK 0.44 for accidents involving vulnerable road users (SEK 2.77 if we include suicides). In the earlier study, the weighted average marginal cost per train passage was estimated to a value of SEK 1.13 in 2008, compared to SEK 1.51 for motor vehicle accidents in 2012 in the present study. Besides including vulnerable road users in the present paper, we have enlarged the data set, which now also includes the years 2009 to 2012. We also base the estimation on other data regarding traffic volume, which now includes station areas. The values used for the different injury severity levels are also updated according to the official Swedish values, which can explain some of the difference in average marginal cost between the two studies.
We consider it possible to add the average marginal cost of motor vehicle accidents and the average marginal cost of vulnerable road users to arrive at a total average marginal accident cost. The crossings in the two models are indeed overlapping, but the accidents and the accidents costs are unique in each model. However, we recommend that more variants of models for vulnerable road users are performed before these values are implemented. A main reason is that the average marginal cost of vulnerable road user accidents (excluding suicides) is based on a risk elasticity that is only close to being significantly different from zero at the 10 percent level. Hence it is advisable to interpret the related marginal costs carefully. Furthermore, it is unclear how suicides among the unprotected road users should be treated in the context of marginal costs. We have only noted that some previous Swedish studies have excluded them in the calculation.
We have also presented three different specifications of the probability model of motor vehicle accidents. Two of these provide similar estimates of the average marginal accident cost with one of these being the preferred specification. This does not imply, however, that the estimated marginal cost for specific crossings need to be similar in the two specifications. The reason is that they deal with the non-linearity of the relationship between accidents and traffic flow in somewhat different ways and the marginal cost of a specific crossing depends inter alia on the traffic volume. More specifically, the quadratic specification implies that for large enough values of the train traffic flow, the marginal cost may have the ‘wrong’ sign whereas this is not the case with the preferred logarithmic specification. Hence in some instances it may be important to consider how the selected model behaves for different values of traffic flow. This is obviously related to the intended use of the model.
Although we have conducted a number of sensitivity analyses we note that the estimated marginal costs may be sensitive to a number of other issues; e.g. missing data, the exclusion of accidents resulting in no injuries or fatalities, and the use of proxy variables for the flow of motor vehicles and vulnerable road users. There may also be additional cost elements that were not considered here; e.g. the cost of precautional behavior and non-internalized costs of disturbances in rail traffic. These issues are left for future research.
21
7 REFERENCES
Andersson, M. (2006). “Marginal Cost Pricing of Railway Infrastructure Operation, Maintenance, and Renewal in Sweden: From Policy to Practice Through Existing Data”,
Transportation Research Record No. 1943, pp. 1-11.
Cedersund, H.-Å. (2006). Trafiksäkerhet i plankorsningar mellan väg och järnväg
1999-2004. [Traffic safety at grade crossings between road and rail – 1999–2004]. (VTI report
540). Stockholm, Sweden: Swedish National Road and Transport Research Institute. In Swedish.
Dickerson, A., Peirson, J. & Vickerman, R. (2000), “Road Accidents and Traffic Flows: An Econometric Investigation”, Economica 67: 101–21
Elvik, R. (1994), “The External Costs of Traffic Injury: Definition, Estimation, and Possibilities for Internalization”, Accident Analysis and Prevention 26 (6): 719-732.
Isacsson, G. & Liss, V. (2016). Externa marginalkostnader för olyckor i vägtrafik.
Uppdaterade beräkningar för det statliga vägnätet i Sverige [External marginal costs of
road traffic accidents. An update for the Swedish national road network]. (VTI report 896). Stockholm, Sweden: Swedish National Road and Transport Research Institute. In Swedish.
Jacobsen, P.L. (2003), “Safety in numbers: more walkers and bicyclists, safer walking and bicycling”, Injury Prevention 9:205–209.
Jansson, J.-O. (1994), “Accident Externality Charges”, Journal of Transport Economics and
Policy: 31-43.
Jonsson, L. (2011). Marginal cost estimation for level crossing accidents: Evidence from the
Swedish railways 2000-2008. Scandinavian working papers in Economics, Nr. 2011:15.
Leden, L. (2002), “Pedestrian risk decrease with pedestrian flow. A case study based on data from signalized intersections in Hamilton, Ontario”, Accident Analysis and Prevention 34: 457–464.
Lindberg, G. (2001), “Traffic Insurance and Accident Externality Charges”, Journal of
Transport Economics and Policy, 35 (3): 399-416.
Lindberg, G. (2002). Accident cost case studies (Case study 8c). The marginal cost of
road/rail level crossing accidents on Swedish railways. UNITE Deliverable 9. Funded by the
European Commission 5th Framework – Transport RTD. ITS, University of Leeds.
Lindberg, G. (2005), “Accidents”, in Measuring the Marginal Social Cost of Transport,
Research in Transportation Economics vol. 14, editors Nash, C. & Matthews, B. Elsevier.
Lindberg, G. (2006). Valuation and Pricing of Traffic Safety. Doctorial thesis. Örebro studies in economics 13, Örebro University.
22
Lord, D., Washington, S., & Ivan, J. (2005). Poisson, poisson-gamma and zero-inflated regression models of motor vehicle crashes: Balancing statistical fit and theory. Accident
Analysis and Prevention, 37, 35-46.
Nash, C. (2003). “Marginal cost and other pricing principles for user charging in transport: a comment”, Transport Policy, 10(4): 345-348.
Newbery, D.M. (1988), “Road User Charges in Britain”, The Economic Journal, 98 (Conference 1988): 161-176.
Oh, J., Washington, S. P., & Nam, D. (2006). Accident prediction model for railway-highway interfaces. Accident Analysis and Prevention, 38, 346-356.
Peirson, J., Skinner, I. and Vickerman, R. (1998), “The Microeconomic Analysis of the External Costs of Road Accidents”, Economica 65(259): 429-440
Shavell, S. (2004). Foundations of economic analysis of law. Harvard University Press. SIKA (2008). Samhällsekonomiska principer och kalkylvärden för transportsektorn:
ASEK 4, [Economic principles and valuations for CBA in the transport sector] SIKA PM
2008:3. In Swedish
Steimetz, S.S.C. (2008), “Defensive driving and the external costs of accidents and travel delays”, Transportation Research Part B 42: 703–724
Trafikanalys. (2013a). Bantrafik 2012. Statistik 2013:28 [Rail traffic 2012. Statistics 2013:28]. In Swedish.
Trafikanalys. (2013b). Bantrafikskador 2012. Statistik 2013:15 [Rail traffic accidents 2012. Statistics 2013:28]. In Swedish.
Trafikanalys. (2014). Transportsektorns samhällsekonomiska kostnader. Bilagor 2014 [Social benefit-costs in the transport sector. Attachments 2014]. PM 2014:3. In Swedish. Trafikverket. (2016). Analysmetod och samhällsekonomiska kalkylvärden för
transportsektorn: ASEK 6.0. Kapitel 9 Trafiksäkerhet och olyckskostnader [Methods and
values in social benefit-costs analyses for the transport sector: ASEK 6.0. Chapter 9 Traffic safety and accident costs]. Version 2016-04-01. In Swedish.
Vickrey, W. (1968), “Automobile accidents, tort law, externalities, and insurance: an economist’s critique”, Journal of Law and Contemporary Problems: 464-484.
Vitaliano, D.F. & Held, J. (1991), “Road accident external effects: an empirical assessment”,
Applied Economics 23: 373-378.