Lund University, Faculty of Engineering, LTH
December 2013
Internal best practice
benchmarking in global
corporations
Uncovering, defining and utilizing best
practices to grow spare parts sales
by Zlatan Alikadic
Supervisors: Gösta Wijk (Lund University), Viktor Hellblom (company),
Elin Liljemark (company)
ii
Acknowledgement
During this master thesis project and the past 4 months I have met some amazing and fascinating people. They have all, in some way, helped me carry my work forward to where it is today – finished. This day seemed so far away when it all started in September, 2013. I will be able to look back at this time with great joy and nice memories. I would hereby want to thank all people that have been involved.
There are some people that I owe a special thanks to. Johan Modig, thank you for introducing me to this great organization and for actively initiating this project. Gösta Wijk, thank you for your fruitful comments, meetings and interest in my projects. Lucky are the ones who you guide. Viktor Hellblom and Elin Liljemark, thank you for your help getting me up to speed and guiding me in this huge organization. Patrik Olofsson, Marcus Berg and Karolina Palmgren, thank you for having patience with all the spontaneous questions while you’ve been busy with your own work. You really made me feel as a part of your team even though I wasn’t around all the time. I will miss chatting and working with you! Finally, I would like to thank Dr. Kostas Selviaridis. Thank you for helping me when things didn’t look that bright, even though I was not your or your department’s responsibility.
Lund 20th of December 2013
iii
Abstract
The purpose of this master thesis is to help a global food packaging corporation, based in southern Sweden, to uncover, define and utilize best practices connected to selling spare parts. The defined best practices will later be implemented in the corporation’s market companies globally.
The methodology of the project has been to benchmark organizations with similar type responsibilities and work. The research design has mainly been divided into a quantitative analysis (analyzing sales data) and a qualitative analysis (interviews). The challenge has been to benchmark organizations that operate in different economical and political climates (macro economy) while their industries (micro economy) differ a lot as well. Therefore a benchmarking model has been developed to take these external factors into consideration. Thereby a relevant and trustworthy benchmarking output was achieved.
Two best practices were found to impact the performance of an organization (sales) positively and significantly. These best practices have been communicated to the company with a suggested implementation plan.
While uncovering the best practices, it has been found that organizations that perceive their competition to be intense tend to formulate a strategy. The existence of a strategy drastically improves the organization’s performance (sales). If the strategy is supported with relevant and related activities, the performance increases even further.
Keywords: internal bench marking, best practice, spare parts, standard components
v
Contents
List of abbreviations ... ix 1 Introduction ... 1 1.1 Problem description ... 5 1.2 Purpose ... 6 1.3 Delimitations ... 6 2 Company ... 9 2.1 After-sales division ... 102.2 Parts service unit ... 11
3 Theory ... 13
3.1 Theoretical background... 13
3.2 Theoretical approach ... 15
3.2.1 Benchmarking ... 15
3.2.2 PESTEL ... 18
3.2.3 Porter’s five forces ... 19
3.2.4 Business model canvas ... 21
3.2.5 Marketing mix (4 Ps) ... 25
4 Methodology ... 29
4.1 Quantitative study ... 29
4.2 Identifying objects to study ... 30
4.3 Interview – Qualitative study ... 30
4.4 Analysis... 32
vi
5.1 Data collection ... 33
5.2 Data Analysis ... 33
5.3 Interviews ... 36
5.3.1 Writing the questionnaire ... 36
5.3.2 Interviews ... 39
5.4 Analysis... 42
5.4.1 Distribution of sales between suppliers ... 42
5.4.2 Strategy ... 43
5.4.3 Organization ... 46
5.4.4 Activities ... 47
5.4.5 Market & Competition ... 50
6 Results and recommendations ... 53
6.1 Development of benchmarking methodology ... 58
6.2 Hypotheses ... 59
6.2.1 Effects of strategy and related activity ... 59
6.2.2 Effects of awareness ... 59
6.2.3 Summary ... 60
6.3 Recommendation ... 61
6.3.1 Ship promotional material with spare parts ... 62
6.3.2 Data driven opportunity analysis ... 62
7 Discussion and conclusions ... 65
7.1 Further research ... 65
vii 8 Reference list ... 69 Appendix 1 ... 72 Questionnaire ... 72 Appendix 2 ... 75 Market 1 ... 75 Market 2 ... 76 Market 3 ... 77 Market 4 ... 78 Market 5 ... 79 Market 6 ... 80 Market 7 ... 81 Market 8 ... 82 Market 9 ... 83 Market 10 ... 83 Market 11 ... 84
ix
List of abbreviations
5F – five forces (Porter’s)
CSR – customer service representative
DC – distribution centre
EPC – European parts centre
KPI – key performance indicator
MC – market company
OEM – original equipment manufacturer
SCD – supply chain disintermediation
SKU – stock keeping unit
SPOC – single point of contact
SPSS – spare parts sales support
1
1 Introduction
Usually companies have over the years made their profits when selling their main products to their customers. But with globalization competition has increased and margins on products decreased. Therefore, the lost profits have to be found or made somewhere else. Manufacturing companies today are realizing the potential in the aftermarket. The market that is created after the sale of their main products has taken place. This market is dominated by e.g. spare parts and services like maintenance, training etc. Benchmarks among manufacturing companies show that service revenues accounts for 25% of a company’s total revenue and 46% of the profits. Profit margins in the aftermarket are in average 75% higher than a company’s main business (Deloitte, 2006). An Accenture study found that “GM earned relatively more profits from $9 billion in aftermarket sales revenues in 2001 than it did from $150 billion of income from car sales” (Cohen & Agrawal, 2006).
Some companies have seized the potential on the aftermarket better than others. Customers today are looking at the total cost of ownership for a product and are demanding excellent after-sales service like long warranties, quick repairs or replacements when the product fails.
Saturn and Caterpillar have chosen top after-sales services as their main competitive tools in their respective markets. Caterpillar, which manufactures earth moving equipment, is able to ship 99.7% of their 600,000 spare parts to their installed base of equipment, which require maintenance up to 40 years, within 24 hours. Saturn had among the highest customer satisfaction scores in their industry thanks to their after sales support and spare parts supply chain.
The jet-engine manufacturer Rolls-Royce has aligned their whole corporate strategy to the aftermarket with their trademarked “Power by the hour” concept
2
where aircraft owners, mainly airlines, pay for the hours they use the engines while Rolls-Royce takes care of all the maintenance, spare parts etc.
By “locking” customers into service contracts like Rolls-Royce’s, manufacturers can command up to 7 times higher profits during a products life time compared to the sale of the original product (Knowledge@Wharton, 2007). Car manufacturers, for instance, have forced their customers to repair their cars at authorized dealers to maintain their warranty. They have also kept competition out with various intellectual property regarding design and software of spare parts and diagnostics tools. This unfair advantage upset both European Union and the US government who both stepped in and regulated the market for repairs and maintenance of cars.
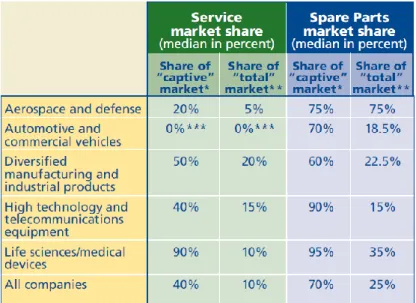
Even though the aftermarket offers a very lucrative business opportunity for most companies, 67% grow their after-sales services slower than their main business. A Deloitte benchmark show that the median company only has a 40% service market share of its captive market, which is the company’s own installed machine base, and a 70% spare parts market share (see figure 1.1).
3
Original equipment manufacturers (OEMs) are not the only ones trying to capture a share of the market. Suppliers to OEMs and other competitors are giving the OEMs a run for their money, by approaching their customers directly. The barriers to entry the aftermarket are low for a supplier since they already supply the spare parts to the OEM which later sells them to the customer with a profit (see figure 1.2).
Figure 1.2 Conventional flow of spare parts.
The current trend is that suppliers are trying to sell directly to the OEM’s customer (see figure 1.3). They can successfully compete with the OEM by offering a lower price and still command a high margin on the goods sold. This phenomenon is called supply chain disintermediation (SCD) and describes a structural change in a supply chain where new relationships, between new and existing actors, are created (Rossetti & Choi, 2005). This creates a lack of direct connection between the OEM and the customer. The lack of connection shifts the distribution of power, control and information in the network – in this case from the OEM to the supplier. In scientific papers this is regarded to as a “structural hole” (Ahuja, 2000).
4
Figure 1.3 Supply chain disintermediation.
Another source of competition are companies specializing in aftermarkets (“competitor” in figure 1.4 & 1.5). They offer customers a “one-stop-shop” solution for spare parts and maintenance. Usually their competence is within sourcing, so they are able to offer lower prices with high availability due to economies of scale. Their entrance into the existing network between OEMs, suppliers and customers contributes to the SCD. The relationships in the network are constantly changing (see figure 1.4).
5
1.1 Problem description
OEM’s today are facing tougher competition in their aftermarkets. Power, information and control of the networks are shifting away from the OEMs to other players. Unlike in the conventional flow of spare parts (figure 1.2), where the customer had one point of interaction, the OEM, customers today have multiple choices (see figure 1.5). This phenomenon is mainly affecting an OEM’s sales of standard spare parts, also known as standard components. This master thesis report is to examine how an OEM can strengthen their competitiveness and thereby increase sales of standard components by uncovering and defining internal efficiencies and best practices. Price is, of course, a way to compete, but there are other ways to become more competitive and attractive for customers e.g. delivery time, precision, availability etc. Are there any competitive tools for selling standard components “hidden” in the organization that can help to strengthen the position in the network? If yes, how can these be transferred between organizations efficiently?
Figure 1.5 Vendor-customer interactions today.
Customer
Supplier
OEM
6
1.2 Purpose
In a big organization one task can be performed in many different ways. Some ways are better and more efficient than others. This study’s purpose is to find, unveil and define best practices for processes connected to selling standard components as an OEM in order to strengthen the after-sales management.
In a global organization, like this case study company’s, it is hard for managers to be fully aware of how similar work is executed in other units of the corporation. Especially when divisions and units within the company have different levels of operational freedom, like the freedom of designing work processes. This results in that the same task is performed in different ways depending into which part of the organization one is looking. Some ways are bad, some are better, some are even good, but a few are superior. By uncovering and defining these “best-practices” an organization can dramatically increase the performance and output of their work. When they’re ignored, or not actively sought for, there are unnecessary organizational inefficiencies, costs and loss of sales. The findings in this study will serve as a central guideline for how organizations can optimize certain processes of work by implementing best practices uncovered in other parts of the same company. This will hopefully result in increased competitiveness and improved sales of standard spare parts in a competitive market alongside suppliers and competitors.
The potential of the aftermarket, together with the case study company’s limited experience of benchmarking performance, between its business units in different macro- and micro economical environments, where operational freedom is present make this study interesting from the company’s point of view.
1.3 Delimitations
To have a successful aftermarket business there are several areas a company must master. Usually most research is focused on the supply chain related operations
7
like stocking, forecasting, sourcing etc. This paper will not focus on addressing these factors. Instead, focus will be on how the after-sales organizations look like and how their work processes are designed.
This study will only be based on internal findings in the case study companies. One can argue that it might have been wise to reach out to customers to find what they value in a business relationship. Unfortunately, this is not possible due to the limited resources and time assigned to this project. This is clearly an area for further research.
An aftermarket business unit of a company provides different types of parts and services. Since this study is trying to define best practices for selling spare parts on a market with several actors, this study will strictly focus on standard spare parts since these are more easily provided by competitors compared to custom spare parts and technological know-how.
A popular way to secure the aftermarket is to “lock” customers into service contracts. This is a big and identified opportunity this case study company already has people working on. Service contracts are also sold in a completely different way than transactional spare parts. A service contract is usually sold together with new equipment. When signed, it eliminates several activities like marketing, active selling etc. since the parts and maintenance have practically already been sold. Since demand can be predicted more accurately, it increases availability which is a big competitive edge. In brief, a service contract removes a lot of challenges and activities transactional sales have, therefore this study will not focus on service contracts but only transactional sales.
The case company offers over 170 potential objects for study and analysis. Sadly not all of these can or will be analyzed due to limited resources and time assigned to this project.
8
The delimitations will help to make a complex business easier to understand and analyze. By focusing, the hopes are the output of the study will be more relevant and applicable.
9
2 Company
Our case study company is a major player in the food packaging and processing industry. It has a global presence with over 20,000 employees worldwide. The company, which is privately held, reported revenues of €11b. for the fiscal year of 2012.
It pioneered carton packaging for beverages during the 1950’s. Today the product portfolio consists of filling and packaging solutions for dairy, beverages, ice-cream, cheese etc.
This study is conducted on-site in one of the after-sales divisions at one of its branches in southern Sweden.
The company is divided into divisions based on activities. For instance, one division handles everything related to after-sales while others are responsible for equipment and packaging material.
Within every division there are units. Each unit is responsible for a more focused business area i.e. spare parts within the after sales division is managed by the Parts service unit.
Regardless if after-sales services, packaging material or equipment are being sold on a market, the market company (MC) is responsible. The market companies are representing the company on specific markets. The market companies are governed by different clusters depending on their geographical location.
Figure 2.1 shows a simplified and incomplete organizational chart of the company. The chart doesn’t show and explain all division, units, clusters or market companies. It shows how spare parts are managed within the company and sold through market companies. The purpose is to give a basic understanding of the spare parts business.
10
Figure 2.1 Organizational chart of the company spare parts business within the company.
2.1 After-sales division
There are several divisions within the company that focus on the aftermarket. The after-sales division this study is conducted at sells training, maintenance and spare parts to customers. Hereafter, this division will be referred to when writing after-sales division.
Other aftermarket divisions sell packaging material and other packaging related materials.
The after-sales division coordinates all of the related product and service sales worldwide. It coordinates the out- and inbound logistics for all distribution centers (DC) around the world. The DCs supply their assigned markets and customers with the requested goods and services. Stock levels, forecast and other types of inventory management are done centrally at the after-sales division.
Market
companies
Clusters
Governing MCsUnits
Divisons
Corporation
Company After-sales Parts service Cluster A MC A Cluster B MC B MC C11
Since this division makes forecasts and has an insight into each market’s sales, it formulates annual goals and targets. These are communicated to clusters, which governs over several markets in a designated geographical area. The clusters later break down these goals into sales growth and profitability each market should achieve during next year.
2.2 Parts service unit
Within the after-sales division there are several sub-units. One of these is parts services. Parts services has the overall responsibility for the spare parts business, including what is sold through contracts, to support, drive sales and pricing of spare parts and consumables (wear parts). Spare parts are divided into two main categories; unique and standard parts.
Unique parts are custom-made parts that require drawings or patents for manufacturing that only this company has in possession. Due to intellectual property, the competition’s barrier of entry is high for these parts, so therefore competition is almost non-existing. However, during recent years pirate-manufacturers, that offer some high-volume/low-tech parts from this assortment to some customers, have popped up. This is mainly taking place in the Far East.
Standard parts are purchased from different suppliers and re-sold through the company’s own organization. In other words, customers can purchase these parts from other vendors relatively easily. Other vendors comprises the company’s suppliers, firms specializing in the market and other OEM’s that supply after-sales products and services to their installed equipment at a customer’s site.
Parts services regularly analyze the sales of the spare part assortments on different markets. The analyses show e.g. if price adjustments are necessary. They also support the market companies with pricing issues like enquiries and pricing complaints.
13
3 Theory
To successfully conduct this study a multifaceted theoretical framework is needed. The framework will need to help understand each case study’s internal operations, the industry it operates in and the macro economic climate. A business’ performance and productivity is not only a result of the internal operations, but is external factors which cannot be managed that easily e.g. importing restrictions etc. By building a theoretical framework that takes external factors into consideration the real productivity can be measured. In other words, performance due to external factors will be dedicated to the external factors while operational efficiencies will be dedicated to the organization.
To sum it up, the framework will guide through the process of benchmarking, it will help understand the business and also help to understand the surroundings of each case study object and the impact it might pose in the business.
The purpose of this study is to find best practices by measuring the output of work processes in different organizations. By ensuring the measured outputs are correct, the results and recommendations will be more relevant and trustworthy.
Each one of the theories’ application and purpose will be given more detailed in section 4.
3.1 Theoretical background
There has been a several studies conducted on how a business should set up and optimize its logistics for a successful aftermarket operation (Cohen & Agrawal, 2006). Much of the research has focused on how to forecast and predict demand for a highly volatile spare parts market, this to be able to serve customers with spare parts with short lead-times without having to carry big inventories. Researchers also focus on finding efficiencies when it is necessary for a business to carry 15 to 20 times more stock keeping units (SKUs) than usual and when the majority of the
14
SKUs are slow moving SKUs. These are just a few of the differences between a manufacturing and an after-sales supply chain which figure 2.1 points out (Cohen & Agrawal, 2006). The many challenges a after-sales supply chain brings makes it very interesting object to study both from a operational but also commercial point of view.
Relatively little attention has been given to the aftermarket on a strategic level. How should a firm align its after-sales service organization strategically to capture as much as possible of its potential market?
Figure 2.1 Shows the differences between a manufacturing and after-sales services supply chain.
15
3.2 Theoretical approach
The study’s theoretical approach is based on well known frameworks within business planning, strategic management, marketing and benchmarking. Each of the five frameworks will be described in this section. How they were applied will be reflected on in section 4.
3.2.1 Benchmarking
To uncover, adopt and implement best practices in a company or organization benchmarking is a relevant approach. The definition of benchmarking that will be used is:
“The continuous process of measuring products, services, and practices against the company’s toughest competitors or those companies renowned as industry leaders.” (Camp, 1989)
Basically benchmarking is company-to-company comparison of processes and practices to identify the “best of the best” to attain competitive advantage with the main purpose of:
Establish there is a need for change
Identify what should be changed
Define how the organization should look after the change
The purpose of benchmarking is well aligned with our purpose of the project; therefore it will be an essential research method. To ensure benchmarking is done in a structured and valid way, the benchmarking process will follow a 10-step process described by Robert C. Camp.
The 10-step process model was developed to be relevant when conducting an internal benchmark as well. In fact, the main difference when performing an
16
internal benchmark lies within the decision whom to benchmark an data collection. Instead of doing a company-to-company benchmark, an internal benchmark is done between two departments performing the same or similar work. Also, when benchmarking internally, relevant data is usually easier to get which makes the output more accurate.
Figure 2.2 The formal 10-step benchmarking process. (Camp, 1989)
According to the 10-step process model there are five essential phases to benchmarking (see figure 2.2). The fifth phase, maturity, is not illustrated in the figure since it is not an active phase like the others that requires active input and monitoring.
17
3.2.1.1 Planning
During the first phase it is necessary to identify what and whom to benchmark. Look at different products or outputs that can be tracked to help improve overall performance. Consider what data will be needed for the benchmarking. Data needed varies depending on whether the benchmark is done externally or internally in a company.
3.2.1.2 Analysis
If conducting an external benchmark it is vital to fully understand the internal processes before comparing them to external organizations. When the internal processes are mapped and understood it is time to examine external best practices and measure the gap.
3.2.1.3 Integration
During this phase the findings of the benchmarking need to be communicated to upper management. Goals should be redefined accordingly to the findings.
3.2.1.4 Action
Action plans are to be developed and implemented and best practices accordingly. The process should be monitored to recalibrate best practices and benchmarks when ever needed.
3.2.1.5 Maturity
When all the best practices are implemented and benchmarking becomes a standard guide of work the organization has reached the maturity phase. Even though the organization has achieved, or soon to be, an industry leadership the benchmarking and improvement of performance levels never stops.
18
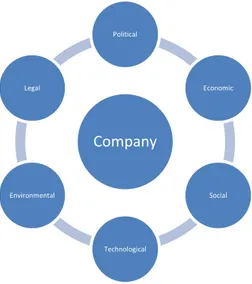
3.2.2 PESTEL
PESTEL is a framework used when conducting strategic analysis or market research externally. The model is designed to give an overview of a market’s macro environmental factors. The name, PESTEL, is an acronym for political, economic, social, technological, environmental and legal (Porter, 1980).
3.2.2.1 Political
Political factors include tax policies, labour laws, trade restrictions, tariffs etc. This pillar of the framework gives an overview of how much the government intervenes in the economy. Infrastructure, health and educations are also to be covered in this pillar.
3.2.2.2 Economic
Economic factors include the country’s economic growth, inflation rate, interest rate, currency and exchange rate. All these factors have a major impact on a business operations and there also its decisions.
Company Political Economic Social Technological Environmental Legal
19
3.2.2.3 Social
Social factors gives an overview of the demand for a company’s products or services by considering factors like age distribution, population growth, education etc.
3.2.2.4 Technological
Technological factors include rate of technological change, R&D activity, technology incentives etc. This helps to determine barriers of entry and outsourcing decisions but also understanding costs, quality and innovation.
3.2.2.5 Environmental
Environmental factors include ecological and environmental aspects like weather, wind, climate, climate change etc. Helps to understand how changes in these factors can affect a company’s operations.
3.2.2.6 Legal
Factors included here are consumer laws, antitrust laws, employment laws, health and safety laws etc. This has a big impact how a company’s operations should be designed.
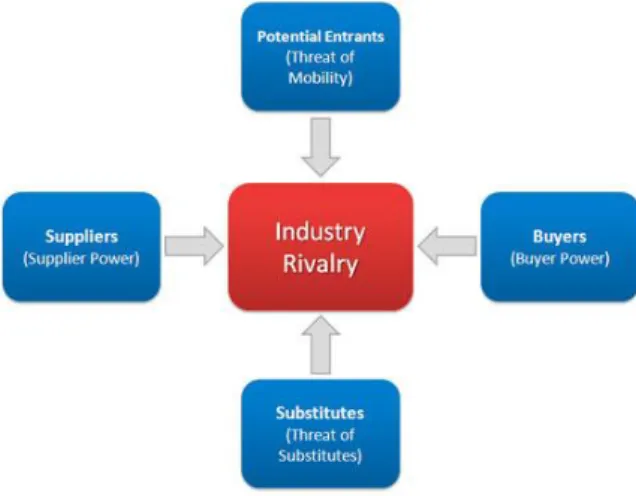
3.2.3 Porter’s five forces
Porter’s five forces is a framework for an external industry analysis and business strategy development. The framework gives an overview of the microeconomic environment since it focuses on a specific industry. The five forces in the framework are: threat of new entrants; threat of substitute products or services; bargaining power of customers; bargaining of suppliers and intensity of competitive rivalry. When all the five forces have been taken in consideration a company can determine a market’s attractiveness by the ability to serve customers
20
and still make a profit. If the majority of the forces are intense (high) the average industry profitability is low and low for the opposite (Porter, 2008).
Figure 2.4 Porter's five forces. (Porter, 2008)
3.2.3.1 Threat of new entrants
Profitable and attractive markets will attract new entrants. Unless barriers of entry aren’t established, new entrants will drive profits towards zero. There are several different ways to set up barriers of entry some examples are intellectual property, access to distribution, switching costs etc. By analysing this threat a company can predict the long-term profitability of an industry.
3.2.3.2 Threat of substitute products or services
Are there any offerings from competitors that aren’t exactly the same as our offering but does the same thing? This is a measure of product and service differentiation. If costs of switching are low and substitution is easy, customers’ propensity of switching is high.
21
3.2.3.3 Bargaining power of customers
This force tells how easy customers can put a company under pressure and how price sensitive they are. If the ratio between suppliers and customers is high, which means there is more supply than demand, customers can play the competition against each other and benefit from lower prices. This force also analyzes distribution channel dependencies and switching costs. If dependencies and switching costs are high it is harder for customers to apply pressure.
3.2.3.4 Bargaining power of suppliers
Just as the customers can put pressure on a company so can their suppliers. If there are a few substitutes for e.g. raw material, services, labour etc. suppliers can demand high prices or even refuse to work with a customer. This force examines a firm’s own switching costs between suppliers, dependencies, substitutes etc.
3.2.3.5 Intensity of competitive rivalry
This might be the major determinate of an industry’s competitiveness. This force gives an overview of how many firms are competing, what is the competitive advantage and if it is sustainable, advertising spending, transparency etc.
3.2.4 Business model canvas
The business model canvas is a tool for developing new and documenting existing business models. It documents a company’s offering, customers, finances and infrastructure by breaking the business model into nine blocks: value proposition; customer relationships; customers; channels; revenue; key activities; key resources; key partners and costs (Osterwalder, 2010).
22
Figure 6.5 Business model canvas. (Osterwalder, 2010)
3.2.4.1 Value proposition
A company’s value proposition is its collection of services and products it offers to its customers. The proposition can be quantitative like price and performance but also qualitative such as overall customer experience, service, brand etc.
3.2.4.2 Customers
In order to build and operate a successful business, a company must identify which customers it tries to serve. Dividing customers, based on different characteristics, is known as customer segmentation. A company must decide whether it’s going for the mass market or one or several niche markets.
23
3.2.4.3 Channels
How does a firm deliver its value proposition? Are the channels they use their own (stores), a partner’s (distributors) or a combination of both? Effective channels are fast, cost effective and efficient.
3.2.4.4 Customer relationships
A company must identify what type of relationship is needed with its customers. Different services/products and customers require different types of relationships. For instance some products require personal assistance with training and after-sales after a product is purchased, while sometimes automated self-service is good enough.
3.2.4.5 Revenue
There are several different ways of generating revenue streams. A firm must identify how it is going to make an income from each of its revenue streams. Different segments have different needs, so therefore it’s obvious they will not pay the same way. Some common revenue streams are:
Asset sales – selling ownership of physical goods i.e. groceries
Usage fees – pay only when you use i.e. postal service
Subscription fee – periodical fee i.e. cable and TV
Leasing – giving exclusive rights for a particular period of time i.e. rental cars
3.2.4.6 Key activities
These activities are the most important ones when executing a firm’s value proposition. Depending on a firm’s value proposition key activities change. For a low-cost competitor, like a low-cost airline, it is necessary to make the organization and its processes as efficient as possible in order to keep costs down. For luxury
24
apparel firms it is more important to be more dedicated to customer relationships by building its brand and marketing.
3.2.4.7 Key resources
A firm should be able to identify its most valuable resources. What resources are assets that support and keep the business going? For some it is their distribution channels, while others are more reliant on their intellectual property, the people working for them, the relationships with their customers etc. Different value propositions require different key resources.
3.2.4.8 Key partners
Partnerships can optimize the operations and reduce the risk for a firm’s business model. Partners can be suppliers but also other firms we acquire key resources from or who performs key activities for us.
3.2.4.9 Cost
To begin with a firm should be aware of its business structures. Is the business main focus on minimizing all costs (cost-driven) or on creating value for their products/services (value-driven)? Regardless the structure of the business, the cost structure in a firm while delivering their value proposition should be known. What resources and activities are the most expensive? What are our fixed costs? What are our variable costs? Can we benefit from economies of scale or/and economies of scope?
25
3.2.5 Marketing mix (4 Ps)
The marketing mix, also known as 4 Ps, is a business tool for marketers. The mix helps marketers to determine a certain brand’s, product’s or service’s offer by analyzing the price, product, promotion and place (distribution). By using the tool, marketers get help putting the right product in the right place, at the right price, at the right time. The tool helps one migrate from mass marketing to niche marketing (Kotler & Keller, 2009)
Figure 6.6 4 Ps (www.learnmarketing.net, n.d.)
3.2.5.1 Product
Product also covers services. This P helps to create a product/service-market fit by asking questions with following characteristics:
What need does it have to satisfy?
What does the customer want from the product/service?
How and where will the customer use it?
26
3.2.5.2 Price
Pricing a product right is an art. There are several ways to go around it. One approach is cost plus, which is basically calculating the price by taking the cost and adding a profit (margin). This might be a good alternative if the company is a cost-leader and want to grab market shares by undercutting competitors while still keeping margins.
Another method is competitive pricing. How are competitors pricing the same or similar offerings? Depending on the industry, this approach is easy or hard to apply. In some industries list prices are available and therefore price benchmarks are easy to perform, while in others quotations determine the price to a customer and benchmarks are hard to do.
In general, the best way to price a product or service is the highest price a customer is prepared to pay for a service/product. This is decided by the perceived value to the customer. “How much is this offering worth to me?” is the question to be asked. Value based pricing requires a lot of knowledge of the product/service, how it is being used, why it is being used, by whom etc. Usually value-based pricing helps commanding the highest margins of the pricing strategies described, but it is the hardest one to master.
3.2.5.3 Promotion
Products/services require different types of promotion for different audiences. Promotion is about how we are communicating, where we are communicating and when we are communicating. Promotion is not just about what channels are being used (TV, radio, internet, mail etc.) but also how the message is being crafted and communicated.
27
3.2.5.4 Place
Place equals distribution in the model. Where is the product/service being sold and where does the potential customer look for our product/service? How can we access the right distribution channels? Are we selling on the internet or in stores? With the increasing popularity of internet, some argue place has become less relevant. They think that today is more about convenience to buy than location. With today’s credit cards and fast deliveries much effort should be put into making the product/service easy to find and purchase.
29
Benchmarking
4 Methodology
This research uses a holistic case-study approach with benchmarking as the main supporting process (see figure 4.1). The 10-step benchmarking process (see figure 2.2) will be the foundation of this research. There are several reasons that approach is chosen. Firstly, for finding best practices within a business unit, company or industry there must be someone else the object can compare its processes with (Camp, 1989). Second, the 10-step benchmarking process adds validity to the study since it describes a structured way of comparing processes within a company or externally. Lastly, the case study company has made a lot of data available for this research. The more data that is available the more relevant it is to perform benchmarking.
Figure 4.1 Research design to find best practices in this study.
4.1 Quantitative study
The huge amount of data provided from the case study company makes it necessary to limit the study to a certain amount objects to benchmark. Depending
Quantitative study
Data collection from ERP Determine metrics
Identifying study objects
Analysis of sales
Analysis of growth
Analysis of assortment
Interview
Pestel - macro economy
5 Forces - industry Business model canvas -
internal processes 4Ps - marketing mix Analysis Strategy Competition Activities
30
on what output is being looked for in the benchmark, it is crucial to choose which metrics to take in consideration during this early stage (Camp, 1989).
The standard component business is a growing business on almost all markets. Therefore net sales growth (%) is the metric that will be analyzed.
In this stage it is also necessary to validate the validity of the data, since the output is dependent on the input – “garbage in, garbage out”. This will be done by triangulation by analyzing data from several sources.
4.2 Identifying objects to study
Most of the markets are experiencing growing spare parts sales. However, they are in different maturity stages. On some markets standard components have been sold for some time, while on others operations have just been intensified. The latter ones tend to show hefty growth (triple digit growth) since the initial sales are very low to begin with. These markets are not appropriate to analyze due to the underlying uncertainties. Steady growth and considerable sales volumes compared to other markets are criteria markets have to show to be good fit for this study. The ambition is to choose 10-12 markets that will be subjects to a qualitative study and analysis.
4.3 Interview – Qualitative study
The approach for qualitative studies will be interviews with objects, previously chosen to benchmark. For the interview, a questionnaire has been prepared. The questionnaire will be identical for all interviewees. The aim of this qualitative study is to gain knowledge of each object’s organizational structure, processes of work (mapping), microeconomic environment (industry), macroeconomic environment etc. To cover all these areas, the questions need to cover different areas but still go into some details. A lot of the questions were inspired by the
31
different frameworks and tools described in chapter 3. This overview shows for what each different framework was used.
PESTEL – This framework was used to give questions a character that will help to understand in what macroeconomic environment each benchmarking objects operate. This is necessary to take into consideration when benchmarking objectives to each other. If the macroeconomic environment is not taken in consideration there is a risk that the result will lose validity. This since performance levels might be affected by the internal organization to various degrees throughout our sample.
Porter’s five forces – The five forces help to formulate questions that
position the case study object in its industry and market. What forces are dominating on different markets? This is crucial to take into consideration when comparing objects to uncover best practices. A non-competitive industry does not require actors to be efficient to stay profitable and command high margins, while a highly competitive does. 5F will help to point out which markets require their companies to find efficiencies and best practices within their organization. This helps mapping the competitive landscape.
Business model canvas – This framework is optimal to quickly gain knowledge about a firm’s business model, in this case an object’s. Questions inspired from this framework will allow looking into an object’s business from their own point-of-view. It will help to understand where they are focusing and why. All the necessary activities and resources will hopefully be uncovered. Information about how and how well they are serving their customers will be uncovered. This is a study of the internal organization and their activities.
32
4Ps – The 4P framework was mainly used to understand how the MCs worked with promotion. Since the product (spare parts), place (distribution) and price is shared by most of the MCs, the promotion is the marketing differentiator between them. The framework would help to understand how the different MCs position themselves on their market.
Mapping and understanding the internal processes are the main priority, therefore a lot of the questions are dedicated to that topic. However, it might be interesting to investigate the correlation between internal activities and the micro- and macroeconomic environment. Unfortunately it is not possible to investigate each market’s landscape, so therefore it has to be based on the market companies’ own perception.
4.4 Analysis
When all the qualitative data was collected from the interviewees it was time to analyze. This was the hardest part for several reasons. Firstly, it is hard to acquire all necessary information needed from people during one 60-minute interview. The people interviewed are extremely busy people so it was hard to get back with follow-up questions. Secondly, their answers are never 100% complete. Some details they don’t think matter might have been left out even though they might have had a huge impact on the study. However, these are all factors all types of studies and research project face. Thirdly, all the answers leave room for interpretation, both for the interviewer and the interviewees.
Unique activities’ performance has to be evaluated somehow. First, we will take a look if there are some overall pattern between activities and external environment. For instance, what activities tend to be common when competing in a very competitive landscape and vice versa. By gathering good practices, the best can be picked and evaluated.
33
5 Empirical study
5.1 Data collection
The first step of the study was to gather data from potential benchmarking and study markets. Sales data from over 170 markets worldwide was gathered. The data was obtained from several enterprise resource planning (ERP) sources including sales, sourcing/procurement, planning etc. The data enabled tracking sales of individual spare parts e.g. where they were sold, where they were sourced, how many were sold etc. This amount of data was overwhelming to deal with and analyze without the proper tools. Therefore a QlikView-application, developed internally, was used. The application allowed to easily structure, filter, sort and search data - quickly with different criteria.
The obtained data was triangulated and validated against another business intelligence tool – SAP NetWeaver Business Warehouse. This tool also allowed tracking sales of parts on different markets. This was mainly performed to ensure the QlikView-application was gathering and structuring valid data.
5.2 Data Analysis
Even though QlikView is a powerful tool, the available data still was overwhelming. Sales data dating back up to 3 years from over 170 markets is too much to proceed with for more qualitative analyses. For every market, markets or clusters that were looked at, their total sales, sales of standard components from certain suppliers and sales of all other standard components (see figure 5.1) were available. The most recent sales data available, when this analysis was initiated, was from September 2013.
34 Market X 2011 2012 2013 Total sales (€) 8 000 000 10 000 000 13 000 000 Supplier A 1 200 000 1 500 000 1 950 000 Supplier B 800 000 1 000 000 1 300 000 Supplier C 640 000 800 000 1 040 000 Supplier D 320 000 400 000 520 000 Supplier E 240 000 300 000 390 000 Other suppliers 4 800 000 6 000 000 7 800 000
Figure 5.1 Fictive sample sales data from Market X.
Clearly, to be able to successfully handle the data, different criteria had to be introduced that markets would have to meet in case to be evaluated with interviews.
Firstly, all markets that didn’t have sales history from 2011 were removed. The glitch of missing sales data is due to the global roll-out of the ERP that was done gradually. Second, the total sales in were analyzed. The ratio between the ten biggest markets and the smaller ones was almost 10,000. The smaller markets showed great inconsistencies with spikes and dips in sales. This made it very hard to make any conclusions what so ever about in what stage the market was. Markets that had a steady and consistent growth without spikes and dips were sought for.
The distribution, like figure 5.2 shows, of the markets’ sales showed there were a small number of markets that make up a huge chunk of the revenue. A closer number analysis showed that 18.4% of the markets contributed with 80.4% of the total sales. In other words, by reducing the scoop of potential objects to just 18.4% of the initial number, 80% of the sales was still available to analyze. Even though this reduced the markets substantially, there were still over 30 markets in these 18.4%. Further narrowing had to be done.
35
Figure 5.2 Distribution of sales on just over 170 markets.
Next step was to calculate an average of how the sales are distributed between major suppliers (see figure 5.3). The average was based on the 18.4% left. These values would serve as a reference later to help spot good performers. By identifying the markets that perform very well with certain suppliers, it was assumed these are doing something different from the others. Percentages in categories that were substantially higher than the average functioned as an indicator. This analysis was conducted on the just over 30 remaining markets. When picking which ones to choose, several factors were considered. It was highly desirable to have a geographical spread among the markets chosen for a qualitative study. The markets should also show consistency in their growth of sales. In other words, markets that showed growth, then reduction, then growth again were not desired. Finally, after weighing all these factors together 11 markets chosen that would be studied through interviews with representatives from respective markets. These 11 markets accounted for 53% of total standard component sales.
36
Figure 5.3 Sample data of distribution of sales between suppliers globally and markets.
5.3 Interviews
The interviews were the main tool for gathering qualitative information about the markets selected for a further analysis. To be able to do conduct an interview that provided good and valid data, it was necessary to craft a questionnaire that would cover everything of interests. The qualitative research was about to understand the macroeconomic environment, microeconomic economic environment (industry) and the internal work and processes (see figure 5.4). Therefore, the qualitative data collection could be divided into two phases; making the questionnaire and the interviews. The interview guide is to be found in the Appendix.
5.3.1 Writing the questionnaire
The time available with each of the interviewees was limited. To ensure good and relevant information and data is collected during the interview, it was absolutely crucial that the questionnaire covered a lot while it picked up details as well. The questionnaire was written with a lot of inspiration and help from three, for the business-minded, well-known theoretical frameworks/models; PESTEL, Porter’s Five Forces and Business Model Canvas.
Average Market 1 Market 2 Market 3
2012 2013 2012 2013 2012 2013 2012 2013 Supplier A 7,4% 7,1% 8,3% 7,8% 5,8% 4,9% 7,5% 8,2% Supplier B 5,1% 4,9% 3,9% 2,9% 7,6% 8,2% 6,9% 5,2% Supplier C 3,4% 3,2% 4,1% 3,9% 3,5% 2,1% 3,3% 3,8% Supplier D 4,3% 4,8% 6,1% 6,6% 5,8% 6,9% 3,1% 4,0% Supplier E 1,8% 1,5% 3,1% 1,9% 0,5% 1,4% 2,7% 2,0% Supplier F 0,1% 0,1% 0,1% 0,1% 0,0% 0,0% 0,1% 0,3% Supplier G 5,2% 5,0% 7,1% 6,8% 2,2% 3,6% 5,1% 2,8% Supplier H 3,2% 4,1% 5,4% 6,0% 2,5% 5,1% 3,9% 4,4% Supplier I 4,6% 4,2% 4,1% 3,9% 4,6% 4,4% 6,0% 4,6% Supplier J 2,6% 3,5% 1,8% 2,8% 1,7% 2,3% 2,6% 4,1% Other suppliers 62,2 % 61,5 % 56,0% 57,4 % 65,7 0% 61,0 % 58,8 % 60,6 %
37
Figure 5.4 Layers of the business environment. (Johnson and Whittington et al., 2012)
5.3.1.1 PESTEL
The PESTEL-framework was used to formulate questions that would help to understand in what type of economic and politic climate each of the study objects operated in. It was also desired to uncover if the case study objects might have an “unfair” advantage or disadvantage due to external factors. Basically the questions that were asked were if there were any regulations that were specific for that market, regulations that might affect sales and competition. In some countries, there are some regulations that complicate import of goods with intense bureaucracy and high tolls. Circumstances like these acts like entry barriers for competitors, especially smaller ones. If tolls are high and bureaucracy intense, it requires, in general, actors to carry huge stocks in order to be able to be responsive to their customers’ needs. Factors like these make markets unattractive for potential entrants. Being one of few established firms in a country due to external reasons results in good sales and profits even though the service or products provided might be sub-standard. Because of this, it was necessary to understand which
38
market companies operated in this specific environment, so their performance could be dedicated to regulations and not internal efficiency.
5.3.1.2 Porter’s Five Forces
With the 5F framework the industry rivalry would be understood. First, how much competition do the market companies face? Second, what type of competition do they face? The competition can be either direct or substitutes. By asking about the competition and then follow up with strengths and weaknesses it is possible to see how much the market companies know about their industry and competition.
5.3.1.3 Business Model Canvas
Mapping a company’s processes and understanding its way of doing business is relatively hard to do – especially if time is limited to one hour. The business model canvas, which is relatively new, is generally used to visualize a company’s complex business model but also to map competitors. It is a very powerful tool because it quickly lets one identify the essence and the core of a business. The model slices the business into nine modules. For this study the main interests were everything except the revenue streams and cost structure. These are of course vital elements of a successful business, but don’t really fit the current scope. The interviewees’ perceptions on their organization and its value proposition towards its customers wanted to be understood. If they weren’t able to communicate it during the interview, there is a risk that they cannot communicate these values to their customers. Communicating the value propositions clearly is not the only thing they can do to make them more attractive for buyers. The relationship with a customer is just as important. Therefore relationships management would be brought up as well.
5.3.1.4 4Ps
The 4P framework was used mainly to understand how the objects were working with awareness and promotion of products.
39
5.3.2 Interviews
To get a general opinion about how organizations and work processes should be designed and structured, an interview has been conducted with a representative from the central organization (after sales division) whose task is to coordinate all our case study objects. The knowledge acquired during this interview will serve as a reference during the others. It will help to detect major differences during our time-limited interviews and ask follow-up questions.
In a big organization like the case company’s, finding the right people is a challenge. Not to mention pin-pointing the right people to interview globally. To find relevant people to talk to, assistance from this study’s supervisor, who has been with the company for some time, was needed. Even for a person like him, it was a challenge to know exactly who would be the best fit for the interview.
Together with the supervisor a strategy for the interviews was set up. First, spare parts coordinators in different clusters would be interviewed. If the information on some topics was perceived as “thin”, other individuals would be interviewed regarding these topics. These individuals could be people working closer with customers, e.g. technical key account managers.
Before each interview, information about the study was sent to targeted people at chosen market companies. The information comprised a short project background, purpose and five topics that would be covered in the interview. The idea was to prepare people, but also make them feel as a part of the project. The intention was to raise their cooperation and set them in a more open mindset instead of “defending” their organizations and their current way of working.
The questions were never sent in advance to the interviewees. A couple of requests for the questions were made, for preparation, but were rejected. The risk of sending questions ahead of the interview is that answers can be fabricated to sound better
40
than they actually are. This will not only undermine the study, but will hurt the organizations.
Each interview was done as a conference call with one or more representatives. The person contacted could choose if they wanted to have someone else present during the call. Usually this other person was someone with more operational detail knowledge. This was just positive and added value to the interview.
The interviews always started with a short description of the project’s background and purpose, to refresh the interviewees’ memory. After the short intro, the interviewees talked about their work and responsibilities within the organization. After the introduction, it was time for the questions.
The idea was always to structure the interview by starting with something more general, like KPIs and strategy. Usually the interviewee connects this to the organization and their work, so the transisiton to organizational questions was natural. It is important to have keep the interview coherent by not changing topics too often. This lets the interviewee talk freely and share important ifromation. If the topics are changed frequently, there is a risk that the interviewee will answer shorter and leave out crucial information since their perception will be that kind of answers and behaviour is sought for. Instead, focus was on having a dialouge. However, it is important not to let them talk too much about something irrelevant or too long. This consumes valuable time while it puts the whole interview at risk of not getting any valuable information.
Once they have shared information about their organizations, they were asked more specifically about the activities taking place in their respective organization. How are the processes designed and who owns various tasks? Besides the activities, questions about how relationships are being managed and by whom were asked. The whole process of approaching a customer to raise awareness and to grow the accounts bigger was investigated.
41
Finally, when there was enough information about the organization, their work and relationships with various customers available, the scope of the questions focused on the country and industry they operate in. First, are there any specific regulations that apply to the representative’s market company? These regulations can be special customs regulations and processes or anti-trust regulations if the market company is a dominant player on their market. Regulations can be a major explanation to someone’s success or lack of success. Questions regarding the competition on their market were asked. First, about what kind of competition they faced. Are competitors small local agents, major distributors or branch offices? Different types of competition may require different action. After the competition has been defined, the interviewees were asked to list their unique value propositions, strengths and weaknesses compared to the competition. This helps to understand what they see as their biggest threat, but also what their core competence is and how they are taking on their competitors. Direct competition is not the only option, sometimes competition can become co-opetition through partnerships for instance. For those reasons they were asked how they view and work with local partnerships.
To summarize the interview it collects information but also checks validity. Some questions are not really a perfect fit for the study, but serve as an indicator how much knowledge about their business the interviewees have. It is always hard to take someone’s word for granted and assume everything is more or less the way they’ve told it. Therefore these checks can help to determine the validity of the topics covered, but also the interview in general. Occasionally some interviewees started to talk freely and drifted away from the question. This was a clear indication that the person lacked proper information to answer the question accurately.
42
When the first round of interviews was done, a decision had to be made whether there was enough qualitative data available to proceed with for analysis.
5.4 Analysis
The questionnaire for the interview consisted of 28 questions covering different topics. The purpose of this has been stated and can be read in section 5.3. When trying to study several different topics and areas, one will get a lot of data and information. Unfortunately, not all the data collected is completely relevant for the purpose. This is not strange, since some questions were deliberately written to “fish” for information and uncover underlying answers and reasons to a certain output. Therefore, in this section, data that was believed not to be relevant for the study was left out from the analysis. Left out doesn’t mean the data has not be considered or looked at; it will just not be an object to study further in this report. Typical examples of what has been left out are; number of people in different teams, minor differences in responsibilities etc.
5.4.1 Distribution of sales between suppliers
Before the interviews were conducted, the hope was to be able to understand the variances in distribution between suppliers. This data was the main approach to find best practices, but it didn’t turn out as well as imagined - the main reason for that being the installed machine base.
The case company has sold filling and packaging machines for over 4 decades. While the average economic life time of a machine is 15 years, there are machines on certain markets that have been around for over 30 years. These machines require different spare parts than modern machines. For instance, older machines may be built with a lot of components from supplier A, while modern machines are more
43
dependent on supplier C. This creates discrepancies in distribution of supplier sales between markets.
Another fact that heavily impacts the sales and distribution is the type of machines being sold. Different types of packages require different machines. Depending on the package, the configurations of the machines, and thereby components, vary very much.
Since the defined best-practices should be relatively general and easy to implement, best practices that are independent of a specific installed base are only of interest. So, in the pursuit for best practices, the ambition of analyzing sales distribution between suppliers has been left behind. This is a set-back, since much of the picking process was based on this data. However, the markets are still the best performing ones and the confidence that best practices will be applicable more widely and not just on certain assortments, is high.
5.4.2 Strategy
Strategy is fundamental in a business. It is a plan to achieve set goals in conditions of uncertainty. The strategy should be reflected in all decisions that are being made.
Interviewees were asked what the strategy for growing spare part sales was. The data shows that strategies between market companies vary a lot. In some cases there was no strategy in place at all, which should be worrying. In general, the 5 following growth strategies were the most common ones:
Competitive pricing
One-stop-shop
Service contracts
Products and promotion
44
The strategy formulated centrally said growth was going to be achieved with competitive pricing and a big product assortment. This is the general idea, but for some markets this might not be the right fit due to market conditions. An example of a market where market prices are not the necessary would be a market with few players due to e.g. regulations. Therefore variations should be expected and not considered strange.
Usually, there was an idea of a strategy but an executive plan was missing. For instance, some stated competitive pricing was the strategy but the lacked a process, knowledge and resources to collect market prices. This creates a strategy misalignment since the organization cannot execute its strategy and competitive edge.
However, there were two strategies that were well thought out and had an executive plan supporting them. The two are the “Products and promotion” and “Market and opportunity analysis” strategies.
5.4.2.1 Products and promotion
This strategy is all about making the assortment more attractive and accessible for customers. Product and Promotion are taken from the 4P’s framework. Product has the product the company is selling in focus. By constantly working to increase performance and safety, to reduce downtime during maintenance, the products become more desirable to customers. Combining these value-adding features with the one-stop-shop offering, which means customers can buy all the maintenance and parts they need in one place, the after sales offering becomes much more attractive to customers. An example is to bundle parts that usually are sold together into kits. By doing so, it will become easier for customers to buy what they need. The customers can focus more on their core business rather than administration.
The other P, promotion, takes the marketing in consideration. If you have the best product but no one knows it, how can they buy it? Customers must be aware how