Kalmar ECO-TECH '07 KALMAR, SWEDEN, November 26-28, 2007
COMMUNITY ONSITE ANAEROBIC SEW AGE
TREATMENT IN A UASB-SEPTIC TANK
SYSTEM: SYSTEM BEHAVIOUR DURING
WINTER PERIOD IN PALESTINE
Wafa Al-Jamal
Nida/ Mahmoud
Birzeit University, Palestine
ABSTRACTThe effect of the Mediterranean climate low temperature period on the performance UASB septic tank treating concentrated domestic sewage (COD ~ I 00mg/L) in Palestine was
3
studied. Two community onsite UASB-Septic tank reactors (capacity: 0.8 111 , height: 2.5 m) were operated in parallel over a year and monitored over the colder half of the year. The reactors were operated under two different HRT (2 days for RI and 4 days for R2) at average sewage temperature of 17 .3 °C with 12 and 25 °C extreme values. The COD,, in the raw sewage represented a high fraction of the total COD, viz. about 43.7% from the COD,01. RI achieved mean removal efficiencies for COD,m, CODsus, CODcol, CODdis, of 51 %, 83%, 20% and 24% respectively and BOD5 and TSS average removal efficiencies of 45% and 74% respectively. R2 achieved mean removal efficiencies for COD,0., COD,u,, CODcol, CODdis, of 54%, 87 %, I 0% and 28%, respectively with BOD5 and TSS average removal efficiency of 49% and 78% respectively. The sludge production from both reactors was very low with VS/TS ratios of 67.9 and 67.02 of the sludges in RI and R2, respectively. Based on the removal efficiencies and sludge production it can be concluded that the here researched UASB-Septic tank system is a potential compact and effective community onsite pre treatment unit for domestic wastewater in Palestine. The reactor can be designed at either 2 or 4 days HRT, but slight preference might be given to 4 days HRT when sludge production is of concern.
KEYWORDS
Anaerobic wastewater treatment; on-site; domestic sewage; UASB-Septic tank
I INTRODUCTION
Wastewater management is a sector, which globally requires more attention. Today sewage is the largest pollutant on a global scale, as particularly in developing countries, only a small fraction of the sewage produced is treated. For example, In Palestine about 73% of the West Bank households have cesspit sanitation and almost 3% are left without any sanitation system. The cesspits are left without lining, so sewage infiltrates into the earth layers and eventually to groundwater. Consequently, cesspits themselves pose increasing environmental pollution problems. The local Palestinian experience with constructing centralized aerobic activated sludge plants is not encouraging due to the incapability of people to afford the operational and capital costs. Even for wealthy countries, the connection of dispersed human settlements like remote houses, summer houses, farms and recreation facilities to sewerage system is too 403 https://doi.org/10.15626/Eco-Tech.2007.041
costly. For instance, in Finland wastewater from rural areas (20% of the population) 1s a concern due to water sources pollution, and in the United States more than 20 million homes (20% of the population), are served with onsite wastewater treatment facilities of mainly septic tanks. Accordingly, decentralised wastewater management is inevitable for comprehensive wastewater treatment and environmental protection world wide.
The septic tank is the most known and commonly applied system for on-site anaerobic pre treatment of sewage. However, the perfonnance of the septic tanks is rather poor despite the long operated hydraulic retention time (HRT) due to their inherent design feature, viz. the horizontal flow mode of the influent sewage. A significant improvement of the septic tank was achieved by applying upward flow and gas/solids/liquid separation device at the top, which resulted in the so called UASB-septic tank system [ 1 ]. The reactor is operated in an upflow mode as a UASB reactor resulting in both improved physical removal of suspended solids and improved biological conversion of dissolved components, and sludge gradually accumulates and stabilises in the reactor, as in a septic tank (Zeeman el al., 2000).
Studies with UASB-Septic tanks treating domestic sewage are scarce, and to our knowledge so far only a one research project had been conducted on the use of a UASB-septic tank system for the onsite sewage treatment at Dutch and Indonesian ambient conditions by Lettinga and his co-workers [I,2](Bogte et al., 1993; Lettinga et al., 1993). Nonetheless, the system has not been applied in other countries of different environments and sewage characteristics nor it has been optimised. For instance, in Palestine and Jordan in the Middle East, sewage is characterised with high COD concentrations exceeding sometimes 1500 mg/L with high fraction of CODss (up to 70-80%) [3, 4] .. In addition, in the Middle East region, the ambient temperature fluctuates over the year coupled with sewage temperature fluctuation in the range 15 and 25 °C, during winter and summer times respectively. Previous research has demonstrated that the performance of single stage UASB systems at low temperatures (5-200C) is severely limited by the slow hydrolysis of entrapped solids that accumulate in the sludge bed [5]. This phenomenon is of particular concern when the reactor is fed with highly concentrated raw sewage at low temperatures. The use of the UASB system for the treatment of sewage with relatively high COD concentration is still undergoing trials and argued that such knowledge is important to improve the reliability of anaerobic processes. This is because knowledge of the perfonnance of anaerobic reactors treating municipal wastewater in extreme situation is limited.
The main objectives of this research were to asses the process performance of the community onsite UASB-septic tank for the treatment of concentrated domestic sewage under rather low temperature conditions and also to increase the knowledge on the system design. In view of that, two UASB-septic tank reactors treating domestic sewage in Palestine had been operated under ambient conditions at HR Ts of two and four days. The reactors were operated for a year and monitored for the last six months which are the cold period of the year.
2 MATERIALS AND METHODS
2.1 Experimental set-up.
Two UASB-septic tank reactors, namely RI and R2, were installed in parallel at the centralised sewage treatment plant of Al-Bireh City/ Palestine. The reactors were made of galvanized steel with working volumes of 0.8 m3 (height 2.50 m; diameter 0.638 m). Nine
Kalmar ECO-TECH '07 KALMAR, SWEDEN, November 26-28, 2007
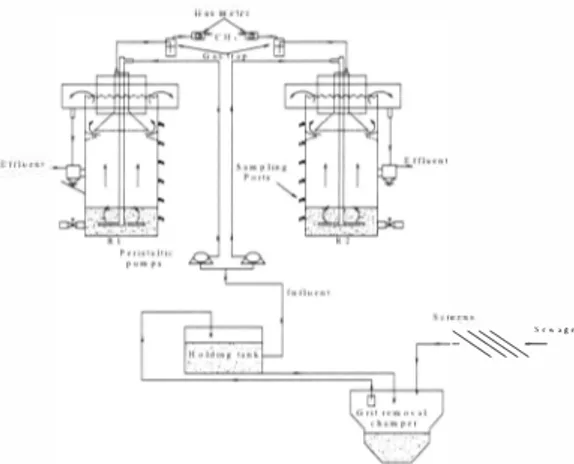
through Polyvinyl Chloride (PVC) tube with 4 outlets located 5 cm from the bottom, Biagas was passed through a 16% NaOH solution for CO2 scrubbing, and then methane quantity was continuously measured by wet gas meters. Schematic diagram of the experimental set-up is presented in Figure J,
�__'._'.····
Figure 1. Schematic diagram of the experimental set-up (not lo scale) 2.2 Pilot plants start-up, operation and monitoring.
The UASB-septic tank reactors were started up during spring, ca. April, The reactors were operated in parallel and continuously at ambient environmental conditions for a whole year. The reactors were fed with domestic sewage pre-treated with screens and grit removal chamber. The sewage was pumped every five minutes to a holding tank (200 L plastic container), with a resident time of about 5 minutes, where the reactors were fed and the influent was sampled. The reactors were inoculated with anaerobic sludge obtained from a household cesspit (RI and R2 respectively with IO and 20% of the reactors volume), and operated in parallel at ambient temperature. Grab samples of raw sewage and reactors effluents were collected and analysed two to three times a week after six moths of staring up the reactors, viz, starting in October. Samples were stored at 4 °C till being analysed. Daily monitoring included wastewater and ambient temperature and biogas production measurements, The atmospheric pressure was measured in situ.
2.3 Analytical Methods
Total suspended solids (TSS), volatile suspended solids (VSS), total solids (TS), volatile solids (VS), ammonium (NH/), kjeldahl-nitrogen (Kj-N), Chemical Oxygen Demand (COD), Biological Oxygen Demand (BOD), total PO4-P, dissolved PO/-P, and
so/·
were measured according to standard methods [6], Raw samples were used for measuring total COD (CODt), 4.4 µm folded paper-filtered (Schleicher and Schuell 5951/2, Gennany) samples for paper filtered COD (CODp) and 0.45 µm membrane - filtered (Schleicher and Schuell ME 25, Gennany) samples for dissolved COD (CODdis). The suspended COD (CODss) and colloidal COD (CODcol) were calculated as the difference between CODt and CODp and the difference between CODp and CODdis, respectively.The volatile fatty acids (VFA) analysiswas carried out as described by (Buchauer, 1998). pH was measured using EC pH meter (HACH). All samples were analysed in duplicate except, VFA and SY! in single.
Biodegradability of the effluent COD and sludge stability of both reactors were measured twice in duplicate using 500 mL working volume batch reactors incubated at 30 °C for a period of 120 days as described by [3).
2.4 Calculations Nomenclature
COO,0,: amount of total COD in the tested sample (mg COD/I)
COD101. inf and COD,01. cfC: amount of total COD in influent and effluent (mg COD/I) CO Odis. inr and CO Odis.err: amount of dissolved COD in influent and effluent (mg COD/I)
CODvFA.inf and CODvFA. err: amount of VFA in influent and effluent (mg VFA as COD/I)
CODrn,: amount of produced CH4 (liquid fom, + gas fom,) (mg CH4 as COD/I); CH4 (liquid rom,) was
calculated according to Henry's law assuming 70% of the biogas is CH4
CODaccumulated: amount of accumulated COD in the reactor (mg/I) Biodegradability and Stability
=
Biodegradability (%)a I 00 (CO Orn.I COD,01.1= o days)
(I)
Hvdrolysis, Acidification and Methanogenesis
Percentage of hydrolysis (H), acidification (A) and methanogenesis (M) were calculated according to equations 2, 3 and 4, respectively.
H (%)=JOO (COOCH,+ COOdis.cff-COOdis.inf )
CODtot. inf -COOdis.inf (2)
A (%)= I00 (CODrn,+ CODvFA.cff-CODvFA.C0O101. i inf \ (3)
nf - COOvFA.inf )
, \
M (%) = 100 ( CODarn
COO101. inf) (4)
COD - mass balance
nf =
COD101.i CODaccumulatcd + CO De 11, + COD101. cff (5)
2.5 Statistical data analysis
Statistical comparisons of means was followed by "Paired samples t-test" for the measured parameters of the two reactors using the SPSS program for windows- Release 11.0.0, SPSS®
3.1 Influent specifications
Kalmar ECO-TECH '07 KALMAR, SWEDEN, November 26-28, 2007 3 RES UL TS AND DISCUSSION
The influent average COD,0,, CODss, CODdis and the CODco1 were 905(253.5) mg/I,
396(163.8) mg/1 and 350(124.2) mg/1 and 135(42.2) mg/1, respectively. The CODss
represented a high fraction of the COD,0, of 43.7% which is less than the value reported by
[9]Mahmoud et al. (2003) of 58%. The percentages of the other fraction of the COD,o, were
14.9% and 38.6% for CODcol and CODdis, respectively. The average VFA of wastewater
entered to the treatment plant was about 99(55.8) mg COD/1 as an average value, which is less
that the value reported by (9]Mahmoud et al. (2003) of 150 mg COD/1. The ratios between the
acidified (VFA/COD ,m), the hydrolysed percentage (CODdi,/COD,0,), the YFA part of the
dissolved COD (VFA/CODdis) and the (VSS/TSS) and (COD55/VSS) are presented in Table 2
and compared with other studies in Jordan and Palestine.
Table 2. Percentage of hydrolysis and acidification of total COD and acidification of dissolved COD and VSSITSS and CODs11/VSS ratios for the influent of Al-Bireh WWTP/Palestine and Abu-Nusier WWTP/Jordan
(VFA/COD,0,) (VF A/CODdis) (CODdis/COD,o,) (VSS/TSS) (COD,u,IYSS)
Palestine(! l 10 36 28 84 1.49
Palestine(Zl 10.9 28.28 38.7 84.4 1.27
3
Jordan < l 9.4 40 23.5 72 3.21
Palestine studies of Al Bireh City sewage/Palestine:( I) Mahmoud et al. (2003); (2) this research);
Abu-Nuseir sewage/ Jordan: (3) Halalsheh (2002)
The average TSS and YSS concentrations of the influent were 3 71 ( 141) mg/I and 3 I 3( 128) mg/I, respectively. The (VSS/TSS) ratio was 84.4%. During the period of the study, the sewage temperature fluctuated between 12 and 25 °C with average value of 17.34 °C.
3.2 Performance of the two UASB-septic tank reactors
The UASB-septic tank reactor that was operated at 2 days HRT achieved average removal
efficiencies of COD,01, COD,.,,, CODcol and CODdis of respectively 51 %(9), 83%(10),
20%(32), 24%(15), and the other reactor with 4 days HRT achieved values of respectively 54% (11), 87 % (8), 10% (37), 28% (18). Apparently R2 was more efficient in removing all COD fractions except the colloidal part. However, the statistical analysis revealed that the
difference in the removal efficiencies was only significant for COD,.,, (p<0.05) (Table 3). The
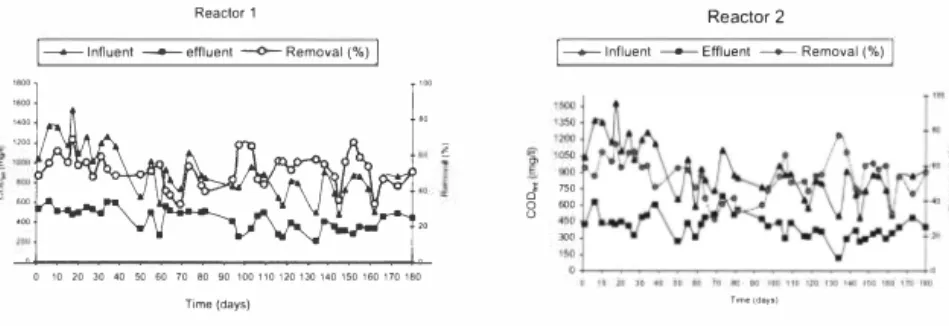
influent and effluent COD,m concentration of Rl and R2 and the achieved removal efficiencies are presented in Figure 2.
-
-Reactor 1 Reactor 2
l---1nfluenl --effluent --<>-Removal(%) j 1--+-lnfluent -Effluent -Removal(%) I
-J 750
..
l::
.
.
u .,.-·
�
··1---���---,---j"
0 10 20 30 ,o SO 60 70 80 90 100110120130\401$0160170 180 0 lm•lday•) Time(days)Figure 2. COD,01 influent and e.!Jluent concentrations and removal efficiencies/or RI (left) and R2 (right),
13
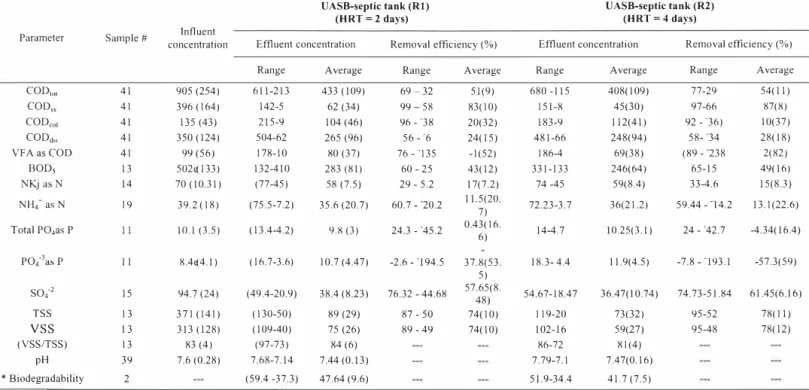
Table 3. Research results for the efjluent concentration and removal efficiency(%) during the whole period of experiment in the two
UASB-septic tank reactors under the imposed operational conditions. Standard deviations are presented between brackets.
UASB-seplic lank (RI) UASB-seplic lank (R2)
(HRT = 2 days) (HRT = 4 days)
Parameter Sample# concentration Influent Effluent concentration Removal efficiency(%) Effluent concentration Removal efficiency(%)
Range Average Range Average Range Average Range Average
COD,"' 41 905 (254) 611-213 433 (109) 69-32 51(9) 680 -115 408(109) 77-29 54(11) COD,, 41 396 (164) 142-5 62 (34) 99-58 83(10) 151-8 45(30) 97-66 87(8) CODco, 41 135 (43) 215-9 104 (46) 96 - ·38 20(32) 183-9 112(41) 92 - '36) 10(37) COD"" 41 350 (124) 504-62 265 (96) 56 - '6 24(15) 481-66 248(94) 58- ·34 28(18) VFA as COD 41 99 (56) 178-10 80 (37) 76 - ·135 -1(52) 186-4 69(38) (89 - '238 2(82) BOD, 13 502e(133) 132-410 283 (81) 60 - 25 43(12) 331-133 246(64) 65-15 49(16) NKj as N 14 70 (10.31) (77-45) 58 (7.5) 29 - 5.2 17(7.2) 74 -45 59(8.4) 33-4.6 15(8.3) NH,-asN 19 39.2 (18) (75.5-7.2) 35.6 (20.7) 60.7 - ·20.2 11.5(20. 7) 72.23-3.7 36(21.2) 59.44 - - I 4.2 13.1(22.6) 0.43(16. Total PO4as P II IO.I (3.5) (13.4-4.2) 9.8 (3) 24.3 - '45.2 6) 14-4.7 10.25(3.1) 24 - '42.7 -4.34(16.4) PO43as P II 8.4e(4.1) (16.7-3.6) 10.7 (4.47) -2.6 - -194.5 37.8(53. 18.3- 4.4 11.9(4.5) -7.8 - '193.1 -57.3(59) 5)
so;'
15 94.7 (24) (49.4-20.9) 38.4 (8.23) 76.32 - 44.68 57.65(8. 48) 54.67-18.47 36.4 7( I 0. 74) 74.73-51.84 61.45(6. I 6) TSS 13 371 (141) (130-50) 89 (29) 87 - 50 74(10) 119-20 73(32) 95-52 78(11)vss
13 313 (128) (109-40) 75 (26) 89 - 49 74(10) 102-16 59(27) 95-48 78(12) (VSS/TSS) 83 (4) (97-73) 84 (6) 86-72 81(4) pH 39 7.6 (0.28) 7.68-7.14 7.44 (0. 13) 7.79-7.1 7.47(0.16) • Biodegradability 2 (59.4 -37.3) 47.64 (9.6) 51.9-34.4 41.7 (7.5)All parameters are in mg/I except: pH no units; VSS/TSS (%) ; Biodegradability(%).* Biodegradability was examined twice at day 204 and day
�
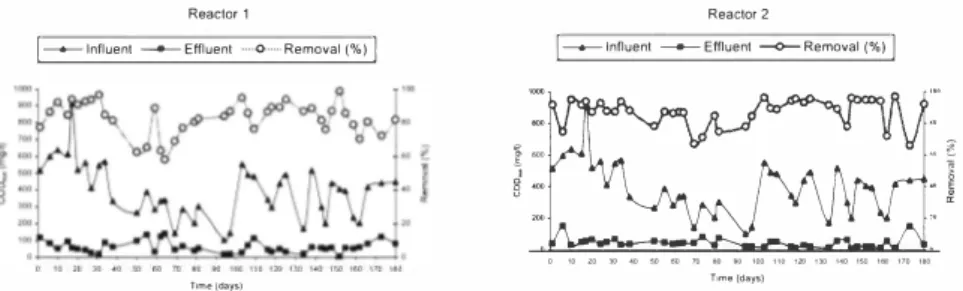
Both reactors achieved high average removal efficiencies of COD,u, of 83 % ( I 0) and 87 % (8) in RI and R2, respectively with average effluent concentration of COD,u, 62 (34) mg/I and 45 (30) mg/I for RI and R2, respectively during the cold period of the year. The results presented in Figure 3 clearly show that the effluent concentrations of CODss of both reactors were very stable, R2 achieved significantly (p< 0,05) better COD,u, removal efficiency than RI,
Reaclor 1 Reactor 2
I----
Influent ---Effluent ···O··-· Removal (%)I
I----
Influent --- Effluent --<)-Removal (%)I
,-·:�:�
�i
§�����=��-�-�-���·
0 10 .-0 lO 40 :IC 11C i'V 11C to 100 HO !21) 1:,C "0 1:IC 1(10 110 \Ill Ttm11ldays)Figure 3, COD,,,, influent and efjluent concentrations and removal efficiencies for Rf (left) and R2 (right)
During the cold period of the year both reactors RI and R2 were not sufficient for removing CODcol from the influent. The average removal efficiencies were 20% (32) and 10% (37) for RI and R2, respectively with insignificant (p>0.05) difference between both reactors, In addition to the low removal rate of CODcol, even negative removal efficiency had been observed, where this means that the effluent concentration of CODcol some times exceeds the influent concentration. The same results had also been observed by [7], in which is justified as the increase in the COD,01 was generated from the COD"" that had been digested. The average CODdis removal rates were 24% (15) and 28% (18) for RI and R2, respectively (see "Table 3" and "Figure 4") with no significant difference between the two reactors (p>0.05).
ReactOf 2
j--1nfluen1 - Effluent I l--1nfluen1 ---Effluent!
Timelday&)
\J
0 10 20 30 40 50 60 70 IIO 90 100 110 120 1'.lO UO l&O 160 170 1110
T,me(dars)
Time (days)
H¾ Kalmar ECO-TECH '07 KALMAR, SWEDEN, November 26-28, 2007
In this research CODdis in the effluent represents about 75.7% and 70.8% from COD ,0, for RI
and R2, respectively. Those results are in agreement with those reported by (4] of 50% CODdis out of the final effluent COD ,01 ofaa UASB reactor. [8] also reported about 50% of the
COD,01 effluent from UASB reactor was as CODdis- The average VFA concentrations in the
effluent of both reactors were 80 (37) mg/I and 69 (38) mg/1 with average removal efficiency of negative removal and 2 % (82) for RI and R2, respectively. The concentrations of the VFA represent about 30% and 27.8% from the CODdis so most of the CODdis was in a non-acidified
form in both reactors. Wang (1994) found about 46% of the effluent COD,01 after anaerobic
sewage treatment could be attributing to non-acidified CODdis as proposed by Van der last
and Lettinga ( 1992). This COD part is apparently anaerobically non biodegradable. The VFA concentration in the effluent was affected by temperature and the methanogenic conditions where the production of the VF A decreased during the winter period comparing to the results obtained during the hot period. The negative and low removal efficiency represents an increase in the VFA concentration which is mainly as a result of the predominant acidification process and apparently low methanogenic activities in the two reactors. [I] reported that declining temperature resulted in reduced production of VF A accumulate at the reactors and a complete conversion of VFA in to CH4 was achieved during 3 to 4 month of second year of the UASB-septic tank operation, when the temperature increased to more than 15 °C.
3.3 Biodegradability of effluent
The anaerobic biodegradability of the COD in the reactors effluents were 47.64% and 41.7% of RI and R2 respectively after incubation period of 120 days at 30 °C for the two tests conducted at day 204 and 250 from the start up of the UASB septic tank reactors.
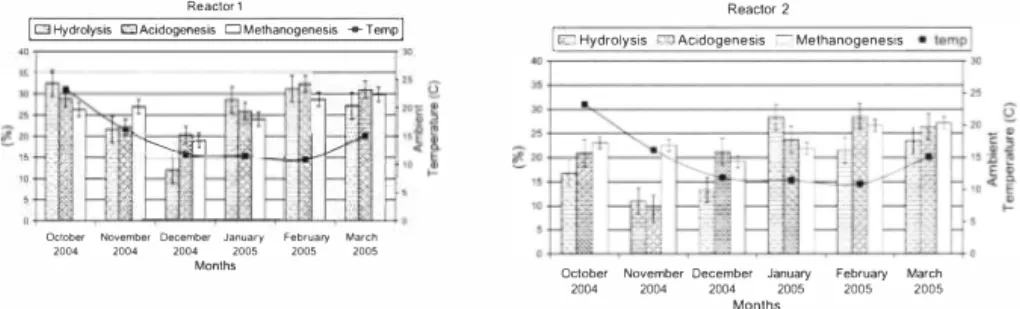
3.4 Hydrolysis, Acidification and Methanogensis
The average values of the hydrolysis, acidification and Methanogenesis over the whole research period are summarized in Table 4.
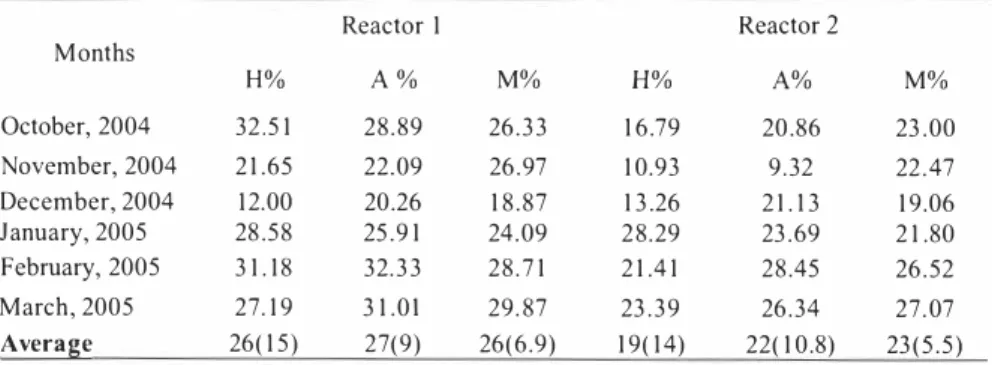
Table 4. The calculated average values for Hydrolysis (HJ, Acidification (A) and Merhanogenesis (M) in both reactors (RI and R2) for each month and over all average during total research period of six months. Standard deviations are presented in brackets
Reactor 1 Reactor 2 Months H¾ A ¾ M¾ October, 2004 32.51 28.89 26.33 16.79 A% M¾ 20.86 23.00 November, 2004 December, 2004 January, 2005 February, 2005 March, 2005 Average 21.65 12.00 28.58 31.18 27, 19 26( 15) 22.09 20.26 25.91 32.33 31.0I 27(9) 26.97 18.87 24.09 28.71 29.87 26(6.9) 10.93 13.26 28.29 21.41 23.39 19(14) 9.32 21.13 23.69 28.45 26.34 22(10.8) 22.47 19.06 21.80 26,52 27.07 23(5.5) 411
Methanogenesis was apparently the rate limiting step for the overall conversion of organic matter to methane in both reactors as the effluent soluble and VFA COD remained relatively high. On the other hand, unexpectedly all of the anaerobic process rates (Hydrolysis, Acidogenesis and Methanogensis) in RI were significantly (p<0.05) higher than those in R2 with longer HRT (see "Figure 5"). This is probably due to extra biogas production as a result of conversion of the accumulated biodegradable solids in the sludge bed of RI during the first half year of operation. Methanogensis might have increased because the amount of sludge in RI was larger than R2 as will be shown later, thus more methane gas was evolved
Reactor 1 Reactor 2
!
□ Hydrolysis □Acidogenesis D Melhanogenesis ._ Temp iI
r:l Hydrolysis m Acidogenesis .--MethanogenesisI'---.. ''I V
-October Novembe, December January February March
200,t 2004 2004 2005 2005 2005
Months October
2004 November December 2004 2004 January2005 February2005 March 2005
Months
Figure 5. Percentage of hydrolysis, acidification and methanogenesis of domestic sewage treatment in UASB-Septic tanks Rf (left) and R2 (right).
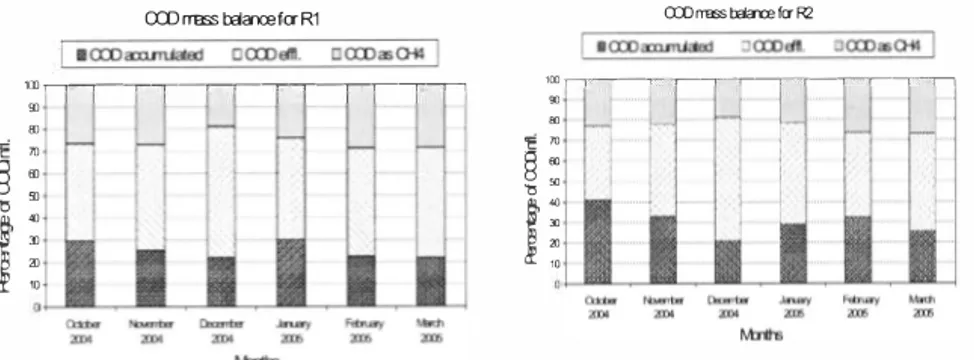
3.5 COD mass balance
Some researchers have provided information about their systems that could lead to formulation of COD balance [I, 8-9]. The monthly COD mass balances over the two UASB septic tank reactors during the period of the research are presented in Figure 6.
Kalmar ECO-TECH '07 KALMAR, SWEDEN, November 26-28, 2007
CXDnass t:aa-oa fer R2
a:o mass taa-ce fer R1
11D ,----,--,----,---,---,--,---,----,--,-,--,---r7 ,oo ,---,---.-,--,---.---,�r-,----,---,---r-, 00
.,
'!, )!)§ :
I;
.,.,
'E 70§
00Ji
Figure 6. Monthly COD mass balance of R 1 (left) and R2 (Right) over the total test period as a perceentage of aveerage influeent COD,0, and divided ove r COD accumulated, COD ejj1uent and CH4 as COD
Through analyzing Figure 6 for both RI and R2 one can see that in the second month of monitoring and analysis (November), which took place when winter started, the accumulated COD started to decrease and washed out with the effluent COD without any change in the amount of methane production, In December when temperature started to decrease gradually, a reduction in the amount of COD accumulated and methane production was observed and so an increase in the amount of the effluent COD was observed, This observation during that month could be also proved by the lowest monthly COD removal efficiency during the period of the experiment about 41% and 40% for RI and R2 respectively. Later on in January the removal efficiency of COD increased accompanied with an increase in the methane production and the amount of COD accumulated. Moreover, later in February and March (the fifth and the sixth month of the analysis period) the amount of methane production stayed approximately constant while the accumulated COD started to decrease with an increase again in the COD washed out with the effluent. During the six month of the research the COD mass balance could be represented about 25.25% and 30% of the COD accumulated in the reactor R l and R2 respectively, and about 25.6% and 23.32% from the total COD entered the reactors R l and R2 respectively converted to methane. The proportion of COD accumulated and found in R2 which is relatively higher than R l justified the slightly better removal efficiency achieved in R2.
3.6 TSS and VSS removal efficiency
Both reactors performed equally good as the achieved TSS removal efficiencies were 74 % (10) and 78% (11) by RI and R2 respectively but with no statistical significant differences (p>0.05) between the two reactors. The results reported for TSS in this research are better than the results reported in literature review for conventional UASB reactors that have treated domestic wastewater. The removal efficiencies averages for VSS for this research were 74% (I 0) and 78% (12) for RI and R2, respectively. However, R2 is significantly better than RI with respect to YSS removal efficiency (p<0.05). The YSS and TSS concentrations and removal efficiencies for RI and R2 were stable regarding to the TSS concentrations measured at the effluent throughout the period of the research. The achieved TSS and YSS removal
efficiencies are rather good because the reactors were operated during the cold period of the year, [9] pointed out that the decrease in temperature would be accompanied with direct increase of the wastewater viscosity and so increase the hydraulic shearing force on solid particles, Accordingly the solids particles will move out the reactor which directly reduces the removal efficiency of both reactors, The average VSS/TSS ratio for both of the reactor R I and R2 were 0,84 (0,06) and 0,81 (0.04) respectively, which is closed to the results reported by (AI-Shayah, 2005),
3.7 (NH/) and (Nkj-N) removal
The removal of the NH/ was very low for both of the reactors where the average (NH/-N) concentration for the UASB reactors R I was 35,61 (20.71) mg/I with average removal efficiency 11.47% (20,66) and so for R2 35,99 (2 L21) mg/I with average removal efficiency of 13.06 % (22.6). However, the difference in removal efficiency of (NH/-N) were not statistically significant (p>0,05), That also holds true for the Nkj-N as Nkj-N was partially removed in the USAB reactors due to particulate N removal (Table 3). The average removal efficiencies of Nkj-N were 17 % (7) and 15 % (8,3) for R I and R2, respectively, Moreover, the difference in removal efficiency of (Nkj-N) were not statistically significant (p>0.05).
3.8 Tota\ - P and Ortho phosphorous removal
The results presented in Table 3 show that the difference in Total - P concentration between influent and effluent in the two reactors was negligible, The results show that the Ortho phosphate concentration had apparently increased in both reactors effluents due to mineralisation of organically bound P, This observation also was pointed out by [1 OJ, As a conclusion of the results that obtained through nutrient removal, one can say that the
UASB- septic tank reactors are not efficient for removing nutrient from wastewater and only a change in the chemical forms of nitrogen and phosphorus take place as reported by [ I ]. Therefore, a nutrient removal can only be achieved in separate post-treatment step after the UASB septic tank [ I O],
3.10 Sulfate removal efficiency
In this research the average concentration for sulfate
so
4·2 in the effluent of RI and R2 was38,37 (8.23) mg/1 and 36.47 (10.74) mg/I, respectively. No significant difference were found of
so
4•2 removal efficiency between both reactors (p>0.05), The influent concentration asshown at Table 3 was about 94.67 (23.76) mg/1 and so the removal efficiency for removing
so
4•2 for reactors R I and R2 are 57.65% (8,48) and 61 .45 % (6, 16), respectively. The effluentqualities for R I and R2 for
so
4·2 were stable throughout the research period and it seemed tobe not affected by the fluctuation in influent concentration.
3.1 1 pH in the UASB- septic tank reactors
In this research the pH mean value for the raw sewage Influent was 7,6 (0.28) and 7.44(0, 13) and 7 .4 7 (0, 16) for the effluent of R I and R2, respectively. The slightly lower pH values which was observed in the UASB effluent is expected in the anaerobic treatment where the buffering capacity in the raw domestic wastewater is enough to neutralize the production of volatile acids and carbon dioxide, which dissolved at the operating pressure [ 11], During the whole of the experiment was no observation for pH value out of the normal and optimum
Kalmar ECO-TECH '07 KALMAR, SWEDEN, November 26-28, 2007 3.1 2 General discussion
Fonn the average influent concentration of COD101 (I 045 mg/I) during one year which was
obtained by this research and the research don by Al-Shayah (2005) one can calculate the
number capita equivalent to the COD101 entered each reactor which is 3 capita and 2 capita for
RI and R2, respectively see Table 4,7, About 1892,5 1/c,year and 1321.85 1/c,year of CH4 in
gaseous form were produced from RI and R2, respectively as measured from the gas meter see Table 4.7. Moreover, the annual specific sludge production for each capita was 2, I kg TSS/c,year and 2, 7 kg TSS/c,year for RI and R2, respectively see Table 5,
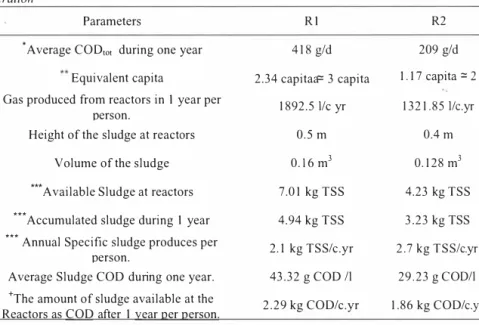
The accumulated COD in the sludge after I year per person in the reactors equal 2,29 kg COD/c.year and l .86 kg COD/c.year in RI and R2, respectively see Table 4.7. These values were reasonable related to (Jewell, 1994) who reported that for each I 00 kg COD soluble treated there will be 5 kg COD converted to sludge as mentioned at Figure 2.1. Theoretically and regarding to [ 12], the amount of COD that present at the sludge equals 5% of the soluble COD. Regarding to this research the percentage was taken related to the total COD, relatively it is less than the results reached by [ 12] it was 4.5% and 4.8% from the total COD for RI and R2, respectively, In general the design criteria of community on site UASB-septic in Palestine are presented in Table 5. At Table 6 the OLR for RI with HRT of 2 days was 0,45(0.12) and for R2 with HRT of 4 days was 0.23(0,06),
Table 5. General specification and results that Reached afier one year of Full monitoring and o era/ion
Parameters RI R2
•Average COD,01 during one year 418 g/d 209 g/d
Equivalent capita 2.34 capitaa::: 3 capita 1.17 capita ::: 2
Gas produced from reactors in I year per 1892.5 1/c yr 1321.85 lie.yr person.
Height of the sludge at reactors 0,5 m 0.4 m
Volume of the sludge 0. ! 6 m3 0.128 m3
••• Available Sludge at reactors 7.01 kg TSS 4.23 kg TSS
••• Accumulated sludge during I year 4.94 kg TSS 3.23 kg TSS
••• Annual Specific sludge produces per 2.1 kg TSS/c.yr 2.7 kg TSS/c.yr person.
Average Sludge COD during one year. 43.32 g COD /I 29.23 g COD/I
+The amount of sludge available at the 2.29 kg COD/c.yr 1.86 kg COD/c.yr Reactors as COD after I year per person.
•The calculation done after one year of continuous operation and monitoring during this research and the research done by AI-Shayah, 2005, where the average COD of influent for one year in A WWT = [(this research/Number of samples) + (AI-Shayah 2005/number of samples))/total number of samples at one year -+Average total COD inter to the reactor each day = flow rate (Lid)* Average COD (mg\ L)
•• The specific production of CODw, (g/c.d) range from ( 1 55-202) with average value of 1 79 g/c.d as reported by [9], -+ Equivalent population for the Treatment plant reactors in Capita = Average total COD inter to the reactor each day (g\d) I Specific COD Production (g\c.d))
... Total Mass of sludge at the reactor kg TSS/year = [The average sludge TSS of in the reactor (g\n13) • volume
of sludge at the reactor ( m3 )) -+ Accumulated mass of sludge at the reactor (kg TSS/yr) = [ (Total Mass of
sludge at the reactor kg TSS/yr) - (Mass of sludge added at start up)] , where at start up the amount of sludge added to the reactor are I 60L at R I and 80 L in R2. With TSS = 13. 78(g\l) so mass of the start up sludge added
=
to R I 1 60 I x 1 3. 78 (g\l) = 2.2 kg TSS and 80 I x 1 3. 78 (g\l) = I . I kg TSS for R2. (AI-Shayah, 2005), The specific sludge produced per person in one yeare [Accumulated mass of sludge at the reactor (kg TSS/year) = /
=
Equivalent Population (Capita)]e+ COD at Sludge (kg COD\c.yr) [ (Average COD concentration of sludge (g\l)
• volume of sludgee)/ capita] 4 CONCLUSIONS
• The here presented UASB-septic tank reactor is a very efficient technology for onsite sewage treatment in Palestine, It achieved the following main removal efficiencies: • The reactor can be adequately designed at either 2 or 4 days HRT, but preference
2 5 1 (9 ) 4
Kalmar ECO-TECH '07 KALMAR, SWEDEN, November 26-28, 2007
Removal effi ciency (%) OLR
HRT 3 COD,0, CODss C O Dcol CODdis
(kgCOD/m . d )
0.45(0. 1 2 ) 8 3 ( I 0) 2 0 ( 3 2 ) 24( I 5 )
0 . 2 3 ( 0.06) 54( 1 1 ) 8 7 ( 8 ) I 0(3 7 ) 28( 1 8 )
REFERE N C E S
[ ! ) Bogte, J . J . , Breure A . M . , van Andel J . G . , and Lettinga G . , 1 99 3 . Anaerobi c treatment of
domestic wastewater in small scale UASB reactors . Water Sci. Techno/.e, 27(9), 75-82 .
[2) Lettinga, G . , Man, A . W. A. de., Last, A. R. M . van der, W iegant, W . , Knippenberg, K . , Frij ns, J . , Buuren, J . C . L . van, 1 99 3 . Anaerobic treatment of domestic sewage and
wastewater. Water. Sci. Techno/.e, 27(9), 67-73 .
[3) Mahmoud, N . , Amameh, M . N . , AI-Sa'ed, R . , Zeeman, G . , G ijzen, H . , Lettinga, G . , 2003 . Sewage characteri stics a s a tool fo r the application of anaerobi c treatment i n Palestine. Environmental Pol lution, 1 26, 1 1 5- 1 22.
[4) Halalsheh, M . M . , 2002. Anaerobic pre-treatment of strong sewage A proper solution fo r J ordan. P h . D . thesis, Wageningen U niversity, Wagcningen, The Netherlands .
[5] Zeeman, G . , Lettinga, G . , 1 99 9 . The role of anaerobic digestion in closing the water and nutrient cycle at community level. Water Sci Technol., 39(5), 1 8 7- 1 94
[6) APHA ( 1 99 5 ) Standard methods for the examination of water and wastewater. 1 8th [7) Elmitwalli, T. A., Sklyar, V., Zeeman, G., Lettinga G . , 2002. Low temperature pre
treatment of domestic sewage in an anaerobic hybri d or an anaerobic fi lter reactor Biores. Techno/., 82, 233-239.
[ 8 ) Seghezzo, L . , 2004. Anaerobic treatment of domestic wastewater in subtropical regi ons. Ph. D . thesis, Wageningen U niversity" Wageningen, The N etherlands.
[9) Mahmoud, N ., 2002 . Anaerobic pre-treatment of sewage under low temperature ( 1 5 °C ) conditions in an integrated U A S B-digester system. Ph.D. thesis, W ageningen University, Wageningen, The Netherlands.
[ ! OJ H aandel, AC. Yan, Lettinga, G., 1 994. Anaerobic Sewage Treatment. A Practical Guide for Regions with a Hot Climate. John W i ley and Sons, New York .
( 1 1 ) Drost, R . L . , I 9 9 7 . Theory and practice of water and wastewater treatment. John Wiley & Sons Inc, Canada.
[ 1 2 ) Jewel l, W. J . , 1 994. Resorce Recovery Wastewater treatment. American Sci. Vol . 82. pp 3 66-3 7 5 .