WASTE MANAGEMENT AND THE ENVIRONMENT KALMAR, SWEDEN, November 5-7, 1997
21
ENVIRONMENTAL
IMPLICATION OF MSWI BOTTOM
ASH UTILISATION
Characteristics and Leaching Behaviour
Peter E. Holm & Ole Hjelmar VKI Denmark
INTRODUCTION
The development of environmentally sustainable utilisation and disposal strate gies for combustion residues such as solid waste products from municipal solid waste incinerators (MSWis) and coal fired power plants should be based on the best available knowledge of the short and long term leaching characteristics of the residues. The environmental impact may then be evaluated combining the knowledge about the leaching characteristics with information on the mobility and ecological properties of the released contaminants. To a large extent, this knowledge may be obtained through the performance of laboratory leaching experiments that in each case should be adapted to the relevant conditions. The laboratory results may in tum be used as input to a mathematical risk assessment model predicting the emission, transport and fate of the contaminants over a longer period of time. Most laboratory tests are accelerated and cannot take the effects of mineral ageing and weathering processes into account. Therefore, there is a definite need to verify and improve both the techniques and methods em ployed in laboratory leaching and attenuation studies and the methods of inter pretation and modelling by comparing the results to actual field observations. While the amount of previously reported and ongoing research on laboratory testing, particularly of the leaching properties of waste materials but also on the mobility of leached contaminants, is substantial, less information is available on the behaviour of actually land filled or utilised combustion residues. This is
un-Peter E Holm, Ole Hjelmar, Denmar1< 181 https://doi.org/10.15626/Eco-Tech.1997.021
� WASTE MANAGEMENT AND THE ENVIRONMENT
KALMAR, SWEDEN, November 5-7, 1997
derstandable in the view of the difficulties involved in getting reliable field data that are representative of well-defined conditions.
This paper presents characteristics and leaching behaviour of MSWI residues in general and specifically in relation to utilisation of MSWI bottom ash as a sub base material at a parking lot.
CHARACTERISTICS OF MSWI RESIDUES
The various types of residues produced by modem MSW mass bum incinerators are bottom ash, grate siftings, boiler ash, economiser ash, fly ash and acid gas scrubbing residues. The specific amounts produced of the different types of MSWI residues may vary and reflect differences in waste composition, technoc logical standards and operation parameters. Figure l shows mean data of solid mass stream in MSW incinerators. The data are from modem incinerators and compiled by IAWG (1997). f
•
I �•
� 0.0S1
s
20 12s
300Fig: I. Typical quantities of MSW/ residues produced per tonne solid waste. From IAWG (1997).
The grate siftings and the boiler ash are often directly combined with the bottom ash, and economiser ash is nearly always combined with the fly ash that may be collected separately or as part of the acid gas scrubbing residues. In this paper the term "fly ash" is used exclusively for the fine particles which are carried over from the combustor with the flue gases and subsequently captured in elec trostatic precipitators or fabric filters; it does not) include acid gas scrubbing residues. As seen in Figure 1, the bottom ash is the main waste stream (in average 300kg/tonne waste) from the incineration process. The bottom (or grate) ash ap pears after quenching/cooling with water as a coarse, extremely inhomogeneous
Peter E Holm, Ole Hjelmar, Denmark 182
WASTE MANAGEMENT AND THE ENVIRONMENT KALMAR, SWEDEN, November 5-7, 1997
granulate, usually contammg larger, fused lumps of slag and pieces of scrap metal. The grate siftings may also be relatively coarse whereas the other residues are much finer powders or (from the wet scrubbing process) a wastewater treat ment sludge.
Table 1 shows the ranges of composition of MSW! bottom ash (excluding the scrap metal portion and the size fraction larger than 45 mm which typically con stitutes 10 to 20 % of the total weight), fly ash and acid gas scrubbing residues from the dry and semidry processes.
g/kg
WASTE MANAGEMENT AND THE ENVIRONMENT KALMAR, SWEDEN, November 5-7, 1997
Table 1. Ranges of composition of MSW! bottom ash and other residues. From Hjelmar (1996)
Acid gas scrubbing Acid gas scrubbing
residues from the residues from the
Parameter Unit Bottom ash Fly ash dry/semidry proc- wet process (sludge ess (incl. fly ash) mixed with fly ash)
Si g/kg 210-290 95-190 57-98 120 Al g/kg 47-72 49-78 17-46 71-81 Fe g/kg 27-150 18-35 3.6-18 15-18 Ca g/kg 65-97 74-130 170-290 03-110 Mg g/kg 7.7-19 11-19 7.1-12 18-23 K 9.2-22 23-47 27-40 35-58 Na g/kg 22-41 22-57 Ti g/kg 3.2-7.2 7.5-12 s g/kg 1.3-8 11-32 a g/kg 1 .2-3.2 45-101 p g/kg 2.9-13 4.8-9.6 Mn g/kg <0.7-1 .7 0.8-1.7 Ag mg/kg 4. 1-14 31-95 As mg/kg 19-80 49-320 Ba mg/kg 900-2700 920-1800 Be mg/kg nd nd Cd mg/kg 1.4-40 250-450 Co mg/kg <10-40 29-69 Cr mg/kg 230-600 140-530 Cu mg/kg 900-4800 860-1400 Hg mg/kg <0.01-3 0.8-7 Mo mg/kg 2.5-40 15-49 Ni mg/kg 60-190 92-240 Pb mg/kg 1300-5400 7400-19000 Se mg/kg 0.6-8 6.1-31 Sn mg/kg <100-1300 1400-1900 Sr mg/kg 170-350 <80-250 V mg/kg 36-90 32-150 w mg/kg <20-50 nd Zn mg/kg 1 800-6200 19000-41000 PAH µg/kg 0.23-2200 30-110 Ol µg/kg 6.7-45 50-890 POl µg/kg <40 <40 Cl' µg/kg 16-34 120-1800 PCDD µg/kg 0.2-10 115-140 PCDF µg/kg 0.44-4.5 48-69 TCDD-eqv' µg/kg 0.02-0.22 1.5-2.5 TOC g/kg 4.8-13 4.9-17 LOI a/lea 5.9-50 11-45
'TCDD-toxicity equivalents determined according to Eadon's method. Nd: No data available.
PAH: Polycyclic aromatic hydrocarbons. CB: Chlorobcnzcnes.
CP: Chlorophcnols.
PCDD: Polychlorinated dibcnzo-p-dioxins. PCDF: Polychlorinated dibcnzofurans. TOC: Total 01:ganic carbon.
LOI: Loss on iguition (550 °C).
12-19 1.5-5.1 8-18 92-220 1.7-4.6 0.3-0.7 14-60 40-260 310-1400 0.5-0.9 140-300 4-15 150-570 450-1100 0.3-44 9.3-20 20-63 4000-6500 8.2-16 620-780 400-500 26-62 nd 12000-19000 18-5600 220 <40 860 0.7-1000 1.4-370 0.8-2 6-9 28-49 28-33 5.3-8.4 11-26 48-71 6.0-7.4 1.4-2.4 53 130- 190 330-1900 1.5-1.9 220-270 14-22 390-660 1000-1400 38-390 20-38 67-110 5900-8300 12 1000 200 62 nd 20000-23000 nd nd nd nd 260 120 2.8 7 110
Peter E Holm, Ole Hjelmar, Denmark 184
WASTE MANAGEMENT AND "THE ENVIRONMENT KALMAR, SWEDEN, November 5•7, 1 997
From Table 1 it is seen that the major elements (present in concentrations ex ceeding 10 g/kg) are nearly the same for all residues shown: Si, Al, Fe, Ca, Mg, Na, K, S (except for bottom ash), Cl (not for bottom ash), Zn (not for bottom ash) and Pb (only for fly ash). Many of these elements are present as oxides. The concentration of the various trace elements varies between the two types of resi dues; some e.g. Ba and Cr are present at the same concentration level in all resi dues, some notably Cu are usually enriched in the bottom ash, whereas several trace elements, particularly the more volatile elements (e.g. Cd, Hg, As, Pb and Zn) are enriched in the fly ash and the acid gas scrubbing residues.
LEACHING BEHAVIOUR OF MSWI RESIDUES
The potential leaching and release of components which may adversely affect the environment are obviously important properties in relation to disposal and utili sation of the residues and management of the leachate. Evaluation of the envi ronmental impact related to the leaching of constituents from MSW! residues must ideally be based on information regarding both the short term (months to years) and the long term (several hundreds of years) leaching behaviour of con stituents from the residues. Some data on the short term behaviour of most MSW! residues are available, and the evaluation of the short term behaviour may to a large extent be based on the results of laboratory and short term field ex -periments. Due to the scarcity of long term observations, the long term behaviour of the residues is much less understood. Evaluation of the long term behaviour requires use of different methodologies, e.g. simulation of long term conditions, extrapolation of the results of fundamental laboratory leaching testing, hydro geochemical modelling and field studies.
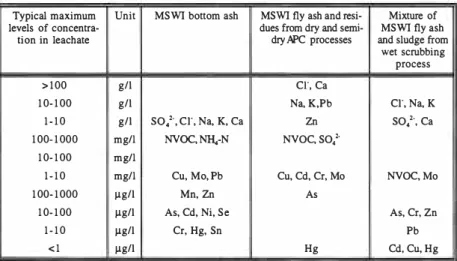
Table 2 presents an overview of the maximum levels of concentrations of inor ganic salts, trace elements and non-volatile organic carbon (NVOC) observed in initial leachate from the major types of MSW! residues. The concentration levels represent data from a number of laboratory leaching tests (mostly column tests) and a few field investigations (summarised in Hjelmar, 1996).
WASTE MANAGEMENT AND THE ENVIRONMENT KALMAR, SWEDEN, November 5-7, 1997
Table 2. Maximum concentration levels of contaminants in leachates from MSW! residues. Compiled in Hjelmar (/996).
Typical maximum Unit MSWI bottom ash MSWI fly ash and resi- Mixture of
levels of concentra- dues from dry and semi- MSWI fly ash
lion in leachate dry /iPC processes and sludge from wet scrubbing
process
> 1 00 g/1 er. ca
1 0- 1 00 g/1 Na, K,Pb cr, Na, K
1 - 1 0 g/1
so/,
er, Na, K, ca Znso;-,
ca1 00- 1 000 mg/I NVOC, NH,-N NVOC, SO/ 1 0- 1 00 mg/I
1 - 1 0 mg/I Cu, Mo, Pb Cu, Cd, Cr, Mo NVOC, Mo
1 00- 1 000 µg/1 Mn. Zn As
1 0- 1 00 µg/1 As, Cd, Ni, Se As, Cr, Zn
1 - 1 0 µg/1 Cr, Hg, Sn Pb
< 1 µg/1 Hg Cd. Cu, Hg
For most parameters, the maximum concentrations occur in the initial leachate, and most of the concentrations shown in Table 2 have been observed in fractions of leachate collected at or below US = 0.5 I/kg. US is the liquid/solid or leachate/waste ratio. For a particular utilised or deposited mass of residue, S will be constant and L will increase as the leachate is formed. An US scale may there fore be transformed to a time scale if the rate of percolation or flow through the site is known.
The various MSWI residues differ substantially from each other in terms of water solubility. Only a small fraction, often less than 5 %, of the total mass of the bottom ash is soluble is water whereas 20 to 25 % of the total mass of the fly ash and 30 to 40 % of the total mass of the dry/semidry acid gas scrubbing residues consist of salts which are readily soluble in water.
EXAMPLE: UTILISATION OF MSWI BOTTOM ASH AS A SUB BASE AT A PARKING LOT
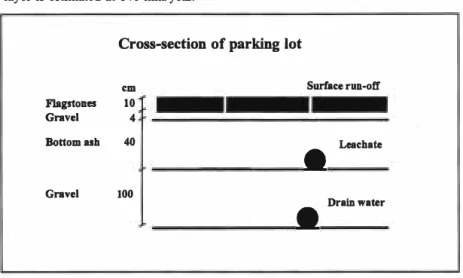
In 1974, approximately 4,000 tonnes of MSWI bottom ash (screened and treated magnetically to remove ferrous material) were used as sub-base under a parking lot in Ballerup near Copenhagen. A 40 cm layer of bottom ash was placed on top of a 100 cm thick layer of gravel (drainage layer). The site was paved with flag stones embedded in 14 cm of gravel which was placed on top of the bottom ash, see figure 2. The entire site which covers an area of 9,300 me2 is drained at the
bottom of the drainage layer. A 200 me2 plastic liner was placed between the ash
and drainage layer, and provisions were made to enable collection of drainage
Peter E Holm. Ole Hjelmar, Denmark 186
WASTE MANAGEMENT AND THE ENVIRONMENT KALMAR, SWEDEN, November 5-7, 1997
water, leachate (running off the top of the liner) and surface run-off. Samples of each have been collected annually or biannually over periods of a few days (during rain events) since 1975. The rate of infiltration through the bottom ash layer is estimated at 140 mm/year.
Cross-section of parking lot
cm Surface run-off
Flagstones 10
Gravel 4
Bottom ash 40
•
LeachateGravel 100
Drain water
•
Fig: 2: Cross-section of parking lot in Ballerup with MSW! bottom ash sub-base.
Ranges of the composition of the surface run-off, the leachate and the drainage water (leachate which has passed 100 cm of drainage gravel) collected from
1975 to 1995 are presented in Table 3.
Table 3. Ranges of composition of surface run-off, leachate and drainage water collected during 1975-1995 at a parking lot under which MSW! bottom ash has been used as subbase.
Parameter Unit Surface run-off Leachate Drainage water
oH 7 . 2 -8 . 1 7 . 1 -8.6 6.5-8.3
er
mg/I 4-41 (520) 140-2200 230-9 1 0 Total-N mg/I 0.7-6.0 ( 1 1 00) 4.7-200 2.0-92 Cd mg/I <0.000 1 -0.0006 <0.00005-0.0005 <0.000 1 -0.001 Cr mg/I <0.00 1 <0.00 1 <0.00 1 -0.002 Cu mg/I 0.002-0.05 <0.00 1 -0.002 0.002-0.0 1 4 Pb mg/I <0.00 1 -0.079 <0.00 1 -0.014 <0.00 1 -0.0 1 0 Zn mg/I <0. 0 1 -0. 1 2 <0.01 -0. 1 9 <0. 0 1 -0.09 ( ): extreme values47 3 3 7 . 9 4 . 3 mg/kg mg/kg mg/kg mg/kg mg/kg mg/kg mg/kg mg/kg
WASTE MANAGEMENT AND THE ENVIRONMENT KALMAR, SWEDEN, November 5-7, 1997
The total amount of leachate generated is difficult to estimate but corresponds to approximately 0.3 I/kg in 1975 and approximately US
=
4 I/kg in 1995. The leachate is primarily characterised by its inorganic salt content and its relatively low concentrations of heavy metals. The highest concentrations of lead and cad mium were observed in the surface run-off from the parking lot. The relatively high concentrations of chloride and total nitrogen found in one of the surface run-off water samples were probably related to the use of sodium chloride and urea as deicing agents during the winter.In 1995 samples of the 21 year old bottom ash were obtained and used for solid phase characterisation and leaching behaviour. Table 4 shows the results of the characterisation of the old bottom ash compared with fresh botttom ash sampled in 1993 and 1995 from the same MSW incinerator.
Table 4. Total composition of the MSW! bottom ash sampled under the parking lot and fresh bottom ash from 1993 and 1995.
Parameter Unit Bottom Ash
OldA Old B Fresh 1 993 Fresh 1995
pH - 9 . 3 9 . 2 - 1 0.4 Alkalinity mmol/g 2 . 2 2 . 2 - 3 . 1 Loss on ignition g/kg 43 2 4 NVOC g/kg 1 9 20 - 1 7 Si g/kg 240 240 1 80 230 Al g/kg 45 46 5 9 6 5 Fe g/kg 7 8 8 3 1 20 7 1 Ca g/kg 64 65 ll O 9 3 Mg g/kg 8 . 0 8 . 1 8 . 5 l l Mn g/kg I . 7 2 . 0 1 . 7 1 . 3 Ti g/kg 2 . 9 3 . 0 7 . 2 p K g/kg g/kg 1 0 4 . 2 1 0 5 . 6l l 4.4 1 0 Na g/kg 42 41 21 33
s
g/kg 1 . 1 1 . 0 5 . 1 3 . 5er
g/kg 0 . 5 0 . 5 3 . 3 3 . 3 As mg/kg 4 1 3 6 44 2 7 Ba 1 400 l l OO 1 050 1 500 Cd 6 . 9 6.4 ll 1 .4 -Cr 2 1 0 230 320 Cu 2200 2400 7800 1 5000 -Hg 0.29 0. 1 4 <0.2 Ni 1 3 0 290 2 1 0 320 Pb 2300 2300 2 1 00 2400 -Zn 4000 3900 4500Ul (Wl:g)
WASTE MANAGEMENT AND THE ENVIRONMENT KALMAR, SWEDEN, November 5-7, 1 997
The data presented in Table 4 show that the pH of the aged ash is lower than the pH of the fresh ash sampled in 1993 and 1995. The lower pH in the aged bottom ash is probably caused partly by carbonisation (uptake of carbon dioxide) and partly by leaching of alkalinity with percolating water. This was further con firmed by measurements of pH as a function of depth in the bottom ash. pH in creased from approximately 8.3 at the top to a pH of 9.3 to 10 at the bottom of the layer.
For an evaluation of the future leaching behaviour of the 21 year old bottom ash, samples of this ash were subjected to different leaching tests, including column leaching tests (L/S = 0.1, 0.2, 0.5, 1.0), availability tests (2 x LIS = 100 I/kg, pH = 7 and pHe= 4), serial batch leaching tests for granular waste (LIS = 2, 10, 50) and pH-static leaching tests at pHe= 2, 4, 6, 7, 8, 9, 10, 11 (US = 5). In Figure 3 ex amples of the leaching behaviour of chloride and lead are shown in terms of re sults from the availability test and the serial batch leaching test
RNulla of charactorlzallon 21 yr old MSWI bolllom uh (<2 mm)
Chlorkla ,ooo Tolll .,.._
i
...---!. ,oo ,.!..
I
,o 30 ,0 ,o 20 40 LIS (Mltl Lead 10000 1000i
100 • • • • • • • • • • • • . • . • • • • • • • • • !, Toe.l l'lllltlll conllnt i 10 ,. 0,01 0,1 0,001 .i.-=---�--�---� 0 10 20 30 40 soFig. 3: Accumulated release of lead and chloride from 21 year old MSW/ bottom ash shown as function of the US-ratio.
WASTE MANAGEMENT AND THE ENVIRONMENT KALMAR, SWEDEN, November 5-7, 1997
The results for chloride shown in Figure 3 show that the amount of chloride characterised as available for leaching approximates the total concentration of chloride found in the ash, and the accumulated release of chloride increases as a function of LIS and has at LIS = 50 1/kg reached approximately 40 % of the total amount of chloride available for leaching. As expected, this behaviour is differ ent from the one observed for the trace elements, here exemplified by lead. A large fraction of the lead found in the ash is not available for leaching as shown by the results of the availability test and the serial batch leaching test. This type of information contributes to a better understanding of the leaching behaviour of these two elements and exemplifies that salts like chloride are relatively easily leached from bottom ash, whereas many trace elements are strongly bound within the solid matrix and only to a limited extent available for leaching.
Further information of the leaching behaviour can be obtained through the per formance of pH-static leaching test as shown in Figure 4.
pH dependent leaching behaviour (US = 5 I/kg) 21 yr old MSWI bottom ash (<0.1 25 mm)
4D 4D 1 000 100 1 0 0,1 0,01 0,001 0,0001 2 4 6 8 10 12 .pH
Fig. 4. pH dependent leaching behaviour of a 21 year old MSWJ bottom ash.
Peter E Holm, Ole Hjelmar, Denmark 190
WASTE MANAGEMENT AND THE ENVIRONMENT KALMAR, SWEDEN, November 5-7, 1997
pH is probably the single most important factor controlling the leaching behav iour of trace elements from incineration residues. The information from this type of testing illustrates the pH-dependent leaching behaviour of the elements found in the slag. The different form of the leaching curves representing the elements reflect the solubility of the different minerals present in the slag.
CONCLUSION AND SUMMARY
This paper presents a number of data on the composition and leachability of MSWI residues. Based on these data it can be concluded that:
The bottom ash contains high concentration of several salts and trace elements. The leachate from the bottom ash contains high initial salt, ammonia, NVOC concentrations and relatively low concentrations of trace elements.
Results of field and laboratory leaching tests may provide good basis for evalua tion of leaching behaviour of contaminant from combustion residues. However, only a few long term studies of actual utilisation of MSWI bottom ash are avail able and there is a need for further long term field observations and laboratory experiments.
REFERENCES:
IAWG (1997) The International Ash Working Group: Chandler, A.J.; Eighmy, T.T.; Hartlen, J.; Hjelmar, 0.; Kosson, D.S.; Sawell, S.E.; van der Sloot, H.A. & J. Vehlow: Municipal solid waste incineration residues. Studies in Environmental Science 67. Elsevier, The Netherlands.
Hjelmar, 0. (1996): Disposal strategies for municipal solid waste incineration residues. Journal of Hazardous Materials 47: 345-368.
DOI: https://doi.org/10.1016/0304-3894(95)00111-5