The Impact of Loss Aversion Bias on
Herding Behavior of Young Swedish
Retail Investors
A Behavioral Perspective on Young Swedish Retail
Investors’ Decision Making in the Stock Market
BACHELOR PROJECT
THESIS WITHIN: Business Administration NUMBER OF CREDITS: 15
PROGRAMME OF STUDY: International Management AUTHORS:
Alizada, Zekria 940723 Clarin, Oscar, 960422 Group 50
TUTOR: Oskar Eng JÖNKÖPING June 2018
i
Bachelor Thesis in Business Administration
Title: The Impact of Loss Aversion Bias on Herding Behavior of Young Swedish
Retail Investors
Authors:
Alizada, Zekria and Clarin, Oscar, Group 50
Tutor:
Oskar Eng
Date:
2018-05-17
Key terms:
Behavioral Finance, Loss Aversion, Herding Behavior, Swedish Retail InvestorsAbstract
Background: Kahneman and Tversky (1974, 1979 & 1992) argue that individuals are bound to
numerous behavioral biases that may lead to the emergence of different irrational behaviors. This is often observed with even a higher degree among participants of financial and stock markets as agents such as investors are frequently exposed to significant level of risk and uncertainty (Kahneman, 2013; Kahneman, Knetsch & Thaler, 1991; Kahneman & Tversky, 1974, 1979, 1992). Also, empirical studies indicate that a significant level of herding exists among investors when they are exposed to a high degree of risk and uncertainty such as those in financial crises (Galariotis, Rong & Spyrou, 2014; Litimi, 2017; Hott, 2009).
Purpose: the main purpose of this thesis is to explore if the loss aversion bias has a significant causal
impact on forming herding behavior among young Swedish retail investors.
Method: an online analytical questionnaire including eight questions has been conducted to collect
primary data, with 77 Swedish retail investors under the age of 35 participating in the study. Furthermore, a multiple regression analysis has been implemented to analyze and interpret the data.
Conclusion: it can be concluded that there is not a significant correlation between the degree of loss
aversion and the degree of herding behavior within the sample group of young Swedish retail investors. Hence, loss aversion bias cannot be considered as one of the major contributors of herding within the target population.
ii
Table of Contents
1.
Introduction ... 1
2.
Problem and Purpose ... 2
3.
Literature Study and Frame of Reference ... 4
3.1
Traditional Finance ... 5
3.1.1
Expected Utility Theory ... 5
3.2
Behavioral Finance... 7
3.2.1
Prospect Theory ... 9
3.2.2
Herding Behavior Theory ... 12
3.3
Hypothesis Formulation ... 15
4.
Methodology ... 17
4.1
Research Paradigm ... 17
4.2
Target Population and Sample Group ... 18
4.3
Method of Data Collection ... 18
4.4
Method of Data Analysis ... 20
4.5
Assumptions ... 22
5.
Results and Empirical Findings ... 23
6.
Analysis and Interpretation ... 26
6.1
Descriptive Analysis ... 26
6.2
Analysis and Interpretation Using IBM SPSS ... 29
6.2.1
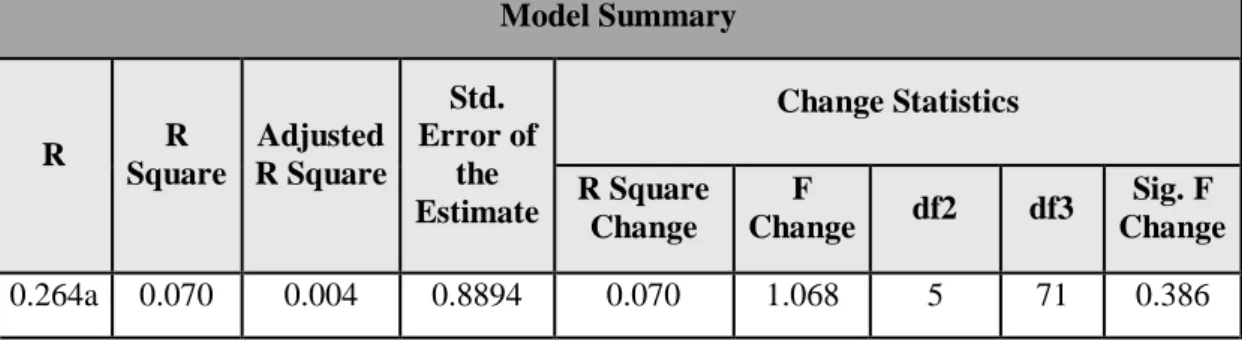
Model Summary ... 30
6.2.2
ANOVA ... 30
6.2.3
Coefficients ... 31
6.2.3.1 Loss Aversion ... 31 6.2.3.2 Age…... ……….31 6.2.3.3 Education Years ... 32 6.2.3.4 Annual Income ... 32 6.2.3.5 City Population ... 326.3
Loss Aversion and Control Variables ... 32
6.4
Other Factors ... 33
7.
Conclusion ... 36
8.
Discussion ... 37
8.1
Theoretical Contribution ... 37
8.2
Practical Implications ... 37
8.3
Limitations ... 38
8.4
Suggestions for Future Studies... 39
9.
Reference list... 40
10.
Appendices ... 45
10.1
Appendix 1 ... 45
10.2
Appendix 2 ... 46
1
1. Introduction
_____________________________________________________________________________________
This chapter aims to provide a short introduction of the psychological studies on the
impact of social pressure on individuals’ decision-making process and its relevance to
the field of finance. Also, a short introduction of the concepts of herding and loss aversion
as well as the major premises of traditional and behavioral finance are included.
Solomon Asch conducted an experiment in 1952 indicating that social pressure on individual judgement is very powerful and that individuals are not as independent as one might think (Asch, 1952). Later, Deutsch and Gerard concluded that the result of Asch experiment was largely due to the individual’s belief that other people’s decisions just could not be faulty (Deutsch & Gerard, 1955). Moreover, results of these experiments led to further investigation by other researchers regarding human behavior and decision-making process, and specifically for this paper their possible impact of such human behavior on financial markets such as stock markets. By reviewing the most-influential existing literature on the topic of humans’ behavior and decision-making process, one may state that loss aversion and herding behavior are two important elements that, together with other elements, are often observed among individuals.
Relating to this thesis, herding behavior within financial/stock markets can be defined as investors’ financial decision making and actions that are not based upon profound or fundamental analysis of available information, but rather an imitation of other investors’ decisions and actions. This can specifically occur in case of decision making under risk and uncertainty within the financial markets (Shiller, 2016). Another psychological aspect that has been observed and integrated into the financial research field is the fact that individuals immensely dislike the emotional and psychological pain caused by losing. In other words, individuals are prone to avoid losing something, both in a financial and non-financial setting, as a loss can involve a much stronger negative emotional and psychological effect on individuals than the positive emotional and psychological effect that gaining something can bring, individuals can therefore be loss averse (Thaler & Sustain, 2009).
Furthermore, by perusing the existing body of knowledge, it can be claimed that the underlying assumptions and theories within the field of finance are rather based upon the Efficient Market Hypothesis which is formed by the studies of various scholars such as Markowitz (1952), Sharpe and Fama (1963), and Fama (1970). However, it can be argued that the underlying assumptions of the efficient market hypothesis mostly neglect the emotional and psychological aspects such
2
as those mentioned above, that may affect investors’ financial decision making (Thaler, 2016). Consequently, this has led to development of a new field of finance, called behavioral finance aiming to include the psychological factors, something that the authors of this thesis find fascinating to further explore. Therefore, the authors of this paper briefly restate and evaluate the dominating assumptions and theories within the field of finance, but mostly take a behavioral finance approach to conduct their research and to address their research question.
2. Problem and Purpose
_____________________________________________________________________________________
This chapter includes the process behind research problem identification and research
question formulation for this thesis. It also includes the differences between this thesis
and existing empirical studies on the topic of study as well as its contribution to the
existing literature.
A review of current empirical studies within behavioral finance (e.g., Verma, Baklaci & Soydemir, 2008; Hott, 2009; Chiang & Zheng, 2010; Venezia, Nashikkar & Shapira, 2011; Dhaene, Linders, Schoutens & Vyncke, 2012; Galariotis, Rong & Spyrou, 2014; Cipriani & Guarino, 2014; Mobarek, Mollah & Keasey, 2014; Duxbury, 2015; Dang & Lin, 2016; Galariotis et al., 2016; Lee, 2017; Li, Guo & Park, 2017; Bohl, Branger & Trede, 2017; Bekiros, Jlassi, Lucey, Naoui, & Salah Uddin, 2017; Zheng, Li & Chiang, 2017; Igual & Santamaria, 2017; Litimi, 2017) indicate that many of these studies have mostly aimed to address the question of whether investors’ behavior within financial or stock markets can be considered as rational or irrational, or to examining if investors exhibit systematic herding behavior. However, relatively less empirical studies have been conducted to examine if there is any relationship between this herding behavior and different behavioral biases studied by scholar such as Kahneman and Tversky (1974, 1979).
To add, to our knowledge, the studies conducted by Swedish researchers such as Ohlson (2010) regarding herding in the Swedish stock market mostly focus on the same aspects as the ones in the previous empirical studies (i.e., to examine if herding behavior is observed among investors in the Swedish stock market). In other words, it can be claimed that such empirical studies neither focus on specific reasons behind this herding behavior of investors nor they make attempts to examine the possibility of an existing relationship between the herding behavior of a specific group of investors such as young retail investors and behavioral biases such as loss aversion. Here, a retail investor can be defined as “a member of the public who makes investments, not a
3
large organization or business that makes investments” (Cambridge Dictionary, 2018).
Therefore, the main purpose of this thesis is to address this unexplored area. More specifically, this will be done by focusing on the two aspects of loss aversion and herding behavior and by investigating a possible relationship or correlation between these two within a specific investment group (i.e., young Swedish retail investors). Consequently, the following research question is formulated to address the research problem:
"Is there any significant correlation between loss aversion and herding behavior of young Swedish retail investors?"
Our thesis study differs from the existing literature in the following ways: i) it does not take the approach of the existing empirical studies as its main purpose is not to test whether general herding behavior is observed within one or more stock markets, but to test if a possible causal relationship (i.e., correlation) exists between the two variables of loss aversion and herding behavior, ii) it does not include all the Swedish investors as its target population, but rather focuses on a specific group of investors called young Swedish retail investors, iii) it does not employ the cross-sectional absolute deviation model prevalent among existing empirical studies to analyze the data, but rather employs a multiple regression analysis as a data analysis method that is more suitable for this thesis. By addressing the research question, this paper may contribute to the existing body of knowledge by providing partial explanation of why herding behavior can be observed among young Swedish retail investors as well as opening the path for further research regarding the possible interaction between different behavioral biases and their effect(s) on individuals’ investment decisions.
4
3. Literature Study and Frame of Reference
_____________________________________________________________________________________
This chapter provides a review of the existing literature and major theoretical framework
relevant the topic of this thesis. Consequently, a funnel approach is taken in which at first
the traditional finance section briefly introduces the reader to the fundamental
assumptions within the traditional finance field. Later, the behavioral finance, prospect
theory, and herding behavior theory sections provide a review of the most relevant
literatures that mostly oppose the underlying assumptions mentioned in the previous
section. Furthermore, these opposing literatures have been evaluated and mostly referred
to by the authors to build a theoretical foundation to address the research question.
Finally, the hypothesis formulation process and visualization of a model of financial
herding behavior are followed.
Considering the research question mentioned in the previous chapter, a five-step searching process is followed by the authors to identify and select the most relevant existing literature. This searching process includes the following steps; 1) choosing a topic based on the authors’ interest as well as its relevancy to the field of business and finance (i.e. loss aversion and herding within the Swedish stock market), 2) defining the scope/timeframe of the literature (i.e. 1950-2018), 3) using Google Scholar and Primo as the main online data bases for academic journals and Jönköping University library for physical books, due to their academic credibility and full student accessibility, 4) formulating key searching terms (e.g., Loss Aversion, Prospect Theory, Financial
Herding, Loss Aversion and Herding in Stock Market, Loss Aversion and Herding in Swedish Stock Market, Human Biases, Emotional Biases, Emotional Biases and Stock Market, Behavioral Finance, Psychology in Finance) and employing Boolean operators (i.e. AND, and OR), and 5)
setting criteria such as the credibility of the journals, literature being peer-reviewed, number of citation, and credibility of the authors and the influence of their research on the topic.
Consequently, over fifty peer-reviewed academic journal articles and numerous books written by major scholars within the relevant fields are selected and reviewed, enabling the authors of this paper to gain a better insight on the topic. Based on this review, it can be stated that the existing body of knowledge covers different aspects including, but not limited to, background on traditional finance and efficient market hypothesis, expected utility theory, psychological studies on human decision making under risk, behavioral finance, prospect theory, and herding theory and its implications on stock markets. To add, it can be argued that perusing of the mentioned
5
aspects is a relatively intricate task. Therefore, a conceptual or thematic approach is taken in which each aspect is individually explored.
3.1 Traditional Finance
The development of traditional finance starts with Harry Markowitz (1952) and his well-known article "Portfolio Selection". Markowitz’s presents for the first time a model that gives a detailed definition of risk and return. The mean-variance model Markowitz presented is constructed in a way that investors should apply when trading on the financial markets and thus moving away from economics (Miller, 1999). The Efficient Market Hypothesis (EMH) is a concept that was researched and developed by Eugene Fama. It states that there is no universal rule based on either previous or current information that can enable the investors to gain abnormal returns (Shleifer, 2000). The Random Walk theory is one of the main concepts within the EMH which is based on two different assumptions. Firstly, price fluctuations are independent random variables and the second assumption is the changes conform to some probability distribution (Fama, 1963). The theory states that stock prices reflect all the information available in the market, hence, all new information entering the market will instantly get incorporated into the stock price. Since the new information is unpredictable, it is either positive, negative or not relevant to the specific security. This creates a “random walk” for the asset markets and the possibility of abnormal return is not possible to achieve consistently in the long-run (Shiller, 2016).
The critique against the EMH regarding the rationality of individuals in the financial market created three different alterations of the EMH, the first one is that the financial markets are rational and that securities are accurately valued based on the assumption that the market participants are rational. The second alteration makes assumption that not all market participants are rational, however, it is argued that the activity of the irrational individuals does not affect the market due to neutralizing impact of the trading activity by such irrational individuals. The third alteration also includes irrational individuals in the market, the argument for a continued market efficiency is that the rational arbitrageurs participating in the market will eliminate the influence of the irrational participants on the market prices of financial securities such as stocks (Shleifer, 2000).
3.1.1 Expected Utility Theory
It is argued that the expected utility theory (EUT) has been taken by economists as the main model of decision making under risk for several decades, with the model being adopted in a dual role meaning that it is considered as both normative (i.e., offering explanation of how people should make decisions under risk) and descriptive (i.e., explaining how people make decisions under risk in real life) (Kahneman, 2013; Kahneman & Tversky, 1992; Barberis, Huang & Santos, 2001; Thaler, 2016). It is believed that the initial assumptions of the EUT are based upon the works of
6
Daniel Bernoulli in 1738, with risk aversion being as one of the key assumptions (Kahneman, 2013; Thaler, 2016). His observations indicated risk aversion and tendency of most people to avoid the worst outcomes (Kahneman, 2013).
Bernoulli emphasized on the concept of utility or happiness and argued that an increase in financial wealth leads to an increase in people’s happiness or utility, but at a decreasing rate (Thaler, 2016). However, he argued that a same amount of money has the same utility for two people, regardless of their initial wealth (Kahneman, 2013). In his work in 1944 the Mathematician John von Neumann relied on this initial idea of diminishing marginal utility offered by Bernoulli to create a formal and normative theory of decision making under risk called the expected utility theory (Kahneman, 2013; Thaler, 2016).
Additionally, it is argued that optimization by people or economic agents is the core premise of economic theory (Thaler, 2016). In other words, the EUT predicts that only the best choice offered among many choices is chosen by individuals. For instance, a family chooses the best good or service that it can afford among all the goods and services that it could buy while staying unbiased and basing such decisions of consumption on rational expectations (Thaler, 2016). This constrained optimization prediction of the EUT together with the premise of equilibrium in which prices of goods, services, and financial assets freely fluctuate to equalize supply and demand within competitive markets all shape the workhorse or foundation of economic theory (Thaler, 2016)
To add, Barberis et al, (2001) argue that the underlying assumptions and standard framework of thinking regarding the aggregate behavior of investors within the stock market has also been built upon models and theories that include the EUT as their foundation, leading to a consumption-based approach of thinking. Here, the consumption-consumption-based approach means that investors value stocks as financial assets based on the future consumption utility such stocks may offer (e.g., future cash flow and dividends) (Barberis et al., 2001). However, Thaler and Rabin (2001) argue that although the EUT captures some of the aspects behind decision making process under risk at large stakes, it mostly fails to provide an accurate or plausible prediction of decision making when stakes are rather moderate or small. This is argued to be due to the model’s assumption regarding the derivation of risk taking attitude toward both moderate-scale and large-scale risks from the same utility-of-wealth function (Thaler & Rabin, 2001).
7
3.2 Behavioral Finance
As emphasized by Keynes in his book The General Theory of Employment, Interest and Money, it can be claimed that an individuals’ decision-making process is strongly influenced by his or her emotions and intuitions, specifically within financial markets (Thaler, 2016). However, it is observed that such important aspect is mostly neglected by economists as they implement models and theories based on the assumption that people can fully control the impact of emotions and intuition on their decision-making process. In other words, in their models, economists have replaced Homo Sapiens with fully rational economic and financial agents with well-defined preferences and rational decisions called Homo Economicus or Econs (Thaler, 2016; Kahneman et al., 1991). Yet, in their work “The Cross-Section of Expected Stock Returns”, Fama and French (1992) acknowledge the existence of market anomalies in the financial markets between 1963 to 1990, contradicting some of the major assumptions of the rational economic agent theory.
Furthermore, Kahneman and Tversky (1974, 1979 & 1992) examine individuals’ decision-making process in laboratory settings and their findings illustrate that individuals possess significant cognitive and emotional biases that may consequently affect them and lead to their irrational behavior while making decisions, especially when they face risk or uncertainty. Again, these studies illustrate patters of human behavior which contradict the underlying assumptions of the rational economic agent theory and the prevailing efficient market hypothesis; “these patterns
of human behavior are not the result of extreme human ignorance, but rather of the character of human intelligence, reflecting its limitations as well as its strengths. Investors are striving to do the right thing, but they have limited abilities and certain natural modes of behavior that decide their actions when an unambiguous prescription for action is lacking” (Shiller, 2016, p. 166).
To expand, these psychological studies on human decision making shed light on a mechanism of decision making which distinguishes between two systems of thinking called System One or the Automatic System that is believed to be instinctive and rapid, and System Two or the Reflective System that is more deliberate or self-conscious (Kahneman, 2013; Thaler & Sunstein, 2009). The existence and characteristics of each of these systems can partially explain the observed decision-making limitations and irrationality of individuals within different context such as financial decision making (Kahneman, 2013; Thaler & Sunstein, 2009).
To add, papers by scholars such as Kahneman and Tversky (1974, 1979, 1992) have been successful to illustrate investors’ systematic violation of predictions made by the prevalent models and theories such as the rational economic agent or expected utility theory as well as efficient market hypothesis, the major models of decision making within traditional economics and finance (Barberis, 2013). Additionally, a review of existing empirical studies on factors affecting the decision making of investors confirm the significant impact of emotions and intuition on financial
8
decision making by individuals as well as indicating that financial decisions are rarely made without the influence of factors such family background, emotions, beliefs, individuals’ perception of risk and loss, gender, optimism, and cultural distance (Ávila, Oliveira, Ávila & Malaquias, 2016).
Furthermore, it can be stated that these findings are in line with Benjamin Graham’s ideas in his books the Security Analysis and the Intelligent Investor regarding the significance of human psychology and emotions on the decision-making process of individuals within economics and financial markets (Hagstrom, 1999; Thaler, 2016). Hence, a large stream of anomalies violating the EMH as well as influential studies conducted by scholars such as Kahneman and Tversky have all contributed to the emergence and development of the fields of behavioral economics and behavioral finance (Igual & Santamaria, 2017). To expand, behavioral finance aims to address market inefficiencies and the limitations of the prevalent theories such as EMH through offering of alternative paradigm that acknowledge individuals’ biases and partial irrationality, and it incorporates existing psychological theories to create more realistic theories and models on relevant aspects such as individuals’ decision making process within economics and financial markets (Daniel & Titman, 1999; Hagstrom, 1999; Pompian, 2012; Shleifer, 2000).
According to Shleifer (2000), behavioral finance perspective includes major theoretical challenges to the EMH, the dominating theory within the traditional finance field. These include, but are not limited to, the assumption that financial markets are efficient in the sense that market prices represent the underlying or intrinsic value of the financial asset, the assumption that the majority of individuals or investors act as rational economic or financial agents basing their decisions on profound analysis of available information, the assumption that uninformed market participant pursue passive investment strategies, the assumption that investors’ deviation from optimal economic rationality is random rather than been systematic, and finally the assumption that any effect of irrational decision making of a minority of market participants is neutralized by rational arbitrageurs’ moves (Shleifer, 2000).
Behavioral finance can be divided into two major fields of Behavioral Finance Micro (BFMI) which explores individual investors’ behaviors and biases, and Behavioral Finance Macro (BFMA) which examines existing anomalies that violate the EMH (Pompian, 2012). On the other hand, Igual and Santamaria (2017) state that behavioral finance lacks a unified theoretical body, hence, they offer a conceptual map of the field based on a review and synthesis of the existing body of knowledge (Appendix 1). This conceptual map offers an intuitive illustration of the psychological framework for irrational investor behavior based on the major studies within the field. This framework organizes the existing literature into three major aspects of Unconventional Preferences leading to the creation of Prospect Theory and exploration of loss aversion
9
(Kahneman & Tversky, 1979, 1992), Biased Beliefs leading to the creation of Representativeness Heuristic theory (Kahneman & Tversky, 1974), and the Social Interaction aspect leading to the creation of Herding Behavior theory (Prechter, 2001). Each of these aspects and theories have their own sub-categories, including models built upon the work of various scholars. Finally, a list of observed financial anomalies violating the major assumptions of traditional finance and EMH are included in the conceptual map (Igual & Santamaria, 2017). Considering the purpose of this paper and simplicity of this conceptual map, it is employed as a guideline by the authors of this paper to better review the existing body of knowledge in behavioral finance, with an emphasize on prospect and herding behavior theories to address the research question.
3.2.1 Prospect Theory
In their work Prospect Theory: An Analysis of Decision under Risk, Kahneman and Tversky (1979) challenge the expected utility theory as a descriptive model of decision making under risk which is based on rules or axioms of rationality. Also, in their paper Advances in Prospect Theory, Kahneman and Tversky (1992) challenges two major underlying arguments of the economic theory: the first argument being that the only survivors within a competitive environment are those with rational behavior, and the second argument being that any attempt to abandon the concept of rationality within economic theory can cause chaos. According to EUT and prevalent assumptions among economists, individuals are considered as rational and self-interest economic agents called Econs who have stable tastes and make economic or financial decisions based on fully rational evaluation of the possible outcomes (Kahneman, 2013; Kahneman & Tversky, 1979; Thaler, 2016).
To expand, Kahneman and Tversky (1979, 1992) argue that one of the major limitations of the EUT is the assumption that individuals gain the same utility from a similar amount of financial wealth regardless of their initial wealth (i.e., lack of a reference point). For example, EUT predicts that two people with current wealth of five million dollars each have the same utility or are equally happy even though one of them had one million dollars yesterday while the other one had nine million dollars, yet, this prediction does not illustrate the reality of this case as person A with initial wealth of one million dollars does feel happier now after accumulating four extra millions than person B who has lost four millions since yesterday (Kahneman, 2013). Retrospectively, Kahneman (2013) and Kahneman and Tversky (1979, 1992) acknowledge partial implications of EUT in scenarios such as the one for person A, while arguing that this theory of decision making does not provide any plausible explanation regarding the utility for person B. In addition to the risk aversion aspect, they argue that people often seek risk in scenarios in which a certain loss is present (Kahneman & Tversky, 1979).
10
Considering all these limitations of EUT, Kahneman and Tversky (1979) develop a new model called prospect theory (PT), as an alternative model that offers a more realistic exploration of decision making process under risk. In their studies, Kahneman and Tversky (1979, 1992) illustrate that major assumptions and predictions of EUT are systematically violated by participants in a series of experiments in laboratory settings, consequently, leading to formation of PT as a new model of decision making under risk (Barberis, 2013). To add, PT can be perceived as an opposing model to theories and models such as the EMH, thus, leading to further studies on the influence of irrational behavior, emotions, beliefs, and human biases on investment (Ávila et al., 2016).
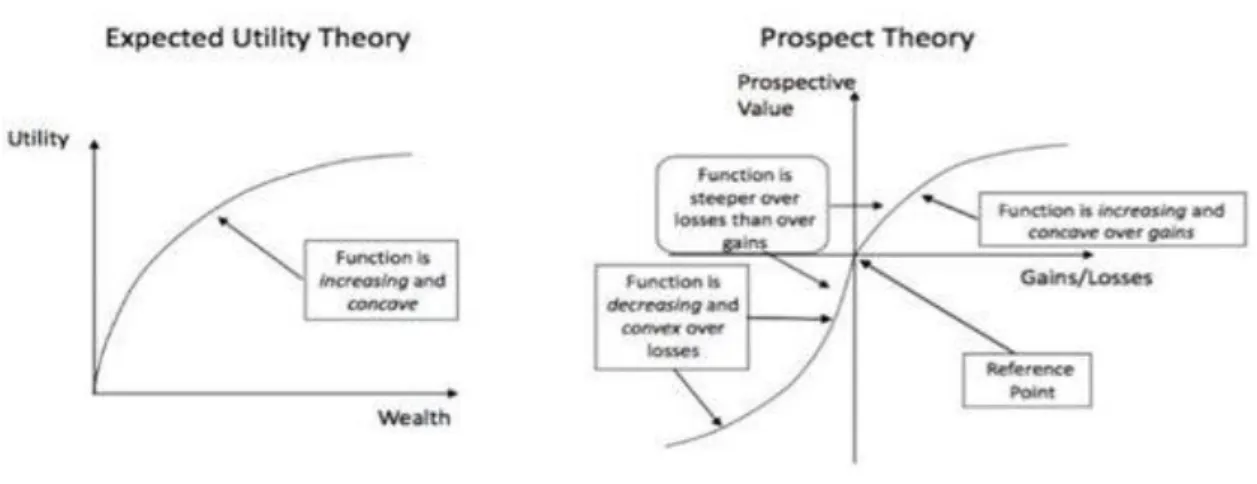
Thaler and Sunstein (2009) and Barberis (2013) agree with the mentioned arguments against EUT and claim that PT’s main premise is not to be normative model, but rather a descriptive model on how individuals really make decisions in economic and financial contexts. Later, Kahneman and Tversky (1992) offer a developed model of prospect theory, called, the cumulative prospect theory (CPT) by maintaining the original assumptions of PT and employing cumulative decision weights and adding several extensions. As illustrated in figure 1, it is argued that PT is derived from EUT, yet it fundamentally differs from EUT as it is aimed to be purely descriptive rather than normative (Kahneman, 2013). The major assumptions and predictions of PT are built upon four elements:
“1) reference dependence, 2) loss aversion, 3) diminishing sensitivity, and 4) probability weighting” where “people derive utility from gains and losses, measured relative to some reference point, rather than from absolute levels of wealth” (Barberis, 2013, p. 175).
Prospect theory includes two phases within the decision-making process: the editing/framing phase which includes preliminary analysis of available choices or prospects and construction of any contingencies or outcomes that may be relevant, and the evaluation phase in which a choice or prospect with highest gain or value is selected (Kahneman & Tversky, 1992). According to PT, individuals are influenced by the certainty effect, making them underweight outcomes that are probable and obtain those that come with certainty (Kahneman & Tversky, 1979). Also, it is stated that the major concept behind PT is that “the carriers of value are changes in wealth and welfare,
rather than final states” (Kahneman & Tversky, 1979, p. 277). Another major assumption of PT
is that the pain of losing a certain amount of money is perceived to be greater than the pleasure of gaining the same amount (Kahneman & Tversky, 1979).
11
Figure 1 Expected Utility (EU) versus Prospect Theory (PT)
Source: (Parravicini, 2016)
Furthermore, Kahneman and Tversky (1979) offer an alternative to the utility function of EUT, called the hypothetical value function with a S shape: “The value function is (i) defined on
deviation from the reference point; (ii) generally concave for gains and commonly convex for losses; (iii) steeper for losses than for gains” (Kahneman & Tversky, 1979, p. 279). Studies show
that individuals dislike losses and the automatic decision-making system or system one within everyone can make them very emotional due to losses or, in other words, “losing something makes
you twice as miserable as gaining the same thing makes you happy” (Thaler & Sunstein, 2009,
p. 33). By including loss aversion as one of the key elements, it is claimed that PT can better explain scenarios of decision making under risk with small or moderate stakes (Thaler & Rabin, 2001). Additionally, loss aversion is perceived as one of the major emotional biases emerged from human intuition and impulse and the influence of feelings and emotions on reasoning and decision-making process of individuals (Pompian, 2012).
It is also believed that models such as EUT that neglect loss aversion often provide misleading predictions that include unrealistic symmetry observed in the world, it is believed that loss aversion is closely related to other psychological phenomena such as the endowment effect and status quo bias (Kahneman et al., 1991). Endowment effect can be defined as individuals’ strong tendency to demand more to give up an object than they themselves would be willing to pay to possess the same item, while the status quo bias refers to individuals’ strong preference toward maintaining their current state than making changes (Kahneman et al., 1991).
Built upon the previous findings and the underlying assumptions of PT, Thaler and Johnson’s (1990) studies on the decision-making behavior of individuals in gambling illustrate the tendency of people to be risk seeking after prior gains and more loss averse after prior loss (the House Money Effect). Additionally, Thaler and Benartzi’s (1995) studies on the behavior of investors exhibit their reluctance to invest in stocks in comparison to other financial assets such as bonds
12
due to their loss aversion or perception of loss and gain in the stock market, even if they can obtain significant equity premium or the excess return investing in stock market can provide compared to financial assets such as bond over the long run. Scholars such as Barberis et al., (2001) build their studies on investors’ behavior within stock markets upon the findings by Thaler and Johnson (1990) and Thaler and Benartzi (1995) and their findings indicate that the investors derive utility from both consumptions of cash flows/dividends and the short-term fluctuations of their stock portfolio or financial wealth. Their findings also illustrate that the investors are loss averse over fluctuations in their stock investments, with prior investment performance strongly affecting the degree of loss aversion. Based on these findings, they propose a departing from the consumption-based models such as EUT and EMH, while emphasizing on the financial wealth fluctuation aspect. They also conclude that investors tend to be less risk or loss averse in a run-up or bull market and more risk or loss averse in a falling or bear stock market(Barberis et al., 2001).
Finally, Koszegi and Rabin (2007) and Barberis (2013) state that the derivation of utility from gains and losses based on a comparison of different prospects or outcomes to a reference point or status quo is the central idea of PT. So are loss aversion, a diminishing sensitivity to prospect changes regarding the reference point, and probability weighting of the prospects. Further, empirical studies indicate the significant influence of the environment and prior outcomes on modest-scale risk attitudes and loss aversion (Koszegi & Rabin, 2007). However, even though PT can be taken as the best available descriptive model of decision making under risk with significant insights, it still encounters some limitations. For example, PT is considered as a more complicated theory compared to EUT and EMH with assumptions or predictions that need to be tailored for economic or financial applications. Another limitation is the relative broad guideline provided by scholars such as Kahneman and Tversky on how to identify and evaluate gains and losses as carriers of utility (Barberis, 2013; Koszegi & Rabin, 2007). Hence, Koszegi and Rabin (2007) and Barberis (2013) argue that the question at hand is not to abandon models and theories such as EUT in favor of PT, but to incorporate both EUT and PT to generate theories and models that could provide a more realistic picture of decision making under risk in real world.
3.2.2 Herding Behavior Theory
Individuals are influenced by major social changes and it effects the economy, political environment and the financial markets alike. The phenomenon is widespread within our species and often starts with a small social nudge. Seeing the actors in a movie smile increases the likelihood for the individual to smile as well. Herding is a trait that has moved us forward through evolution, however, it also creates misconceptions that needs to be addressed (Thaler & Sustain, 2009). Herd behavior stems from the logic of following others where the individual has difficulty in determining the right course of action due to lack of knowledge or the belief that others know
13
better. It is a trait of the human that has prevailed through evolution as a survival mechanism that should increase the probability of survival (Prechter, 2001). However, even though there are times where herd behavior can assist the individual, the financial markets may not necessarily be one of them (Prechter, 2001).
Literature regarding herd behavior is extensive and has become one of the major fields within behavioral finance. Banerjee (1992) introduced a model on herding where decision can after certain point be only decided based on other previous individuals’ actions. Prechter and Parker (2007) introduces the concept of the Law of Patterned Herding (LPH) into finance. LPH is a socionomic theory that states that social systems that are built on homogenous agents and these agents are uncertain about other agents’ assessment regarding survival and success. This in turn creates the social mood of herding, a collective social action. As the valuation of financial assets are very complex there is an amount of uncertainty in the market. Prechter and Parker (2007) also make the comparison between economic goods and financial assets. Economic goods have an intrinsic value that is more identifiable compared to financial assets that are not. Utilitarian goods and investments should be treated differently since the future value of the investment good is uncertain. Thus, investment goods are more prone to be exposed to herding behavior.
Information cascades is a phenomenon that is argued to be one of main causes of herding behavior with individuals being prone to take decisions hastily without much information to support their own decision (Shiller, 2016). Bikhchandani, Hirshleifer and Welch (1992) proposes the model of information cascades that attempts to explain short-run fluctuations and conformities that can occur in the market. Short-run fluctuation refers to trends, booms and crashes, whereas conformities refer to imitating attitudes, beliefs and behavior of others. The phenomenon occurs when the individual without regard of his or her own information bases its decision on previous actions of others. The individual will in these cases only consider the information given by prior decisions that are observed. Information cascades can either have positive or negative implications, meaning that the individuals can either adopt or reject the proposed information.
To illustrate this in a more practical example, imagine there are two restaurants at the same location. One individual is in the interest of dining, the only information available to decide is the exterior of the restaurant since the restaurants also are currently empty. However, the next individual who is deciding on which of the two restaurants to enter has now additional information in form of another person dining in one of them. The second customer’s decision to follow the first customer creates a herding externality (Banerjee 1992). This decision creates a spiral that may increase the possibility that every one of the possible customers end up dinning at the same restaurant even though the other restaurant could have provided a better service. This would be a
14
case of a positive information cascade where the information given is adopted by individuals (Shiller, 2016).
There are two different social influences, peer pressure and information. The latter concerns the fact that when a large crowd of people conduct specific action or believes certain things, it leads to the crowd influencing the individual’s decision making through its behavior. Peer pressure is referring to the fact that individuals care about what others think about them. Believing this creates an urge for the individual to follow the group to avoid unwanted attention (Thaler & Sustain, 2009). Another distinction to be made is the difference between firm specific herding that is related to the individual security and macro herding that is linked to the overall market. The latter describes if the investor sentiment of the market is either bullish or bearish. The firm specific herding refers to the level of concentration of either buy and sell activity (Venezia et al., 2011). The evidence of herding in the financial markets is perceived to be strong. It is found to be a factor in both institutional and professional environments, as well as, with retail investors. Venezia et al., (2011) describes in their article the factors of compensation schemes and reputation as one of the main drivers behind herding. The retail investor, however, is more based on information discrepancies and the belief that other participants in the market are better informed. The higher level of uncertain information the investor has the more likely they are to imitate others (Fernández et al., 2011).
In an experiment conducted by Salganik, Dodds and Watts (2006) on herding individuals are tested by giving them a list of music produced by relatively unknown artists. The participants were split in to two groups, one independent and one group that would be provided with additional information of songs download statistic. The participants were then asked to rank the songs on preference. The results being that popular songs are more popular in the group with songs download statistic than the group without the extra information on past downloads.
In their article, Fernández et al., (2011) describe that a cognitive profile can help identifying reasons that may reduce or increase individuals’ impulse to herd. Three biases are identified that also find empirical support in the study. Overconfidence bias is a factor that reduces herding as the individuals overestimate their own knowledge or ability to perform. The more overconfident an individual becomes, the less likely he or she is to herd since others’ decisions are not valued as highly as one’s own, informational cascades are therefore ignored (Daniel & Titman, 1999). Furthermore, Self-Attribution bias or hindsight bias as it is sometimes referred to, is created when individuals’ decisions are based on past information and actions, the individual is not concerned about other external agents’ actions and does therefore not contribute to herding but rather reduces it (Fernández et al., 2011). Additionally, another bias called the illusion of control is created when individuals take decisions based on chance or believe that a game of chance is a game of skill.
15
Illusion of control bias increases the level of herding when it is presented (Kahneman & Riepe, 1998).
Rational herding can occur in the form of arbitrageurs taking advantage of irrational participants where they are able to capitalize on the irrational activity by creating pseudo-signals. Hence, the arbitrageurs profit from the irrational market instead of bringing the price of the security back to where the fundamental values support it (Dang & Lin, 2016). Rational agents can participate in herding behavior of other in the market by acknowledging the decision and judgement of other participants. However, even though the individual is rational in his or her decision the herd like behavior that is occurring still creates irrationality in the market (Shiller, 2016). The irrational behavior of market participants can influence the market where fundamental values of a stock is altered due to different feedback effects. The participants with different level of understanding of the market do not completely understand the behavior of each other creating additional alterations in market (Hirshleifer et al., 2006).
Herd behavior in the financial markets occurs when the investors disregard all or part of their own private information or belief regarding a security to instead follow other market participants. According to a study by Galariotis et al., (2014) on herding behavior in the UK and American market, no herding is observed within these markets during normal market conditions, however, herding is observed during the dotcom and the global financial crisis. On the other hand, a more comprehensive study by Litimi (2017) of the French stock market and different industry sectors provides significant evidence of herding in the whole market during these crises period. Also, the study identifies five industry sectors, such as telecom, oil and financial securities, where herding is occurring regardless of market conditions. Herding is identified as one of the reasons for price bubbles as the action of imitation of market participants create a positive feedback effect that hikes prices without fundamental basis. When investors realize that the market is based on inaccurate or false information the “bubble bursts” (Hott, 2009). To add, Chiang and Zheng (2010) conclude that herding behavior is often more prevalent within emerging markets in comparison to developed markets, due to information asymmetries.
3.3 Hypothesis Formulation
As already mentioned in the problem and purpose section, a review of current empirical studies within behavioral finance on the subject of financial herding behavior (e.g., Verma et al., 2008; Hott, 2009; Chiang & Zheng, 2010; Venezia et al., 2011; Dhaene et al., 2012; Galariotis et al., 2014; Cipriani & Guarino, 2014; Mobarek et al, 2014; Duxbury, 2015; Dang & Lin, 2016; Galariotis et al., 2016; Lee, 2017; Li, Guo & Park, 2017; Bohl et al., 2017; Bekiros et al., 2017; Zheng et al., 2017; Igual & Santamaria, 2017; Litimi, 2017) indicate that none of these studies
16
examine if there is any causal relationship between loss aversion or other behavioral biases studied by scholar such as Kahneman and Tversky (1974, 1979) and investors’ herding behavior. Also, it can be stated that studies conducted by Swedish researchers such as Ohlson (2010) do follow the same approach as the mentioned empirical studies (i.e., investigating if herding behavior is observed in the Swedish stock market). Hence, it can be claimed that a probable causal relationship between young Swedish retail investors’ loss aversion and the degree of their herding behavior has been remained as relatively unexplored, hence, leading to the formation of the following research question: "Is there any significant correlation between loss aversion and
herding behavior of young Swedish retail investors?” Here, herding behavior is taken as the
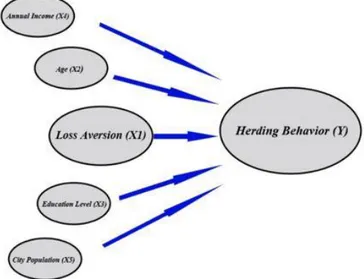
dependent variable, loss aversion as the primary independent variable, and age, education years, annual income, and city of residence population as the secondary independent variables. Furthermore, the following hypothesis is formulated:
Hypothesis 1
𝑋1. There is a significant positive correlation between young Swedish retail investors’ degree of
loss aversion and their degree of herding behavior.
𝑋0. There is not a significant positive correlation between young Swedish retail investors’ degree
of loss aversion and their degree of herding behavior. Figure 2 A Conceptual Model of Financial Herding Behavior
17
4. Methodology
_____________________________________________________________________________________
This chapter provides an overview of the major research paradigm followed in this thesis,
description of the target population and sample group, an exploration of the methods of
data collection and data analysis, and the main assumptions undertaken by the authors
while designing and conducting the research.
______________________________________________________________
4.1 Research Paradigm
A research paradigm can be defined as “a philosophical framework that guides how scientific research should be conducted” (Collis & Hussey, 2014, p. 43). Considering this definition, it is stated that research methodologies are often based upon one of the two major paradigms: positivism and interpretivism. Positivism is a research paradigm that is mostly built upon realism philosophy i.e., including the assumption of singularity and objectivity, and involving a deductive perspective to offer explanatory theories regarding the subject of study (Collis & Hussey, 2014). Here, a deductive perspective may include the implementation of existing theories to create hypotheses that can be tested through quantitative methods of data collection and analysis (Research Methodology, 2018). The other paradigm is interpretivism which incorporates subjectivity as a critical element throughout the research process as well as involving an inductive perspective to offer interpretative understanding of the subject of study (Collis & Hussey, 2014). Contrary to deductive reasoning, inductive reasoning often includes a bottom-up approach in which general conclusions or theories are made based on the exploration of hypotheses formulated from identified patterns within specific observations (Trochim, 2006).
Consequently, positivism is chosen as the major methodological paradigm in this thesis due to following reasons. First, unlike interpretivism, positivism has a top-bottom approach meaning that it involves reference to existing theoretical framework to create hypotheses that later can be tested through studying of observations. Hence, it can be stated that positivism fits with this thesis as the authors’ main objective is not to create new theories, but rather referring to existing theories as guidelines while testing if a causal correlation exists between different variables.
Second, positivism enables the authors to use the existing body of knowledge to formulate hypotheses that can be quantitatively tested to offer explanations “establishing causal relationships between the variables by establishing causal laws and linking them to a deductive or integrated theory” (Collis & Hussey, 2014, p. 44). Again, unlike interpretivism, positivism may better fit this study as the formulated research question and hypothesis both aim to address a
18
causal relationship or correlation between two major variables: loss aversion as the independent variable and herding behavior as the dependent variable. Also, although the existing theoretical framework on loss aversion and herding behavior is referred to by the authors as a major guideline, positivism or deductive approach may enable the authors to employ findings and possible causal relationships between mentioned variables to integrate existing theories, thus, contributing to the existing body of knowledge through an integrated theory of loss aversion and herding behavior.
Finally, positivism is perceived to be more objective than other paradigms such as relativism, with the findings of a study having more generalizability (ReviseSociology, 2015). To expand, investigation of a probable relationship between the two mentioned variables may involve the effect of some other independent variables that can simultaneously have causal relationships with herding behavior as the dependent variable. Not including other relevant independent variables that can significantly influence a dependent variable may follow the formation of fallible causal relationship or biased conclusions (Månsson, 2016). Therefore, implementation of quantitative methods of data collection and analysis can enable the authors to incorporate some of these applicable independent variable, hence, adjusting the findings to these relevant factors or partially controlling their impacts on the final outcomes.
4.2 Target Population and Sample Group
It should be acknowledged that authors have faced several challenges such as lack of time and financial resources to collect a full set of data on the whole population of Swedish investors. These challenges have resulted in a narrower target population that would enable the authors to conduct a more reliable research. Consequently, the target population of this study only includes young Swedish retail investors in the stock market i.e., individuals with Swedish nationality or Swedish residency who are between the ages of 18 to 35 and currently have stock investments. To elaborate, the authors of this thesis have their own subjective definition of youngness because there is no official definition of who can be considered as young. Additionally, there is no public data on exact number and personal information of individuals within the target population. Therefore, this makes it impossible to conduct a standardized random sampling to choose the sample group for the study. Consequently, the sample group consists of volunteer participants within authors’ social network as well as respondents’ social networks (snow-balling method).
4.3 Method of Data Collection
Although there are several methods of data collection within positivism paradigm, such as interviews and critical incident techniques (Collis & Hussey, 2014), online analytical questionnaire is selected by the authors as the major method to collect primary data for this thesis.
19
This choice of data collection method is based upon suitability of analytical questionnaires for determining relationships between different variables that are derived from deliberate study of existing theoretical framework (Collis & Hussey, 2014) as well as the convenience to collect data from a relatively larger and more diversified sample group with sample members spread all over Sweden.
Initially, volunteers are asked if they have Swedish citizenship or currently live in Sweden and if they currently have any stock investments. If their responses to these questions are positive, they can proceed with the online questionnaire. The questionnaire itself consists of eight closed questions meaning requiring the respondents to choose one of the predetermined choices as their answers for each question. Also, the questionnaire is created on the free online platform Google Forms and is distributed on authors’ online social networks such as Facebook due to the convenience these platforms offer to reach a relatively large and diversified sample group regardless of locations or regions in which respondents may live.
The major purpose behind questions one to four is to collect data on factors that may possibly relate to or influence herding behavior as the dependent variable. These factors are age, annual income, education level, and population within the city of residence. To add, all these factors are taken as control/secondary independent variables by the authors, but only the data on respondents between the ages of 18-35 are used for further analysis and interpretation to address the research question. The major purpose behind questions five to eight is to collect data on loss aversion as the primary independent variable and herding behavior as the dependent variable. Questions five to eight are either borrowed or inspired from studies conducted by different scholars, such as Kahneman et al., (1991), Kahneman and Tversky (1979), Thaler and Johnson (1990), Thaler and Rabin (2001), and Beckman et al., (2011). Below are the questions included in the questionnaire:
Q1. Your age
a. 18-25 b. 25-35 c. 35-45 d. Above 45
. Q2. Your education levels
a. High school or lower
b. Bachelor’s degree or equivalent c. Master’s degree
20 Q3. Your annual income
a. SEK 0-200,000 b. SEK 200-400,000 c. Above SEK 400,000
Q4. Which option does apply to you?
a. Living in a small city with a population of less than 100 thousand people b. Living in a medium size city with a population of 100 to 500 thousand people c. Living in a big city with a population of 500 thousand people or more
Note regarding questions 6-9
A scale of 1 to 5: 1=strongly disagree, 2=Disagree, 3=Neutral, 4=Agree, 5=strongly agree Q5. I would rather choose the option of "gaining SEK 30,000 for certain" than the option of "an 80 % chance to gain SEK 40,000 and a 20% chance to gain nothing."
(Strongly disagree) 1, 2, 3, 4, 5 (strongly agree)
Q6. I would rather choose the option of an "80% chance to lose SEK 40,000 and a 20% chance to lose nothing" than the option of "losing SEK 30,000 for certain."
(Strongly disagree) 1, 2, 3, 4, 5 (strongly agree)
Q7. There are two new companies on the stock market with essentially the same products and services. You know that company A is more popular among investors than company B. You would also invest in company A rather than investing in company B.
(Strongly disagree) 1, 2, 3, 4, 5 (strongly agree)
Q8. There are concerns about the overall condition of the economy in the following months and most investors are selling their stocks on the stock markets. Considering this, I would also sell whole or part of my stock investments in this situation.
(Strongly disagree) 1, 2, 3, 4, 5 (strongly agree)
4.4 Method of Data Analysis
Regarding the method employed to analyze the collected data in this study, an inferential statistics approach will be taken, meaning using statistical methods to analyze and interpret the primary data from the questionnaire to draw conclusion about the target population. Also, the statistical analysis of the primary data is a multivariable analysis as the collected data is related to six variables of herding behavior, loss aversion, age, education level, annual income, and population of city of residence. It can be stated that an inferential statistics approach of data analysis is
21
suitable for this study as it is often employed to test hypotheses regarding relationships between two or more variables using empirical data (Collis & Hussey, 2014).
More specifically, multiple regression analysis is used as the main method of data analysis in this study. To elaborate, multiple regression analysis is often used as a statistical method of quantitative data analysis if there are more than one independent variable that can be potential predictors of a dependent variable or for them to have causal relationship with the dependent variable (Månsson, 2016; Anderson, Sweeney, Williams, Freeman & Shoesmith, 2014). For this study, a probable causal relationship between loss aversion as the primary independent variable and herding behavior as the dependent variable will be tested. Yet, having loss aversion as the only independent variable may negatively affect the reliability of the findings and conclusions. Hence, respondents’ age, annual income, education level, and the population of the city they currently live in are taken as secondary independent variables that could also have a causal relationship with or influence herding behavior. Consequently, this may contribute to creation of a more realistic or applicable estimated regression model for the sample group.
Following is the estimated multiple regression model that will be used to test hypothesis 1:
𝑦̂ = 𝑏0+ 𝑏1𝑥1+ 𝑏2𝑥2+ 𝑏3𝑥3+ 𝑏4𝑥4+ 𝑏5𝑥5 Where 𝑦 = 𝑖𝑛𝑐𝑟𝑒𝑎𝑠𝑒 𝑖𝑛 ℎ𝑒𝑟𝑑𝑖𝑛𝑔 𝑏𝑒ℎ𝑎𝑣𝑖𝑜𝑟 𝑖𝑛 𝑝𝑒𝑟𝑐𝑒𝑛𝑡𝑎𝑔𝑒 𝑥1 = 𝑖𝑛𝑐𝑟𝑒𝑎𝑠𝑒 𝑖𝑛 𝑙𝑜𝑠𝑠 𝑎𝑣𝑒𝑟𝑠𝑖𝑜𝑛 𝑖𝑛 𝑝𝑒𝑟𝑐𝑒𝑛𝑡𝑎𝑔𝑒 𝑥2= 𝑎𝑔𝑒 𝑖𝑛 𝑝𝑒𝑟𝑐𝑒𝑛𝑡𝑎𝑔𝑒 𝑥3= 𝑎𝑛𝑛𝑢𝑎𝑙 𝑖𝑛𝑐𝑜𝑚𝑒 𝑖𝑛 𝑝𝑒𝑟𝑐𝑒𝑛𝑡𝑎𝑔𝑒 𝑥4= 𝑦𝑒𝑎𝑟𝑠 𝑜𝑓 𝑒𝑑𝑢𝑐𝑎𝑡𝑖𝑜𝑛 𝑖𝑛 𝑝𝑒𝑟𝑐𝑒𝑛𝑡𝑎𝑔𝑒 𝑥5= 𝑝𝑜𝑝𝑢𝑙𝑎𝑡𝑖𝑜𝑛 𝑜𝑓 𝑐𝑖𝑡𝑦 𝑜𝑓 𝑟𝑒𝑠𝑖𝑑𝑒𝑛𝑐𝑒 𝑖𝑛 𝑝𝑒𝑟𝑐𝑒𝑛𝑡𝑎𝑔𝑒
Here, each estimated coefficient (i.e., 𝑏𝑖, 𝑏𝑢𝑡 𝑒𝑥𝑐𝑙𝑢𝑑𝑖𝑛𝑔 𝑏0) for the independent variables
𝑥𝑖 (𝑖 = 1, … , 5) can be interpreted as the estimated linear effect on y (i.e., herding behavior) of a one-unit change in 𝑥𝑖 after removing the estimated linear effects of the other 𝑥𝑗(𝑗 ≠ 𝑖) on both 𝑦 and 𝑥𝑖.
Additionally, a t-test will be used to test hypothesis 1 using 𝑡 = 𝑏𝑖
𝑆𝑏𝑖 that follows a t-distribution
with 𝑛 − 𝑝 − 1 degrees of freedoms. Later, the F-test will be used to test the overall significance of the multiple regression model using 𝐹 =𝑀𝑆𝑅
22
freedoms in the numerator and 𝑛 − 𝑝 − 1 degrees of freedoms in the denominator. Finally, the adjusted coefficient of determination or 𝑎𝑑𝑗𝑅2 = 1 − (1 − 𝑅2)𝑛−𝑝−1𝑛−1 will be used to examine how the coefficient of determination changes as another variable is included to the model. This adjusted coefficient of determination is derived from coefficient of determination or 𝑅2 which is
a measure of how much of the variation in the regression model that can be explained by the chosen independent variables (Månsson, 2016; Anderson et al., 2014). To add, although all the mentioned testing methods can be manually executed against the primary data, IBM SPSS Statistics software will be employed by the authors to process the primary data to both minimize any human error of data processing and address timing limitations.
4.5 Assumptions
While designing the method of data collection and analysis, three major assumptions are undertaken by the authors. These assumptions include a scenario in which respondents to the questionnaire are fully honest while responding to the questionnaire i.e., no hypothetical bias influences the responses. The second assumption being that responses to the questionnaire including hypothetical scenarios accurately reflects respondents’ actions in real life scenarios. In other words, respondents are fully aware of how they would make financial decisions under risk and uncertainty in real life scenarios. Finally, the assumption that respondents would make the same decisions as those included in the hypothetical scenarios in the questionnaire regardless of the real life financial market conditions. In other words, their responses to the questionnaire would still be the same no matter what financial market conditions (e.g., market downturn or boom) they experienced.
23
5. Results and Empirical Findings
_____________________________________________________________________________________
This chapter focuses on providing a purely descriptive presentation of the empirical
results from the conducted questionnaire, while profound analysis and interpretation of
these results and empirical findings are included in the analysis chapter of this paper.
_____________________________________________________________
To offer a more intuitive presentation of empirical findings, the following table (Table 1) includes an overview of raw data that is collected based on responses to the questionnaire.
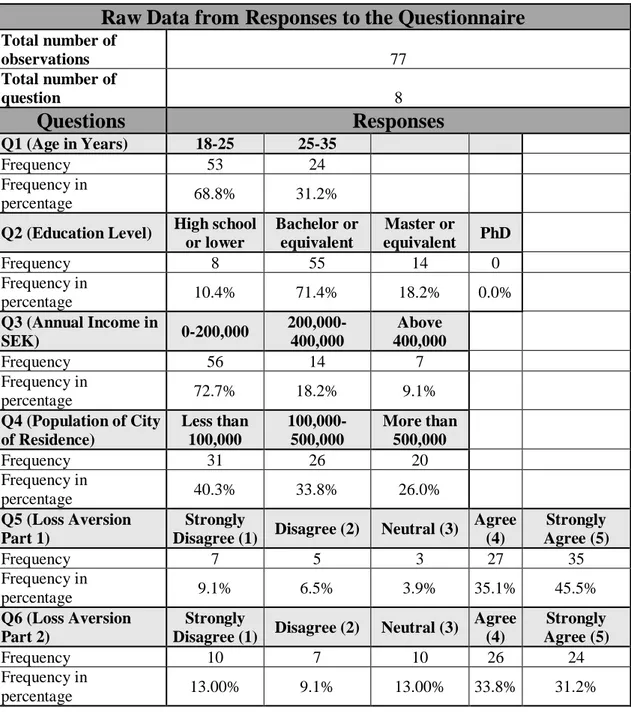
Table 1 Raw Data
Raw Data from Responses to the Questionnaire
Total number of observations 77 Total number of question 8
Questions
Responses
Q1 (Age in Years) 18-25 25-35 Frequency 53 24 Frequency in percentage 68.8% 31.2%Q2 (Education Level) High school or lower Bachelor or equivalent Master or equivalent PhD Frequency 8 55 14 0 Frequency in percentage 10.4% 71.4% 18.2% 0.0% Q3 (Annual Income in SEK) 0-200,000 200,000-400,000 Above 400,000 Frequency 56 14 7 Frequency in percentage 72.7% 18.2% 9.1% Q4 (Population of City of Residence) Less than 100,000 100,000-500,000 More than 500,000 Frequency 31 26 20 Frequency in percentage 40.3% 33.8% 26.0% Q5 (Loss Aversion Part 1) Strongly
Disagree (1) Disagree (2) Neutral (3)
Agree (4) Strongly Agree (5) Frequency 7 5 3 27 35 Frequency in percentage 9.1% 6.5% 3.9% 35.1% 45.5% Q6 (Loss Aversion Part 2) Strongly
Disagree (1) Disagree (2) Neutral (3)
Agree (4) Strongly Agree (5) Frequency 10 7 10 26 24 Frequency in percentage 13.00% 9.1% 13.00% 33.8% 31.2%
24
Q7 (Herding Part 1) Strongly
Disagree (1) Disagree (2) Neutral (3)
Agree (4) Strongly Agree (5) Frequency 8 15 21 22 11 Frequency in percentage 10.4% 19.5% 27.3% 28.6% 14.3%
Q8 (Herding Part 2) Strongly
Disagree (1) Disagree (2) Neutral (3)
Agree (4) Strongly Agree (5) Frequency 9 21 21 20 6 Frequency in percentage 11.7% 27.3% 27.3% 26.0% 7.8%
Referring to the raw data (Table 1), it is observed that 77 young Swedish retail investors, who currently have investments in the stock market, have participated in the study and responded to the online questionnaire. Although all respondents are between the ages of 18 to 35 years old, responses to Q1 indicates that 53 of them are within the age group of 18-25 and 24 are in the age group of 25-35. Regarding to Q2, it is observed that the education level of the respondents is spread among three categories; High School or lower (approximately 12 years), Bachelor or equivalent (approximately 15 years), and Master or equivalent (approximately 17 years). To expand, most of the respondents are either graduated with a bachelor’s degree or are currently conducting their bachelor’s studies with frequency of 55 or 71.4%, Master students or equivalent with a frequency of 14 or 18.2% of the respondents, and High School or lower with a frequency of 8 or 10.4% of the respondents.
Considering responses to Q3, it is observed that the annual income is also spread among three categories with a frequency of 56 or 72.7% of respondents in the first group with an annual income of 200,000 SEK or less, and a frequency of 14 or 18.2% being in the second group with an annual income between 200,000 and 400,000 SEK. Finally, a frequency of 7 or 9.1% of the respondents are in the third group with an annual income above 400,000 SEK. Looking at the responses to Q4, it can be stated that the frequency of responses for population of city of residence are relatively even with a frequency of 31 or 40.3% of respondents living in a city with population less than 100,000, a frequency of 26 or 33.8% living in a city with population of between 100,000 to 500,000, and a frequency of 20 or 26.0% of the respondents living in a city with a population above 500,000 residents.
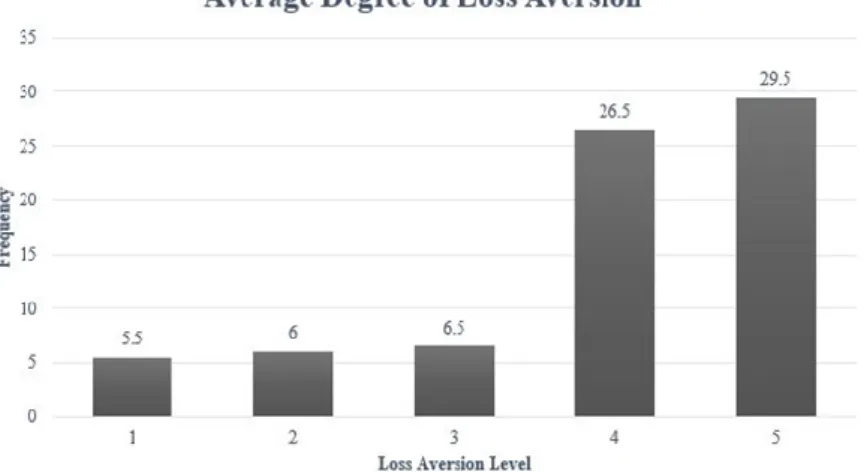
Q5 and Q6 measure respondents’ degree of loss aversion on a scale of 1-5 where 1 is the lowest and 5 is the highest. Considering responses to Q5, they exhibit a high degree of loss aversion among respondents with a frequency of 35 or 45.5% scoring 5’s and a frequency of 27 or 35.1% scoring 4’s. To add, a frequency of 7 or 9.1% and 5 or 6.5% of the respondents scored 1’s and 2’s respectively with a frequency of 3 or 3.9% scoring a neutral score of 3. Responses to Q6 illustrate similar results where a frequency of 26 or 33.8% and a frequency of 24 or 31.2% scored 4’s and
25
5’s respectively with a frequency of 10 or 13.0% and 7 or 9.1% scoring 1’s and 2’s. Finally, a frequency of 10 or 13.0% have the neutral score of 3.
Furthermore, Q7 and Q8 measure respondents’ degree of herding behavior on a scale of 1 to 5 where 1 is the lowest and 5 is the highest. Data from Q7 depicts a frequency of 11 or 14.3% of the respondents scoring 5’s and a frequency of 22 or 28.6% scoring 4’s. A frequency of 21 or 27.3% of respondents answered neutral with a frequency 8 or 10.4% and 15 or 19.5% scored 1’s and 2’s respectively. Finally, data for Q8 display a frequency of 20 or 26.0% of the respondents scoring 4’s and a frequency of 6 or 7.8% scoring 5’s, a frequency of 21 or 27.3% scoring neutral with a frequency of 21 or 27.3% scoring 2’s, and a frequency of 9 or 11.7% of the respondents scoring 1’s.