J
Ö N K Ö P I N GI
N T E R N A T I O N A LB
U S I N E S SS
C H O O LJÖNKÖPING UNIVERSITY
D e t e r m i n a n ts o f L e v e r a g e d
B u y o u ts i n E u r o p e
LBO Financing and Country Legislature
Masters Thesis within Economics Author: Saloni Deva
Tutor: Professor Andreas Stephan
Associate Professor Dorothea Schäfer Jönköping June 2010
Masters Thesis within Economics
Title:
Determinants of Leveraged Buyouts: LBO Financing and CountryLegisla-ture
Authors:
Saloni Deva (871116)Tutors:
Professor Andreas StephanAssociate Professor Dorothea Schäfer
Date:
June 2010Keywords:
Leveraged buyouts, private equity, interest rate, equity market capitalization,legislature
Abstract
The focus of this empirical paper is to outline and evaluate certain determinants of lever-aged buyouts (LBOs) in Europe. The paper begins by providing a detailed description of LBOs, with particular emphasis on the European markets. This allows for the development of the four determinants that are studied in greater detail, specifically interest rate, out-standing stock, anti-director rights, and creditor rights. The conclusions indicate that coun-tries with more outstanding stock have larger LBO markets since equity is more liquid in these countries. Further, the results suggest that long-run interest rate is negatively related to the size of the LBO market. The paper goes on to test whether anti-director rights and creditor rights, as developed by La Porta et al. (1998) are related to the size of the LBO markets, but no evidence is found to support this notion. It is thus concluded that deter-minants focused on financing the buyouts play the most significant role in European LBO transactions.
Acknowledgements
I would like to thank Professor Andreas Stephan and Associate Professor Dorothea Schäfer for their guidance and essential observations during the process of forming this thesis. I am also very grateful for the support received from DIW Berlin in allowing me to access vital resources used in this paper. Finally, I appreciate the constructive comments received from Jan Weiss. I am also grateful to my family and close friends for their support and patience these last few months.
Table of Contents
1
Introduction ... 1
1.1 Disposition ...2
2
Background ... 3
2.1 A Typical LBO Deal ...4
2.2 The Organizational Structure of a LBO...5
2.3 Financing LBOs ...7
2.4 Cross-Country Differences in Private Equity ...9
2.5 Recent Buyouts ...11
3
Determinants of LBOs ... 12
3.1 Interest Rates ...12
3.2 Liquidity of Stock Markets...13
3.3 Country Legislature ...15
4
Empirical Framework... 17
4.1 Method ...17
4.2 Data Sources and Definitions ...19
4.3 Empirical Tests ...20 4.3.1 Data Set I ...20 4.3.1.1 Initial Tests... 20 4.3.1.2 Final Tests ... 20 4.3.2 Data Set II ...22 4.3.2.1 Initial Tests... 22 4.3.2.2 Final Tests ... 23
4.4 Summary and Discussion of Results ...25
5
Conclusion ... 26
5.1 Suggestions for further research ...26
5.1.1 Commercial Bank Lending ...27
5.1.2 Collateralized Loan Obligations ...27
References... 29
Appendix... 32
A1 Definitions...32
A1.1 The Holding Structure...32
A1.2 The Financial Structure ...32
A2 Descriptive Statistics ...34
A2.1 Data Set I ...34
A2.2 Data Set II ...34
A3
Empirical Results ... 35
A3.1 Results for Regression 1: Data Set I ...35
A3.2 Results for regression 2: Data Set I...37
A3.3 Results for regression 3: Data Set 2...38
A3.4 Results for regression 4: Data Set 2...40
Figures
Figure 1 Organizational structure of a common LBO deal ...5
Figure 2 Total value of buyouts in the 15 European...9
Figure 3 Ratio of the value of buyouts...10
Figure 4 Annual long-term interest rate...12
Figure 5 Annual outstanding stock relative to GDP...14
Figure 6 Scatterplot for the Pooled OLS regression...35
Figure 7 Histogram representing Buyouts/GDP ...36
Figure 8 Histogram representing Log(Buyouts)...36
Figure 9 Scatter plot for the pooled OLS regression ...37
Figure 10 Two-way scatter plot for the random effects model...37
Figure 11 Scatterplot for the Pooled OLS regression...38
Figure 12 Histogram representing Buyouts/GDP ...39
Figure 13 Histogram representing Log(Buyouts)...39
Figure 14 Scatter plot for the Pooled OLS regression...40
Figure 15 Two-way scatter representing Log(Buyouts)...40
Figure 16 Two-way scatter representing Log(Buyouts)...41
Tables
Table 1 Percent of debt provided by various financiers...6
Table 2 T-account representing the assets and liabilities of a target firm...7
Table 3 Percent of debt provided by various financiers...8
Table 4 Segregation of countries in study according to legal forms ...15
Table 5 Anti-director rights and creditor rights...16
Table 6 Data sources and definitions ...19
Table 7 Pooled OLS regression (Data Set I) ...20
Table 8 Robust random effects model (Data Set I) ...21
Table 9 Pooled OLS regression (Data Set II) ...23
Table 10 Robust random effects model with dependent (Data Set II) ...24
Table 11 Descriptive statistics for Data Set I...34
Table 12 Descriptive statistics for Data Set II...34
Table 13 Pooled OLS regression (Data Set I) ...35
Table 14 Pooled OLS regression (Data Set II) ...38
1 Introduction
The European buyouts market grew from approximately 10 billion Euros in 1993 to 176.9 billion Euros in 2007 (CMBOR, 2008). This quick increase in leveraged buyouts (LBOs) has brought private equity activity, and particularly LBOs, into the spotlight.
Although there are numerous definitions of leveraged buyouts, this thesis focuses on a LBO being a purchase of the controlling assets of an existing publicly listed or private company by an external investor (often a private equity firm) in which the acquisition is fi-nanced using a combination of debt (usually provided by a bank) and equity or shareholder loans (typically provided by the Private Equity firm or in certain cases by the target’s man-agement).
It has become evident that certain variations between the countries have a vital impact on the size of the LBO market. This can be seen in the fact that a majority of the large deals took place in Germany and UK in 2007, with the remainder of Europe showing signs of increasing LBO activity since the 1980s. This notion gives rise to a fundamental question that is particularly interesting in times where the market for LBOs in Europe is clearly ex-panding: what determines the size of LBO markets?
There are numerous underlying factors that could influence whether the LBO activity is greater in certain countries. However, it is clear that the method of financing deals as risky as LBOs is especially important. Since an average LBO deal is financed using a share of eq-uity and a substantially larger share of debt, it should be the case that interest rates and the availability of equity should have a significant impact on the size of the LBO market in any country.
As discussed in detail by Axelson et al. (2008) and Ljungkvist et al. (2007), interest rate is a fundamental determinant and there is evidence to show that the higher the interest rates, the lower the private equity activity. Ljungkvist et al. (2007) conclude their empirical model by stating that “fund managers speed up their investments as investment opportunities im-prove, competition eases, and the cost of credit falls.” This suggests that if a country has low interest rates, private equity firms would be more likely to take larger loans in order to settle LBO deals relative to countries with higher interest rates.
Equity market capitalization, which is a proxy for the liquidity of the stock market, is an-other defining factor, and as argued by Schertler (2003), the private equity market should be larger in countries with liquid and deep stock markets. Although Schertler (2003) per-forms the study with focus on venture capital, the implication is that private equity activity, and thus the LBO market, would be larger in countries where the stock markets are more liquid. This paper, however, focuses on the concept that the greater the outstanding stock in a country (i.e., the larger the secondary stock market), the larger the LBO market since equity is then more liquid.
This paper is extends the study by focusing on certain legal aspects inspired by La Porta (1998) that may have an impact on the size of the LBO markets in individual countries. Specifically, anti-director (i.e. shareholder) rights and creditor rights will be evaluated in re-lation to the value of buyouts in a selection of European countries. La Porta et al. (1998) specifies the differences between Common and Civil Law, which influence the creditors and shareholders in individual countries. This paper hypothesizes that cross-country varia-tions between creditor and shareholder rights should in turn have an impact on the size of the LBO markets. This is because credit should be more available in countries where
credi-tors are better protected and equity invescredi-tors should have a greater incentive to acquire more shares in countries where shareholders are well protected.
Extensive research has been focused on the determinants of venture capital (a form of pri-vate equity activity), such as Black and Gilson (1998) and Jeng and Wells (2000). However, very little research focuses distinctly on outlining and evaluating the determinants of lever-aged buyouts. This is particularly true in the case of whether legal aspects have a distinct impact on the size of the LBO markets, which may affect the European economies. As a result, this paper aims at shedding light on some of the macro-economic and legal determi-nants of LBOs.
The purpose of this thesis is, thus, to outline the four determinants, specifically interest rates, outstanding stock, anti-director rights and creditor rights, and evaluate whether cross-country variations in these determinants impacts the value of LBOs.
This empirical study is divided into two data sets due to the availability of data. Data Set I takes into account a selection of 15 European countries1 spanning over 12 years (1997 to 2008) when testing the determinants short-term and long-term interest rate, and anti-director along with creditor rights. Data Set II, on the other hand, is created because data for the variable outstanding stock is available for only 10 of the 15 countries in this study2.
1.1 Disposition
Prior to evaluating the determinants of LBOs in Europe, it is imperative to gain a theoreti-cal description concerning LBOs, which will be provided in section 2. This will include a brief discussion of the most common structure behind an LBO transaction, with a focus on the financing of LBOs. Cross-country variations in private equity along with a presenta-tion of some recent LBO deals will follow.
Section 3 describes the determinants used in this study, specifically interest rate and out-standing stock, along with the legal determinants, anti-director and creditor rights.
The empirical framework, which takes into account the method used in this paper, the em-ployed descriptive statistics, and the empirical tests along with the obtained results, is de-scribed extensively in section 4. This is followed by a brief analysis of the results.
Section 5 concludes this paper and presents suggestions for future studies in this field of study.
1 The countries included in Data Set I are: Austria, Belgium, Denmark, Finland, France, Germany, Ireland,
It-aly, Netherlands, Norway, Portugal, Spain, Sweden, Switzerland, and the United Kingdom.
2 The countries included in Data Set II are: Austria, Belgium, Finland, France, Germany, Ireland, Italy,
2 Background
Companies can require external financing at numerous phases during their lifecycles. For instance, a newly established company tends to have negative cash flows and low turnover rates, and can thus often use what is called seed money, i.e. money that will be used in the initial phases to establish the company properly. Banks are often unwilling to finance such projects due to the high risks involved, thus such firms turn to private equity investors. In opposition to banks, a private equity investor may focus on the extensive growth opportu-nities a new company has rather than on the risk involved. This form of private equity in-vestment is called venture capital or seed capital, with venture capitalists specializing in ana-lyzing the prospects of new companies and providing them with start-up money.
Similarly, a company may require external financing in its expansion phase, where signifi-cant growth prospects can be seen but cash flows are still debilitating. The private equity investment is in this case called expansion capital. The reason to turn to a private equity in-vestor rather than lending from a bank is because the private equity inin-vestors can often provide expertise and experience along with the financial aid, which can benefit the target company greatly.
Leveraged buyouts (LBOs), however, are most commonly used to target mature, yet ineffi-cient companies. These companies tend to have high cash flows and high turnover rates, but suffer from a lack of investment opportunities and complex organizational structures. The inefficiency results from excessive spending by the management (Jensen, 1986) and unprofitable business decisions that can cause the company’s cash flows and turnover to suffer drastically. The organizational structure underlying a common LBO transaction along with a detailed overview of the workings surrounding an LBO will be discussed in section 2.2.
A leveraged buyout represents the acquisition of a public or private company, where the takeover is financed using a small amount of equity and a large share of debt. According to Investopedia.com, “there is usually a ratio of 90% debt to 10% equity” when financing a LBO. The debt consists of primarily bank loans and loans from other financial institutions along with some high yield bonds. The acquired company’s assets act as collateral for the debt with principal obligations; the debt is met through the company’s cash flows. Due to the acquired company being highly leveraged, the ideal LBO target must have a strong bal-ance sheet, low debt levels, and an adequate and stable cash flow.
Typically, LBOs are “led by specialist financiers whose executives take direct equity hold-ings in the acquired corporation” (Ashurst, 2006). The companies’ managers play a mar-ginal role in organizing the transaction, usually have a small equity holding, and may in fact be replaced once the transaction has taken place. However, in the case where the managers play a significant role in the transaction by providing a significant portion of the equity, the buyout is termed leveraged management buyout (LMBO). In the case where a private eq-uity firm initiates and leads the transaction, the deal is called an investor buyout (IBO). Usually, this implies that a smaller amount of leverage is used. The initial buyout transac-tion is sometimes used as a platform for further acquisitransac-tions (a buy-and-build or leveraged-build-up strategy). Deals of this nature are usually aimed at consolidating fragmented indus-tries.
Since the target company’s financial strengths and assets are used as the primarily form of collateral in the transaction in the case of hostile takeovers, LBO transactions are com-monly viewed as aggressive. However, regardless of the initial steps of the transaction, the
concept behind an LBO transaction is to improve the target’s long-term corporate effi-ciency, often through restructuring the firm. This can reduce agency costs, a concept dis-cussed extensively in Jensen’s book titled “Foundations of Organizational Strategy” (1998), by aligning the interests of the shareholders and managers due to the increase in financial leverage imposing a discipline in the target firm.
2.1 A Typical LBO Deal
There are numerous issues that arise in LBO transactions depending on, for instance, the country’s legislature (such as its taxation laws), the capital structure, and the characteristics of the target. However, most LBO deals do share some similar underlying concepts. Firstly, as mentioned previously, all LBOs make use of financial leverage (debt), which is provided by financial organizations (most frequently banks). However, equity is employed as well, usually provided by the Private Equity investor or management, depending on the type of buyout. In order to secure the debt used in financing the LBO, the target’s own as-sets act as collateral. The cash flows generated by the target are used to further pay-off the debt, implying that the target in fact helps pay back the incurred debt from when it was ac-quired.
If the LBO transaction is successful, the equity holders (Private Equity investors or the tar-get’s management) receive very high returns from any capital gains. The debt holders, on the other hand, gain only fixed returns from the investment. Thus, the Private Equity in-vestors are often interested in highly leveraged companies that can generate large equity deals.
A Private Equity firm is usually interested in realizing a return on the LBO within 3 to 5 years, and has thus typically planned a profitable exit strategy. There are three frequently used exit strategies as described by the Financial Services Authority (2006), specifically:
• A sale to a corporate body that wishes to expand or diversify itself using an acquisi-tion
• Initial Public Offering (IPO), which allows the target to float on the stock market • A secondary sale to another private equity fund
LBOs are popular with private equity firms since a large target can be acquired using a rela-tively small amount of equity. However, this also implies that leveraged buyouts can be highly risky investments in that they require a substantial portion of debt in the financing. There are numerous situations in which LBOs are used. A common reason is to allow a company to go private. Further, companies that are suffering from financial stress may benefit from a buyout resulting in recapitalization (or reorganization). Private Equity inves-tors are also known to purchase family owned businesses in situations where the family is not coping or is unable to find a suitable successor.
2.2 The Organizational Structure of a LBO
The following diagram explains the organizational structure surrounding a typical leveraged buyout. For the specific definitions related to each of this diagram, please check the Ap-pendix (section A1).
Figure 1 Organizational structure of a common LBO deal
Transfer of funds Transfer of funds Aquisition Purchase price Disposal of target Vendor’s note
2nd Lien Debt, Mez-zanine financing (incl.
HY-bonds) Term Loans A,B,C Decreasing level of securitization Supply of Equity
The Players The Holding Structure The Financial Structure
Holding Company Debt Company Operating Company Target Vendor Subordinated Debt Provider Senior Debt Provider Private Equity Investor Management Vendor
Source: Deutsche Bundesbank (2007), Financial Services Authority (2006), own depiction
The structure of a typical LBO deal is such that a selection of players act as the suppliers of the equity share and are in charge of then seeing the deal through. There can be a number of players involved, however, it is the private equity investor that is most relevant for this study.
Private equity investors play a critical role in a typical LBO deal since they not only provide a majority of the equity used in acquiring the target, but also organize the transaction. The investors develop an efficient value creation plan using their experience and knowledge of the industry and find an optimal capital structure to ensure that the deal is financed prop-erly. The investors usually “raise their capital from investors such as funds of funds, pen-sion funds, investment funds, endowments and high net worth individuals” (Financial Ser-vices Authority, 2006).
In the case of a LMBO, the managers play a crucial role in the buyout since they provide a majority of the equity involved in the transaction. The agency conflict described by Jensen (1986) that reduces the firm’s value can in fact be decreased or even completely eliminated if the managers become the owners. This is because the managers, rather than focusing on their own desires, have a greater incentive to focus their attention of creating value within the target company.
The vendor initiates the buyout. It is the vendor’s job to receive the purchase price and dispose of the target company. He may even partake in the transaction once the deal is closed. A vendor’s note is a debt instrument where the seller not only sells the asset, but also provides part of its financing (which is common in LBOs). The primary amount of debt used to finance the transaction, which exceeds the equity substantially, comes from the various subordinated and senior debt providers. The capital raised is injected into each company depending on the seniority, i.e. the vendor’s share is injected into the holding company, the subordinated debt provider injects its capital share into the debt company, and the most senior debt providers inject their share into the operating company (also known as NewCo). This allows for the seniority to be decided properly using structural subordination and the capital treatment for each component/tranche is thus efficient. The holding structure involved in an LBO transaction is developed by the various debt and equity holders in order to have a secure place to inject the individual finances used in the buyout. “Typically, capital is injected into each of the companies in exchange for securities with guarantees that are increasingly subordinated the further removed the issuing com-pany is from the operating comcom-pany. The use of multiple structures means that, at times of company difficulty, whilst the operating company may appear financially sound, its need to upstream funds to meet interest payments on debt held in holding companies may mean that the whole group is not. Commitments at operating company level are likely to be met before any up streaming of capital, so the holding company/debt companies can become bankrupt while the operating company remains solvent” (Financial Services Authority, 2006).
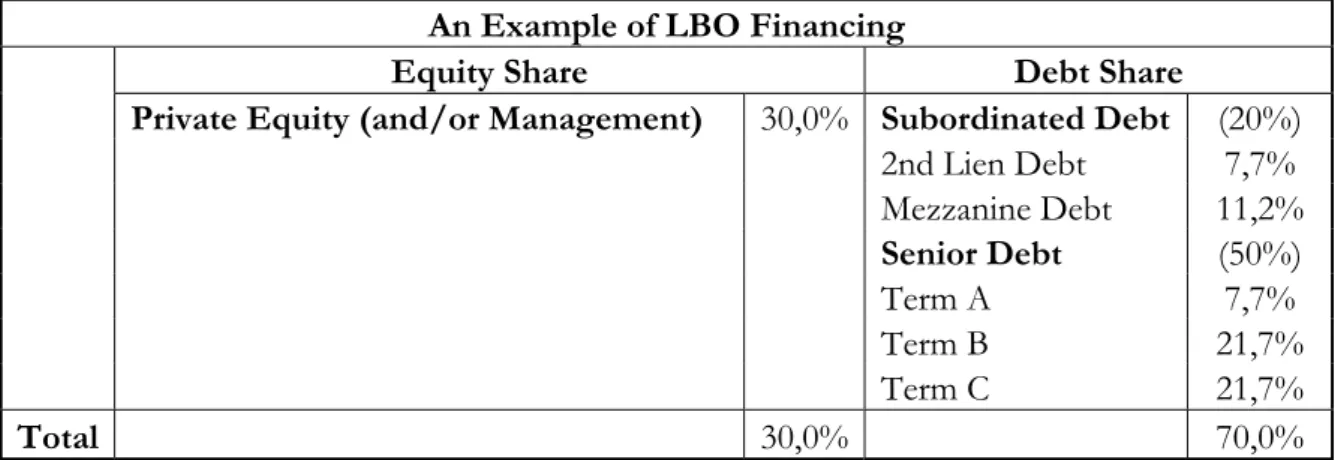
The following table represents an example of the financing of a typical LBO deal inspired by Deutsche Bank (April, 2007), assuming an equity to leverage ratio of 30 percent to 70 percent.
Table 1 Percent of debt provided by various financiers
An Example of LBO Financing
Equity Share Debt Share
Private Equity (and/or Management) 30,0% Subordinated Debt (20%)
2nd Lien Debt 7,7% Mezzanine Debt 11,2% Senior Debt (50%) Term A 7,7% Term B 21,7% Term C 21,7% Total 30,0% 70,0%
As Table 1 shows, a typical LBO deal is financed using a smaller amount of equity to debt. The debt is composed of various forms and is made up of subordinated debt and senior debt, as mentioned previously. The funds that are in the operating company, consisting of 30% equity and 70% debt, are used to payout the equity and debt holders of the target company as the target is acquired. Thus, the target received a new structure, i.e. the same the structure of the operating company – 30% equity and 70% debt. The following T-account (Table 2) describes the assets and liabilities of the target firms once the acquisition has taken place.
Table 2 T-account representing the assets and liabilities of a target firm
Assets Liabilities
Debt: 70%
Equity: 30%
Source: Own representation
2.3 Financing
LBOs
According to Kaplan and Stein (1993), banks provided over 70 percent of total buyout debt between 1982 and 1984 in the USA. The European buyout market has only developed in recent years however, but banks have played a significant role in this development be-cause “LBO transactions are frequently financed with high debt” (Jensen, 1986), which is most frequently supplied by banks and other financial institutions.
However, it is not only banks that provide the debt needed to finance a LBO. A typical buyout transaction requires syndication, implying that a selection of financiers provide a certain amount of debt together. Syndication is often employed since it reduces the risk of financing the project. In the case of buyouts, the Private Equity investor selects a bank that is willing to provide a large portion of the financing and allows it to be the primary arranger of the transaction. Particularly in large deals, the credit in the project is distributed to the various members of the syndicate with only a small remainder being represented in the bal-ance sheets of the bank. In fact, according to a study by the Financial Services Authority (2006), not more than 19.4 percent of the total exposure remains on the banks’ balance sheet.
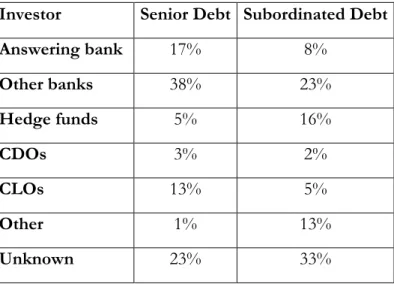
The following table describes the particular amount of debt provided by various entities:
Table 3 Percent of debt provided by various financiers
Investor Senior Debt Subordinated Debt
Answering bank 17% 8% Other banks 38% 23% Hedge funds 5% 16% CDOs 3% 2% CLOs 13% 5% Other 1% 13% Unknown 23% 33%
Source: Deutsche Bundesbank (2007)
As can be seen is Table 3, a total of 55 percent of the senior debt is provided by banks (both the answering banks and others involved). Apart from unknown sources, Collateral-ized Loan Obligations (CLOs) are the second largest source of debt with 13 percent. Banks account for 31 percent of the subordinated debt and CLOs for only 5 percent, but hedge funds become particularly important in this case, providing 16 percent of the total subordi-nated debt.
It is thus evident that banks in fact play a very significant role in the buyout process and provide the largest share of debt. However, CLOs are also very important, and although beyond the scope of this study, a brief description of their impact will be the focus of sec-tion 5.1.2.
2.4 Cross-Country Differences in Private Equity
Although private equity only emerged in Europe in the 1980s, today it has a key impact on the European economies. In 2005, new transactions in Europe equaled €120 billion (USD 140 billion, compared to USD 200 billion in the US). The transactions were concentrated to primarily UK, Germany, and France (Acharya et al., 2007).
Figure 2 represents the total value of buyouts in the 15 European countries included in this study between 1997 and 2008.
Figure 2 Total value of buyouts in the 15 European
Source: CMBOR, own depiction
As can be seen, there is a clear increase in the value of buyouts between 1997 and 2000, after which a fall is seen in 2001. This is most likely caused by the World Economic Crisis of 2001. Signs of the economy improving can be seen 2002-2003 onwards, with the value of the buyouts increasing. There is a clear boom up until 2007, after which a drastic fall in the buyouts market is seen. This most probably results from the Financial Crisis of 2008. The total buyout volume for 2008 is 0,62 percent of the total GDP for all 15 European countries in this study, where as in 2007 when the buyout market was peaking, the total buyout volume accounted for 1,59 percent of total GDP.
A common indicator of the maturity of the buyout market relative to country is to measure the ratios of the value of buyouts to the countries’ GDP. Due to the economic crises in 2001 and 2008, each country experienced a significant fall in the value of LBOs. For this reason, the average of the years 1997 to 2002 and the years 2003 to 2008 has been taken to give a more representative perspective of the ratio of the value of buyouts to GDP.
Figure 3 Ratio of the value of buyouts3
Source: CMBOR, OECD Statistics, own depiction
As is evident from Figure 3, all countries besides Ireland and Switzerland experience an in-crease in the average value of LBOs with respect to GDP between 1997-2002 and 2003-2008. The most developed buyout markets in 2002-2008 (above 1,5 percent) can be seen in Denmark, the Netherlands, Sweden, and the UK. This is followed by Finland, France, and Germany, with over approximately 0,7 percent. The least developed buyout markets can be seen in Austria, Portugal, and Spain, where the buyouts account for under 0,5 percent of GDP.
3 Country abbreviations as presented in Figure 3: Austria (AT), Belgium (BE), Denmark (DK), Finland (FI),
France (FR), Germany (DE), Ireland (IE), Italy (IT), Netherlands (NL), Norway (NO), Portugal (PT), Spain (ES), Sweden (SE), Switzerland (CH), United Kingdom (UK)
2.5 Recent
Buyouts
Some of the largest buyouts in history have taken place between 2005 and 2007, with 2006 being the “biggest year ever for global mergers and acquisitions, with deal volume soaring to $3.4 trillion” (Forbes, Liz Moyer, 2006-11-17). This section focuses on giving some ex-amples of recent buyouts throughout Europe.
A particularly large LBO deal in Germany took place in 2006, with the private equity units of Kohlberg Kravis Roberts & Co. (KKR) and Goldman Sachs Group Inc. buying the Kion forklift division of Linde Group. The price was 4 billion Euros (USD 5.1 billion), of which 400 million Euros was included in pension commitments, lease obligations, and oth-er liabilities (The Financial Express, 2006-11-07). The company’s market value was at 12.1 billion Euros, since its stock had gained 23 percent by November, 2006. Prior to this, the top deal in Germany had been the July, 2006 purchase of a 2.7 billion Euro stake in Deutsche Telekom AG by Blockstone Group LP.
Ford purchased the Swedish automobile manufacturer, Volvo, in 1999. However, the pri-vate-equity backed car company, Zhejiang Geely Holding (China), has acquired Volvo for USD 1.8 billion, less than a third of the amount paid by Ford. The deal is expected to be completed by the third quarter of 2010. Backed by the private equity division of Goldman Sachs, GS Capital Partners, Geely has acquired a 100 percent of Volvo Car Corporations along with its intellectual property and other assets, according to AltAssets Ltd. (2010-04-01). GS Capital Partners have a USD 244.76 million stake in Geely automobile holdings, which represents 15.1 percent of the issued share capital. Volvo will, however, be run by its management and its headquarters will remain in Sweden.
According to BBC News (2007-01-29), 2006 was an especially great year for private equity firms in the UK, with a 2.6 billion Euro acquisition of Bird Eye and a 2.3 billion Euro takeover of Jaffa Cake-maker United Biscuits. Unilever sold Bird Eye to Permira, a large private equity firm, for 1.7 billion Euros. The business also includes Findus and Iglo, two important brands in the European frozen foods market (BBC News, 2006-08-26). Jaffa Cake-maker United Biscuits was sold in a 1.8 billion Euro deal to private equity companies The Blackstone Group and PAI Partners (The Independent, 2006-10-26).
3
Determinants of LBOs
3.1 Interest
Rates
As discussed in section 2.3, a leveraged buyout is financed largely by bank debt. Kaplan and Strömberg (2008) suggest that there are recurring boom and bust cycles evident in private equity activity. Literature finds that private equity activity (and thus these cycles) are af-fected by the availability of debt financing, which is driven to some extent by interest rates. Axelson et al. (2008) find that the leverage in LBOs decreases as interest rates rise. Simi-larly, Ljungqvist et al. (2007) conclude that when interest rates are low, private equity firms seem to accelerate their investments. Interest rate is particularly important for this study since it is the primary way for lenders to control for risk, i.e. it is assumed that lenders will charge higher interest rates for riskier projects.
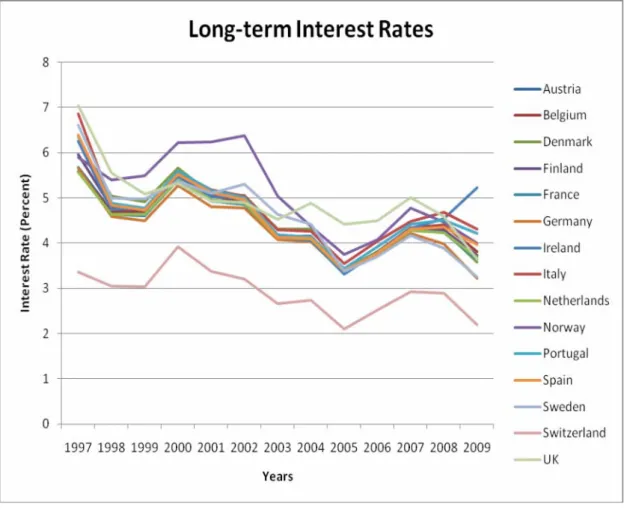
Data for both types of interest rates was gained from OECD Stat. Both short-term and long-term interest rates will be tested in the empirical section, however, it is long-term in-terest rate that is vital to this paper. Thus, each country’s yearly long-term inin-terest rate is plotted in Figure 4.
Figure 4 Annual long-term interest rate
The long-term interest rate in Europe follows a decreasing trend for a majority of the rep-resented countries. Exceptions include Switzerland which has an exceptionally low term interest rate, Norway which has a higher rate between 1999 and 2003, the Irish long-term interest rate which experiences an increases rather than decreases in 2008, and finally the UK has a higher rate between 2004 and 2007. The notion is that a lower interest rate should have a positive impact on leveraged buyouts, since Private Equity firms should have a greater incentive to take larger loans in countries with lower interest rates.
3.2 Liquidity of Stock Markets
Rather than increasing debt, companies have the option to offer share of ownership, or eq-uity, to those willing to supply capital. The equity investors, in exchange for the capital, have the right to an unspecified share of the company’s profit in the future. In order to di-minish the risk of no return on their investment, the equity investors receive certain rights to oversee how the company is managed. Stocks represent the shares in the company’s fu-ture and the equity investor’s right to oversee the company’s management (Siegel and Yacht, “Personal Finance”). Thus, the original owners of the company tend to choose eq-uity investors who share similar ideals and visions for the company concerned.
This process of issuing more equity (or stock) can continue during the company’s expan-sion phases. In some cases, the company may be interesting in finding an investor, like a Private Equity firm, that may be interested in providing the company with capital and thus facilitate growth prior to the initial public offering of shares (IPO). The IPO is the point when the first issuance of stock for trade in the public market and it is at the point when the IPO occurs that the company is said to go public. The strategy of the Private Equity investor is often to buy a large stake in the company while it is still private and realize a large gain when the company goes public.
A company chooses to go public in effect makes the decision to raise capital by issuing eq-uity shares in the public market. Public companies have an obligation to provide informa-tion like regular financial reports in order for the governments to be able to regulate them correctly. In order to raise more equity capital, the public companies must sell more stocks to the market. A company’s board of directors chooses how many shares it wishes to issue; issuing more shares implies opening up the company to more owners.
The IPO represents the primary market, which is where the first shares are issued. Once the company is publicly traded, however, the stocks can change owners, i.e. the owners of the shares can sell stocks in order to realize proceedings. This is the secondary market, which is what most people consider the stock market, i.e. the market where outstanding shares are traded. Outstanding stock refers to the total amount of stock/shares held by in-vestors.
It is the existence of the secondary market that makes stock a liquid/tradable asset, thus reducing the risk for both the issuing company and the equity investors. The investors give up the possibility to use their capital in order to gain from the company’s future profit, with the risk of receiving no returns on the capital or insufficient returns to cover the opportu-nity cost of sacrificing the capital. The secondary market reduces the risk to the shareholder (investor) since the investor has the possibility to sell the stock and recover at least some share of the invested capital.
The secondary market also decreases the cost of equity capital experienced by the com-pany. The company issuing stock is obliged the pay the investor for taking over part of the
risk. The lower the risk (resulting from the liquidity of the secondary market), the lower the costs to the company.
Black and Gilson (1998) and Schertler (2003) find that private equity capital flourishes in countries with liquid and deep stock markets. Schertler (2003) uses equity market capitaliza-tion as a proxy for the liquidity of the stock market. Equity market capitalizacapitaliza-tion is “a measure of the total market value of an equity market” according to Investopedia.com, i.e. the aggregate value of the equity market. It is calculated by adding each stock on the equity market in order to gain the capitalization of the entire market. It is a measure that is used to compare the increase or decrease in the size of the whole market. Equity market capitaliza-tion can be used to compare the value of the equity (stock) market to other segments and investment vehicles in the market (such as the value of the real estate market).
This paper uses outstanding stock as a proxy for the liquidity of the stock market. It is as-sumed that the greater the outstanding stock in a country, the larger the buyouts market, because equity is then more readily available.
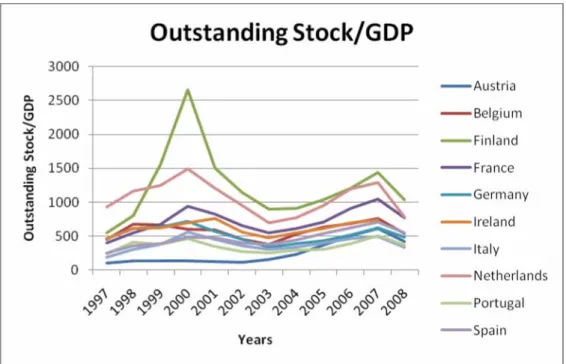
Figure 5 represents the outstanding stock relative to GDP for each of the countries in-cluded in this study for the years 1997 to 2008, thus making the variable comparable be-tween the 10 countries.
Figure 5 Annual outstanding stock relative to GDP
Source: European Central Bank, own depiction
As Figure 5 shows, the trend demonstrated by outstanding stock relative to GDP has been similar in a majority of the included countries. There was an increase between 1997 and 2001, after which a fall can be seen up till 2003. Then a clear rise is seen, which continues up until 2007. 2008 experiences a rather sharp decline. Exceptions to the common trend are Switzerland, which has a somewhat high outstanding stock to GDP ratio during all the
recorded years, and Finland, which experiences a significant peak in 2000, but returns to a somewhat higher than average level in 2001.
3.3 Country
Legislature
Commercial laws are derived from predominantly two traditions: Common Law (English origin) and Civil Law (Roman origin). The three major families within Civil Law that mod-ern commercial laws originate from are French, German, and Scandinavian. The French and German civil traditions along with the Common Law traditions have gained popularity through “conquest, imperialism, outright borrowing, and more subtle imitation” (La Porta et. al, 1998). This implies that the laws reflect both the influence of their family and the re-visions particular to each individual country. Firstly, Table 4 describes the segregation by country within these four legal forms.
Table 4 Segregation of countries in study according to legal forms
Civil Law Common Law
French Civil Law German Civil Law Scandinavian Law
Belgium (BE) Austria (AT) Denmark (DK) Ireland (IE) France (FR) Germany (DE) Finland (FI) United Kingdom (UK)
Italy (IT) Switzerland (CH) Norway (NO)
Netherlands (NE) Sweden (SE)
Portugal (PT) Spain (ES)
Source: La Porta et al., 1998, own segregation
The two primary variables used are anti-director (shareholder) rights and creditor rights, as inspired by La Porta et al. (1998). The authors have developed a point system where by which a point is given for each aspect that gives the shareholders or creditors higher rights in a country. Anti-director rights alone comprise of the following six points:
• The shareholders are allowed to mail their proxy vote in case they cannot attend the meeting physically
• There is no requirement for the shareholders to deposit their shares prior to the General Shareholder’s Meeting
• Cumulative voting or proportional representation of minorities is allowed in the board of directors
• An oppressed minorities mechanism is in place
• The minimum percentage of share capital required for shareholders to call an Ex-traordinary Shareholder’s Meeting (ESM) is 10% or less.
• Only a shareholder’s vote can wave preemptive rights of the shareholder
Shareholders exercise their power by voting for directors and on corporate issues, for which reason a lot of importance is given to the ways in which shareholders can vote in each country. The anti-director rights “measure how strongly the legal system favors mi-nority shareholders against managers or dominant shareholders in the corporate decision making process, including the voting process” (La Porta, et al., 1998).
The creditor rights index comprises of the following four aspects:
• Certain restrictions are imposed when filing for reorganization (such as creditor’s consent or minimum dividends)
• Secured creditors have the right to gain position of their security after the approval of the reorganization petition (no automatic stay)
• Secured creditors are ranked highest in the distribution of proceeds that comes from the disposition of assets of a bankrupt firm
• The debtor does not retain the administration of its property after the resolution of the reorganization
Table 5 summarizes the results found by La Porta et al. (1998).
Table 5 Anti-director rights and creditor rights
Civil Law Common Law
French
Civ-il Law Civil Law German Scandinavian Law
Anti-Director
Rights 2,33 2,33 3 4
Creditor Rights 1,58 2,33 2 3,11
Source: La Porta et al., 1998
The concept behind the empirical study by La Porta et al. (1998) is to evaluate how laws protecting investors differs, how much the quality of law enforcement varies in a sample of 49 countries, and whether these variations have a significant impact on corporate owner-ship patterns worldwide. It is emphasized that that the legal factors governing a country al-so have an impact on economic factors.
It is clear from Table 5 that the French and German Civil Law countries have the lowest anti-creditor rights, which implies that on average, these countries are least concerned with protecting shareholders. Common Law countries on the other hand focus intensely on pro-tecting shareholders, with Scandinavia ranking in between. Similarly French Civil Law countries put the least emphasis on creditor rights as well, with Scandinavia following closely behind. It is seen that Germany Civil Law and Common Law countries that are the most protective of their creditors.
Higher creditor rights imply that creditors have a greater incentive to finance buyouts since their risk is lowered due to the higher legal protection. Similarly, if shareholder rights (i.e. anti-director rights) are high, private equity have a greater incentive to gain a significant portion of shares, thus becoming the controlling shareholders of the target company. It can thus be hypothesized that Common Law countries should have the largest buyout markets since both shareholder and creditor rights are highest. In relative terms, French Civil Law countries should have the smallest LBO markets due to the creditor rights being lowest and anti-director rights being quite low as well. German Civil Law and Scandinavian Law countries should fall in between the two extremes.
4 Empirical
Framework
4.1 Method
This paper uses panel data in evaluating the determinants of LBOs, which refers to “the pooling of observations on a cross-section of households, countries, firms, etc. over several time periods” (Baltagi, 2008). The notion in this paper is to focus on a number of Euro-pean countries and thus form a macro panel. Since the sample of countries and the time span in this study is quite small, combining cross-sectional and time series data will result in a larger dataset, thereby providing more observations.
Panel data regression varies quite significantly from a regular time-series regression in that it has a double subscript to its variables (Baltagi, 2008).
yit = α + X’itβ + uit
where i (i = 1, … , N) represents the cross-sectional dimension and t (t = 1, … , T) repre-sents the time-series dimension; yit is the dependent variable, α is the scalar, β represents K × 1, and Xit is the itth observation on K explanatory variables. The error component tends to take the following form
uit = µi + vit
where µi denotes the unobservable individual specific time-specific effects not represented in the regression and is time-invariant; vit denotes the remaining disturbance, which is time-variant and can be considered to be the usual disturbance in the regression.
The fixed effects model is initially applied to both data sets since this study focuses on eva-luating the impact of the determinants of this specific set of N countries. In this case, the inference is conditional on this set of N countries observed. It is assumed that the µi are fixed parameters and the remaining disturbances stochastic with vit are independent and identically distributed IID(0,σ2
v). It is assumed that Xit is independent of vit for all i and t. The following equation, derived from Balgati (2008) refers to a simple regression:
yit = α + βxit + µi + vit
However, this model does only allows for the estimation of β and (α + µi) together, rather than α and µi separately. If a restriction like ∑N
i=1 µi=0 is imposed, however, it is plausible to obtain β, µ independently.
The fixed effects model is equivalent to generating dummy variables for the individual cases and including them in a standard linear regression that controls for the fixed case ef-fects. Each dummy removes one degree of freedom from the model, thus the fixed effects model functions best when there are numerous periods for fewer cases. The fixed effects model suffers from a large loss of degrees of freedom and it cannot measure the effects of any time-invariant models (like sex, age, etc.).
“There are too many parameters in the fixed effects model and a loss of degrees of free-dom can be avoided if the µi can be assumed random” (Baltagi, 2008). The random effects model is used appropriately if the model requires that we draw N individuals randomly from a large sample. In this case, µi~IID(0, σ2µ), vit~IID(0, σ2v), and µi and vit are independ-ent. Additionally, Xit are independent of µi and vit for all i and t.
A Hausman specification test is employed to choose between using the fixed effects and random effects models. The author suggests that by comparing GLS and Within, which are consistent if H0: E(uit/Xit)=0, but have different probability limits if E(uit/Xit)≠0. The nat-ural test statistic is based on 1= GLS - Within under H0, plim 1=0, and cov( 1, GLS)=0. The Hausman test statistic is represented by the following equation:
h1 = ’1[var( 1)]-1 1
Assuming H0, the Hausman test statistic is distributed as 2K, where K is the dimension of slop vector β. This test is made operational by replacing with a consistent estimator and generalized least squares (GLS) estimator by its corresponding feasible generalized least squares (FGLS) estimator (Baltagi, 2008).
If h1=0, then it is most efficient to use the random effects model, otherwise, the fixed ef-fects model should be employed. If an insignificant p-value is seen and the Chi2(2)>0.05, then it is safe to use the random effects model.
Two separate data sets are used in this study. Data Set I4 has the dependent variable value of buyouts and the independent variables short-term and long-term interest rates and anti-director and creditor rights. The data spans between 1997 and 2008 (12 years) for the 15 European countries.
Data Set II5, on the other hand, has the dependent variable value of buyouts and the inde-pendent variables short-term and long-term interest rates and anti-director and creditor rights, and outstanding stock. The data spans between 1997 and 2008 (12 years) for 10 of the 15 countries since the ECB only provides this data for countries that use the Euro.
4 The countries included in Data Set I are: Austria, Belgium, Denmark, Finland, France, Germany, Ireland,
It-aly, Netherlands, Norway, Portugal, Spain, Sweden, Switzerland, and the United Kingdom.
5 The countries included in Data Set II are: Austria, Belgium, Finland, France, Germany, Ireland, Italy,
4.2 Data Sources and Definitions
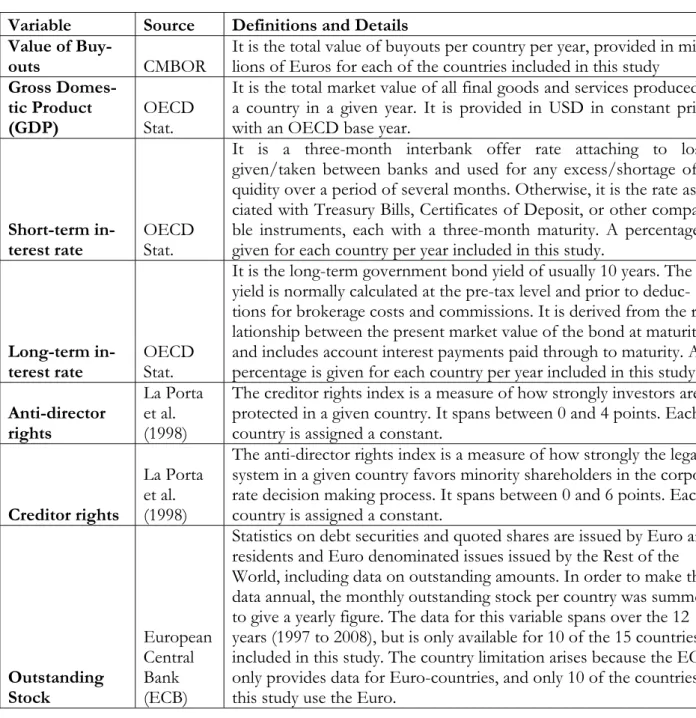
This section focuses on giving some fundamental definitions and details regarding the vari-ables used in this empirical study, as presented in Table 6.
Table 6 Data sources and definitions
Variable Source Definitions and Details
Value of
Buy-outs CMBOR It is the total value of buyouts per country per year, provided in mil-lions of Euros for each of the countries included in this study
Gross Domes-tic Product
(GDP) OECD Stat.
It is the total market value of all final goods and services produced in a country in a given year. It is provided in USD in constant prices with an OECD base year.
Short-term
in-terest rate OECD Stat.
It is a three-month interbank offer rate attaching to loans given/taken between banks and used for any excess/shortage of li-quidity over a period of several months. Otherwise, it is the rate asso-ciated with Treasury Bills, Certificates of Deposit, or other compara-ble instruments, each with a three-month maturity. A percentage is given for each country per year included in this study.
Long-term
in-terest rate OECD Stat.
It is the long-term government bond yield of usually 10 years. The yield is normally calculated at the pre-tax level and prior to deduc-tions for brokerage costs and commissions. It is derived from the re-lationship between the present market value of the bond at maturity, and includes account interest payments paid through to maturity. A percentage is given for each country per year included in this study.
Anti-director rights
La Porta et al. (1998)
The creditor rights index is a measure of how strongly investors are protected in a given country. It spans between 0 and 4 points. Each country is assigned a constant.
Creditor rights
La Porta et al. (1998)
The anti-director rights index is a measure of how strongly the legal system in a given country favors minority shareholders in the corpo-rate decision making process. It spans between 0 and 6 points. Each country is assigned a constant.
Outstanding Stock European Central Bank (ECB)
Statistics on debt securities and quoted shares are issued by Euro area residents and Euro denominated issues issued by the Rest of the World, including data on outstanding amounts. In order to make the data annual, the monthly outstanding stock per country was summed to give a yearly figure. The data for this variable spans over the 12 years (1997 to 2008), but is only available for 10 of the 15 countries included in this study. The country limitation arises because the ECB only provides data for Euro-countries, and only 10 of the countries in this study use the Euro.
4.3 Empirical
Tests
4.3.1 Data Set I
4.3.1.1 Initial Tests
The first data set (Data Set I) used in this study consists of the 15 evaluated countries, for a time-span of 12 years (1997 to 2008), and includes the independent variables of short-term and long-term interest rates, anti-director rights, and creditor rights.
A pooled OLS regression was performed that gave the results found in the Appendix un-der, section A3.1 (Table 13). The dependent variable in this case is the value of buyouts rel-ative to GDP and the independent variables are short-run and long-run interest rates, anti-director rights, and creditor rights.
Long-term interest rate is significant on a 5% level and has a negative relationship to the value of buyouts relative to GDP. However, short-term interest rate is insignificant. Both anti-director and creditor rights are significant and have a positive relationship to the de-pendent variable. However, the data clearly exhibited heteroskedasticity and a histogram showed that the dependent variable was severely skewed (Figures 6 and 7).
Thus, the absolute log of the value of buyouts (the independent variable) was employed. The results found in Section 4.3.1.2 describe the final results once the robust random ef-fects model was employed and a discussion is provided of why these results are optimal for the given data set. It is found that when the absolute logs of the value of buyouts are taken, then although not ideally normal, the histograms improve. This can be seen in Figure 8 in the Appendix.
4.3.1.2 Final Tests
Initially, a pooled OLS regression is performed where the dependent variable is the abso-lute of the value of buyouts and the independent variables are short-term and long-term in-terest rates, and anti-director and creditor rights. The results are presented in Table 7.
Table 7 Pooled OLS regression (Data Set I)
Number of Observations = 180 R2 = 0.1446
Log(Buyouts) Coefficients Standard Error t P > |t|
Short-term interest rate .2451131 .1471454 1.67 0.098
Long-term interest rate -.8143659 .2131486 -3.82 0.000
Anti-director rights .0578777 .1010524 0.57 0.568
Creditor rights .4945619 .1304125 3.79 0.000
Constant 9.204986 .7555586 12.18 0.000
As is evident, the short-term interest rate is significant on a 10% level and the long-term in-terest rate is significant on a 10% level. Short-term inin-terest rate is positively related to the log of the value of buyouts and long-term interest rate is negatively related to the log of the value of buyouts. Anti-director rights are insignificant, but creditor rights are significant on
a 10% level and are positively related to the log of the value of buyouts. A scatter plot of the Log (Buyouts) can be seen in Figure 9 in the Appendix, section A3.2.
However, it is important to check for country and time specific variations, for which rea-son a fixed effects model is applied. This results in the anti-director rights and creditor rights being removed since these are constants for each country.
As a result, a random effects model is applied and a Hausman test confirms its efficiency. A dummy variable for the year 2007 is included since it is apparent that this year had a rela-tively higher value of buyouts and was the only significant year dummy when all dummies were tested. In order to ensure that the results are consistent (without assuming heteroske-dasticity and the normality of random error terms), a robustness check is used, which gives the results found in Table 8.
The following linear model explains the model used in Table 8:
logyit = α + β1STij + β2LTij + β3ADij + β4CRij + β52007ij + µi + vit
where logyij represents the absolute log of the value of buyouts (dependent variable), α is the constant, STij represents the short-term interest rate, LTij stands for the long-term in-terest rate, and ADij and CRij represent the anti-director and creditor rights respectively.
2007ij is the dummy variable with a value of 1 for the years 2007 and 0 otherwise.
Table 8 Robust random effects model (Data Set I)
Number of observations = 180 R² (overall) = 0.1521 Hausman Test Chi2(2) = (b-B)'[(V_b-V_B)^(-1)](b-B) = 0.11 Prob > Chi2 = 0.9447 Log(Buyouts) Coefficients Robust Standard Error t P > |t|
Short-term interest rate .0259925 .081926 0.32 0.751
Long-term interest rate -.5984869 .1053599 -5.68 0.000
Anti-director rights .1012434 .2764781 0.37 0.714
Creditor rights .5389665 .3959021 1.36 0.173
Year 2007 (dummy) .8689019 .2018635 4.30 0.000
Constant 8.7355 1.037461 8.42 0.000
Since both Prob. > Chi2 are greater than 0.05 and the p-values are insignificant in the Hausman test, it is reasonable to use the random effects model.
As is apparent from the consistent and robust results in Table 8, short-term interest rate is insignificant, but long-term interest rate is significant on a 1% level and negatively related to the value of buyouts. The coefficients indicate that a 1 percentage point increase in long-term interest rate causes an approximately 59.8 percentage fall in the value of buyouts.
The dummy for year 2007 is significant and has a positive coefficient. This implies that the year 2007 exhibited a heightened value of buyouts relative to other years. The formula to evaluate the coefficients in the case of dummy variables is
[(e^β2 - 1) * 100]% = [(e^.8689019- 1) * 100]% = 138.4%
This implies that relative to the base year and all things equal, the year 2007 has 138.4 per-cent higher value of buyouts.
Anti-director and creditor rights are insignificant. A two-way scatter plot can be seen in Figure 10 in the Appendix, section A3.2. The R-squares is rather low (0.1521), implying that there are more determinants that should explain the dependent variable.
4.3.2 Data Set II
4.3.2.1 Initial Tests
The second data set in this study includes 10 of the 15 countries since only 10 use the Eu-ro. This is because one of the independent variables is outstanding stock, the data for which is found on the European Central Bank, which only provides this particular data for Euro using countries. The other independent variables include the short-term and long-term interest rates, anti-director rights and creditor rights.
A pooled OLS regression if performed, where the dependent variable is the value of buy-outs relative to GDP. All 10 countries are tested over a selection of 12 years (1997 to 2008). The results for this can be seen in section A3.3 in the Appendix (Table 14).
The results show that the independent variable Stock/GDP is significant on a 5% level and has a positive relationship to the value of buyouts relative to GDP. Long-term interest rate is significant as well, but has a negative relationship to Buyouts/GDP. Short-term interest rate, anti-director rights, and creditor rights are insignificant. However, the data clearly ex-hibited heteroskedasticity and a histogram showed that the dependent variable was severely skewed (Figures 11 and 12). It is found that when the absolute logs of the value of buyouts are taken, then although not ideally normal, the histograms improve and the heteroskedas-ticity diminishes. This can be seen in Figures 13 and 14 of the Appendix. Thus, absolute logs are applied to the dependent variable and to the independent variable of outstanding stock.
4.3.2.2 Final Tests
Initially, a pooled OLS regression is performed where the dependent variable is the Log of the value of buyouts, and the independent variables are short-term and long-term interest rates, anti-director and creditor rights, and the absolute log of outstanding stock.
Table 9 Pooled OLS regression (Data Set II)
Number of Observations = 120 R2 = 0.7002
Log(Buyouts) Coefficients Standard Error t P > |t|
Short-term interest rate -.1124237 .123376 -0.91 0.364
Long-term interest rate -.3447923 .1787677 -1.93 0.056
Anti-director rights -.050274 .0900812 -0.56 0.578
Creditor rights .0314317 .1235626 0.25 0.800
Log(Stock) 1.223263 .0848807 14.41 0.000
Constant -14.27493 1.981609 -7.20 0.000
As can be seen from the results in Table 9, short-term interest rate along with anti-director and creditor rights are insignificant. Long-term interest rate is, however, significant on a 10% level and negatively related to the absolute log of the value of buyouts. Similarly, the log of outstanding stock is significant on a 5% level and positively related to the log of buyouts. Also, the R-squared has increased substantially from the regressions in Data Set I, implying that outstanding stock is an important determinant of the value of buyouts.
The application of the fixed effects model again removes anti-director and creditor rights. As a result, a random effects model is applied and a Hausman test confirms its efficiency. A dummy variable for the year 2007 is applied in order to make the results comparable be-tween the two data sets. A robustness check is used to ensure that the results are consistent without assuming heteroskedasticity and the normality of random error terms. The results for this model are presented in Table 10. A two-way scatter plot can be seen in Figure 15 in the Appendix (section A3.4).
The following linear model explains the model used in Table 10:
logyit = α + β1STij + β2LTij + β3ADij + β4CRij + β5logOSij + β62007ij + µi + vit
where logyij represents the absolute log of the value of buyouts (dependent variable), α is the constant, STij represents the short-term interest rate, LTij stands for the long-term in-terest rate, and ADij and CRij represent the anti-director and creditor rights respectively. OSij represents outstanding stock, which in this case is the absolute log of the variable.
Table 10 Robust random effects model with dependent (Data Set II) Number of observations = 120 R² (overall) = 0.6972 Hausman Test Chi2(2) = (b-B)'[(V_b-V_B)^(-1)](b-B) =5.81 Prob > Chi2 = 0.2136
Log(Buyouts) Coefficients Robust Stan-dard Error t P > |t|
Short-run interest rate -.1619676 .1233164 -1.31 0.189
Long-run interest rate -.2996833 .1509013 -1.99 0.047
Anti-director rights -.1218009 .166635 -0.73 0.465
Creditor rights -.0287055 .2687704 -0.11 0.915
Log(Stock) .9486016 .1656788 5.73 0.000
Year 2007 (dummy) .5739002 .2542419 2.26 0.024
Constant -8.770441 3.582182 -2.45 0.014
The consistent and robust results for Data Set II found in Table 10 are similar to those from Data Set I. Short-term interest rate along with anti-director and creditor rights is in-significant. However, long-term interest rate is significant on a 5% level and is negatively related to the value of buyouts. It is evident that a 1 percent increase in the long-term inter-est rate results in an approximately 29.9 percent fall in the value of buyouts.
Similarly, the dummy variable for the year 2007 is significant and positively related to the log of buyouts. Evaluating the coefficients again implies using the following formula:
[(e^β2 - 1) * 100]% = [(e^.5739002 - 1) * 100]% = 77.5%
This indicates that relative to the base years and all else equal, the year 2007 exhibited and 77.5 percent higher value of buyouts.
However, the R-squared has increased substantially from the regression in Data Set I. This is due to the addition of the absolute log of outstanding stock, which seems to be an im-portant determinant of the value of buyouts. The log of outstanding stock is significant on a 5% level and positively related to the log of the value of buyouts. The coefficients indi-cate that a 1 percent increase in the outstanding stock results in a 0.94 percent increase in the value of buyouts.
It should be mentioned though, that when the same robust regression is run using all the dummy variables, the results are similar to those in Table 9. However, running the same re-gression with only the dummies for year 2007 and 2008 results in the long-term interest rate along with short-term interest rate, anti-director rights, and creditor rights being insig-nificant. Only the absolute log of outstanding stock is significant on a 5% level and posi-tively related to the log of buyouts. This regression can be viewed in the Appendix in sec-tion A3.5 along with a corresponding two-way scatter plot in Figure 16.
4.4 Summary and Discussion of Results
Data Set I concludes that long-term interest rate is the most important determinant of the value of leveraged buyouts. Similar conclusions were made by, for instance, Ljungqvist et al. (2007) and Axelson et al. (2008). The implication is that if interest rate are low, then there is an increase in the value of leveraged buyouts. This may be because private equity firms are more willing to take large loans from banks in order to benefit from the low in-terest rates.
Data Set I concluded that a 1 percent increase in long-term interest rates causes a 59.8 per-centage fall in the value of buyouts, whereas Data Set II found that a 1 percent increase in the long-term interest rate results in a 29.9 percent fall in the value of buyouts. Thus, it can be said that the impact of a change in interest rate is very important for whether large amount of credit will be taken to finance risky deals.
When Data Set II is used, i.e. outstanding stock per country per year is included, then the R-squared increases drastically. This implies that outstanding stock plays an important role in determining the value of buyouts in each country. Log(Stock) is positively related to the Log(Buyouts), suggesting that if a country has a larger value of outstanding stock, it will also have a larger value of buyouts. This is in line with Black and Gilson (1998) and Schert-ler (2003), who find that private equity capital flourishes in countries with liquid and deep stock markets. Thus, it can be concluded that the availability of equity, which is greater in countries with larger secondary stock markets (i.e. more outstanding stock), is imperative in determining the size of the LBO market.
However, it is evident that anti-director rights and creditor rights do not have a significant impact on the value of buyouts in the included countries. This may be because the devel-oped model by La Porta et al. (1998), although important for the analysis of countries and their legal forms, is not ideal for cross-country comparisons related to the impact of anti-director and creditor rights on the value of leveraged buyouts. It may be more efficient to use the new index of shareholder protection developed by Djankov et al. (2008), which is inspired by La Porta et al. (1998).
5 Conclusion
Private equity activity, and particularly leveraged buyouts, have become an important part of the European economy in recent years. In 2007, which was a peak-year for the value of buyouts in the 15 European countries included in this study, LBOs accounted for 1,59 per-cent of total GDP. Although the crisis resulted in the value of LBOs falling substantially in 2008, it is likely that the future will hold a rising value of LBOs. For this reason, it is impor-tant to evaluate the various aspects of LBOs, and particularly the cross-country factors that impact the size of the LBO market in European countries.
Consequently, the focus of this paper has been to outline and evaluate some of the macro-economic and legal determinants of leveraged buyouts in Europe. The chosen determi-nants that were the central points of this study were short-term and long-term interest rates, outstanding stock, and anti-director and creditor rights.
The empirical analysis provided in this paper allows for the conclusion of a number of re-sults. Firstly, it is evident that outstanding stock is an exceptionally important determinant. This result indicates that countries with more outstanding stock (i.e. more publicly available stock) have larger LBO markets. Larger secondary markets (those where stocks are trad-able) imply that stocks are a liquid/tradable asset, which diminishes the risk for both the is-suing company and the equity investors. Thus, it can be argued that larger stock markets would result in greater LBO markets due to the increased availability of equity.
Further, the results indicate that long-run interest rate is a significant determinant of lever-aged buyouts. Since LBOs are financed using a substantially high share of debt relative to equity, it is likely that private equity firms would be more hesitant to take large loans in countries where interest rates are high. This concept is in line with the conclusion devel-oped by, for instance, Ljungqvist et al. (2007).
However, the empirical results in this paper do indicate that anti-director (i.e. shareholder) rights and creditor rights are insignificant. This implies that these variables, developed by La Porta et al. (1998), are not valid determinants for leveraged buyouts. Nevertheless, it is probable that legal aspects related to creditors and shareholders do play a part in the devel-opment and growth of LBO markets, however, it may not be sufficient to apply the system developed by La Porta et al. (1998).
This leads to the supposition that it is rather the financial determinants that are more im-portant for the size of the LBO markets in European countries, rather than the variations in legal systems. Although it is likely that shareholder and creditor rights do play a part in how extensive LBO activity is, it seems that whether acquiring the funds needed to finance a large and risky transaction is of highest relevance.
5.1 Suggestions for further research
It would be interesting to evaluate the impact of country legislature on the value of LBOs in a more detailed manner. The data obtained from La Porta et al. (1998) was insufficient to truly give an overview of this area, but a deeper analysis could provide information as to why certain markets in Europe have more LBO activity than others.
Further, there are a number of other determinants that would be interesting to evaluate, such as commercial bank lending and collateralized loan obligations (CLOs). There were not included in this study due to a lack of available data.