Predictors of customer loyalty in automobile insurance:
- The role of private information in risky driving behavior and claim history
Sara Arvidsson – Swedish National Road and Transport Research Institute (vti) CTS Working Paper 2011:2
Abstract
Contract-relevant information asymmetries are known to cause inefficien-cies in markets. The information asymmetry is largest in the beginning of the customer-insurer relationship but reduces over time; the longer a poli-cyholder stays with the insurer the more the insurer learns about the poli-cyholder’s risk. Two important characteristics of the market studied here imply that the information asymmetry may not be reduced for all policy-holders. First, insurers do not have access to traffic violations, which are predictors of risk since policyholders with traffic violations are more likely to report a claim. Second, the insurers do not share information, such as previous claims, which means that the policyholder can flee a poor claim record by switching insurer. Hence, there may be a selection of high risk customers who switch insurer more often, such that the information asymmetry in this group is never reduced. To test this, we compare infor-mation asymmetries in two groups of policyholders; new customers who stay with the insurer for a period or less (short term), and long-term cus-tomers who stay with the insurer for several periods (loyal). The results indicate that departing policyholders are disproportionately high risks that constitute an adverse selection of risks, while loyal policyholders constitute a propitious (favorable) selection of risks.
Keywords: Asymmetric information, insurance, accidents, adverse selection,
propitious selection
JEL Codes:D82
*Swedish National Road and Transport Research Institute (VTI) Box 920, 781 29 Borlänge.
sara.arvidsson@vti.se
**Centre for Transport Studies, Royal Institute of Technology Teknikringen 78 B, 100 44 Stockholm.
Acknowledgement: I wish to thank Länsförsäkringar AB for insurance data, the Swedish National Police Board (RPS) and the National Council of Crime
Preven-Predictors of customer loyalty in automobile insurance:
- The role of private information in risky driving behavior and claim historySara Arvidsson VTI*/CTS**
Abstract:
Contract-relevant information asymmetries are known to cause inefficien-cies in markets. The information asymmetry is largest in the beginning of the customer-insurer relationship but reduces over time; the longer a cyholder stays with the insurer the more the insurer learns about the poli-cyholder’s risk. Two important characteristics of the market studied here imply that the information asymmetry may not be reduced for all policy-holders. First, insurers do not have access to traffic violations, which are predictors of risk since policyholders with traffic violations are more likely to report a claim. Second, the insurers do not share information, such as previous claims, which means that the policyholder can flee a poor claim record by switching insurer. Hence, there may be a selection of high risk customers who switch insurer more often, such that the information asymmetry in this group is never reduced. To test this, we compare infor-mation asymmetries in two groups of policyholders; new customers who stay with the insurer for a period or less (short term), and long-term cus-tomers who stay with the insurer for several periods (loyal). The results indicate that departing policyholders are disproportionately high risks that constitute an adverse selection of risks, while loyal policyholders constitute a propitious (favorable) selection of risks.
1. Introduction
When studying information asymmetries it is crucial to consider the under-lying properties of the market; what is common information to both the policyholder and the insurer in one market may be private information in another. Two such examples are traffic violations and claim history with other insurance companies. In some automobile insurance markets this information is observable while in others, such as Sweden, it is not.1 The
information that an insurer can obtain about a new policyholder’s past claim history comes from the customers self-reporting. The insurer’s in-formation about a new policyholder can therefore be expected to be less complete and accurate than the claim history possessed by the policy-holder’s previous insurer. Hence, in the presence of asymmetric informa-tion the insurer is not able to distinguish between a high and a low risk driver that belong to the same risk class on the basis of their observable characteristics.
A consequence of this information asymmetry is that a policyholder has incentives to switch insurer if a claim is reported. The reason is that the policyholder can flee the claim record by the switch and the premium will be significantly lower if s/he informs a new insurer that no claim occurred in the previous year compared to reporting previous claims (Cohen; 2005).
Nonetheless the information asymmetry is likely to shrink over time since the longer a policyholder stays with the insurer the more the insurer learns about the policyholder’s risk. Since the insurer observes the outcome (claim
1 In the USA insurers have access to traffic violations and the premium increases if
the policyholder commits a traffic violation or is fined. In Italy, for instance, the insurers have information about previous claims since the policyholder needs a certificate of previous claims when switching insurer.
or not) in each period, there is a learning effect with loyal customers. In several situations and markets the information asymmetry is likely to di-minish over time, which some studies refer to as a learning effect. One example is credit markets where a bank with regular customers gets an advantage over other banks, since they learn their risk (Dell’Ariccia et al; 1999 and Marguez; 2002). Related work in auction theory concerns learn-ing about rivals’ types in biddlearn-ing behavior (Laffont and Tirole; 1988 and Andreoni et al.; 2006). In the job market current employers are better in-formed than potential future employers about the abilities of their workers. Job switchers are further assumed to be disproportionately less able work-ers, this is known by the employer who sets a lower wage. This lower wage reduces the incentives for high ability workers to switch jobs if they cannot signal their type (Waldman; 1999, Golan; 2005 and Pinkston; 2009). A learning effect also arises in the insurance market since the insurers learn about their loyal policyholders and obtain an information advantage com-pared to competing insurers. Cohen (2008) further shows that the learning effect enables higher profit since long-term policyholders with good claim history receive a reduction in their premiums that are lower than the ex-pected cost.
This paper follows Cohen (2005) by testing if departing policyholders are disproportionately those with claims in the period(s) preceding the depar-ture. The analysis is extended by policyholder’s private information about being a risky driver (traffic violations). The purpose is to test if short-term policyholders are systematically different from long-term policyholders. We expect that the information asymmetry depends on how long the policy-holder has been a customer of the insurance company. Accordingly, we test the hypothesis that there is a selection in terms of loyalty; departing cus-tomers are more likely risky individuals, while loyal cuscus-tomers are less risky individuals. It is expected that the insurers learning effect may differ
for under-reporting claim history and not observing traffic violations. The reason is that claims are unobservable ex ante but not ex post. In contrast to claims, traffic violations are observable both ex ante and ex post. This means that the insurer will observe all claims reported during the period, while traffic violations will continue to be the policyholder’s private infor-mation. We expect that policyholders who flee their claim record are more likely to report a claim with their new insurer, which implies that a re-ported claim reduces the probability of loyalty. If a traffic violation contin-ues to be private information, we further expect that it will not have any effect on loyalty.
Conditional on a close replication of the risk classification, made possible by access to the insurers’ actuarially predicted risk classification, we test if reported at-fault claims and traffic violations affect loyalty. First, we use a probit model to test if traffic violations and previous at-fault claims affect the policyholders’ decision to leave the company after a period or less. Second, we use another probit model to test the effect of traffic violations and previous at-fault claims on loyal customers. We use a five-year relation proxy for being a loyal customer, since this is the longest policyholder-insurer relation we can observe in our data.
Our main results indicate that at-fault claims increase the probability of leaving the company. One reason is that the market structure makes it possible to behave opportunistically and receive a lower premium from another insurer. Loyal policyholders are shown to be more likely to be claim free during their time as customers, suggesting that they represent a lower risk for their insurer. Our findings also indicate that individuals with traffic violations are more likely to depart. The prediction ex ante is that traffic violations do not affect loyalty if this continues to be the policy-holder’s private information. There is no reason for the policyholders to
depart if their risk type is not revealed. Our conclusion is that either the risk type is revealed to the insurer, or, individuals who commit traffic vio-lations have other characteristics that correlate with the departure decision. All in all, our primary conclusion is that departing policyholders are dis-proportionately high risks who constitute an adverse selection of risks, while loyal policyholders constitute a propitious (favorable) selection of risks.
The rest of the paper is organized as follows. Section 2 illustrates the theo-retical framework while section 3 describes the empirical approach in terms of data and econometrics in more detail. Section 4 presents the re-sults and the section 5 provides the conclusions.
2. The theoretical framework
Swedish insurers do not have access to information about policyholders’ traffic violations, even though previous research has established that traffic violations are a strong predictor of accidents (Forward; 2008) and that policyholders with traffic violations are more likely to report a claim where s/he was at fault (Arvidsson; 2010). We can therefore define policyholders with traffic violations as risky drivers and the insurer cannot, other than by observable characteristics, determine who is more likely to be a risky driver in terms of violations.
Furthermore, Swedish insurers are not required to share information about customers. This implies that previous claims with other companies are unobservable, and it is not possible to use other publicly available records to decrease this information asymmetry. Insurers therefore ask new policy-holders to report their past claim history. This self-reporting is viewed as
inaccurate by the insurance industry, since policyholders may underreport previous claims. This viewpoint is also empirically established by Cohen (2005), who finds that departing customers are disproportionately those with claims in the period preceding the departure decision. Still, policy-holders may change insurer for reasons other than a bad record (realloca-tion, lower prices etc.), which implies that the insurer will not be able to fully infer a new customer’s past claims from the decision to switch.
In the beginning of t1 the insurer does not know, other than by observable
characteristics, whether the policyholder is a high or low risk. In the end of
t1 the policyholder decides whether or not to stay with the insurer, a
deci-sion that may be affected by claims during the period. If a claim has oc-curred the premium in t2 is likely to increase, especially if the policyholder
was partially or fully responsible for the reported claim. Thus, the policy-holder has an incentive to flee this claim record by switching to a new in-surer.2 At the end of the first period the company learns more about the
policyholder type since the number of reported claims during the period is observed. This learning effect increases when t increases since the number of observations of an individual increases, implying that information asymmetries are dealt with over time.
But not all customers are loyal. Before the new insurer learns the new poli-cyholder’s type, it is possible that s/he switches insurer again, which means that the insurance industry may not ever fully learn the type of switching policyholders. Accordingly, we test the hypothesis that there is a selection of risks in terms of loyalty; departing customers are more likely higher risks, while loyal customers are more likely to be lower risks. We expect that departing customers are more likely to report at-fault claims and loyal
2 The policyholder may depart from the company for reasons other than switching
insurer. S/he might decide not to purchase a new insurance policy (and drive unin-sured) or sell the vehicle.
customers to be less likely to report claims. If the policyholder’s risky driv-ing behavior is revealed to the insurer, we expect that the traffic violations to be a predictor of customer loyalty. If risky behavior continues to be private, we do not expect traffic violations to be a predictor of loyalty.
3. The empirical framework
3.1
Data and methodological issues
The insurer that has provided the main data set consists of 24 regional subsidiaries located in all counties in Sweden. Each observation includes all information that the insurer has about the policyholder, the vehicle and the contract characteristics. All in all, the data consists of approximately 9.3 million observations on automobile insurance policies for the period 2006-2008. To this data set we add private information about the policyholder’s risky behavior. The data comprises traffic safety violations in terms of on-the-spot fines and convictions, which are not accessible to Swedish insur-ers.3 We distinguish policyholders with one conviction from policyholders
with several convictions for traffic safety violations. The reason is that we believe that relapsed violations are associated with higher risk individuals. Table 1 provides descriptive statistics of some of the variables. Appendix A provides a complete list of the information in each observation.
3 The number of convictions for traffic safety violations is registered by the Swedish
National Council for Crime Prevention (BRÅ). These are cases where sanctions are made by an attorney, including for example convictions for driving intoxicated and driving carelessly, that is, traffic safety violations that lead to more serious sanc-tions than on-the-spot-fines. Data on on-the-spot fines comes from the RIOB regis-ter at the Swedish National Police Board (RPS). These fines are divided into speed-ing and other traffic offences such as runnspeed-ing red lights, takeovers in crossspeed-ings, and some other offences due to risky behavior or vehicle flaws. Since RIOB is cleared periodically, it is possible to receive at most five years from the current year.
The definition of loyalty calls for a remark: Data is not truncated, which implies that we can observe customer engagement in the company back in time. This enables us to specify customer loyalty for a longer time period than 2006-2008. We have created an entry and exit variable for the first and last observation of an individual, not the contract. 4 The reason is that
a contract can be observed as new even though the customer has been with the company for years, e.g. if the customer purchases an additional vehicle after x years, there will be an observation of a new contract but for an old customer. Since the insurer checks the policyholders’ id, the choice is to define loyalty in terms of how many periods an individual has stayed with the insurer, and not for how many periods a contract lasted. Exit minus entry defines the number of years a policyholder stayed with the company. We include all contracts that the individual had during their time with the company. All loyal customers had at least one contract that started every year between entry and exit, which implies that they stayed with the in-surer for a continuous period of at least five years.
Short-term customers are defined as new policyholders, for whom the in-surer has no previous observations and who leave the company after one period or less. All contracts that the policyholders have during their peri-ods in the company are included. Specifically, we look at customers that departed in 2007 after a year or less. For each policyholder we generate a
4 A note of caution: Since the insurers changed their data system on 1 January
2006, some individuals who started with the company during 2006 may have stayed with the company for a longer period of time. Hence, they may appear as new in our data even though they stayed with the insurer for x periods. We do not have any indicators for old and new policyholders for that year. The majority, however, entered the company before 2006.
dummy variable that equals 1 if a policyholder ends the contract and zero if s/he continues for another period.5
The nature of this data set calls for an additional remark; a policyholder can appear as several observations that are treated as independent by the insurer. An example is when a customer insures vehicles of different brands. The policyholder receives a separate contract for each of the vehi-cles, which are treated as separate risks even though they are owned and driven by the same individual. For this reason the premiums in the con-tracts may differ substantially.
To handle data, insurers makes three main assumptions regarding the con-tracts, which we follow in the empirical analysis; First, there is independ-ence between contracts meaning that the outcomes for different insurance policies are independent, even though the contracts may be owned by the same individual. Second, there is time independence in that the outcomes (claim or not) in two separate time intervals are independent. This implies that we treat repeated contracts as independent observations. Third, ho-mogeneity is assumed, that is, an outcome with the same exposure has the same distribution within a risk group.6 This implies that the insurer does
not consider any heterogeneity other than observable characteristics. If the insurance market handles the information asymmetry regarding traffic violations and claims, we should not expect to find any differences between
5 Note that data covers the end of 2008. This implies that if we include departure
decisions in 2008, we cannot control for whether the policyholder actually departs or if the contract only expires and the policyholder renews it during 2009. Since we cannot observe the outcome in 2009, the choice is to define departs during 2007 since we can observe whether or not the policyholder departure or stays during 2008.
6 There are several examples when these conditions are violated. One example,
already discussed, is untruthful reports of the policyholders, which violates homo-geneity. Furthermore, if two vehicles insured by the same insurer are involved in a collision with each other, the independence between contracts could be violated.
the two groups. The reason is that there would not be any incentives to switch insurer if a claim was reported or if risky behavior was revealed. With no information asymmetry there would not be any gains from switch-ing insurer, since the new insurer would observe the risk type.
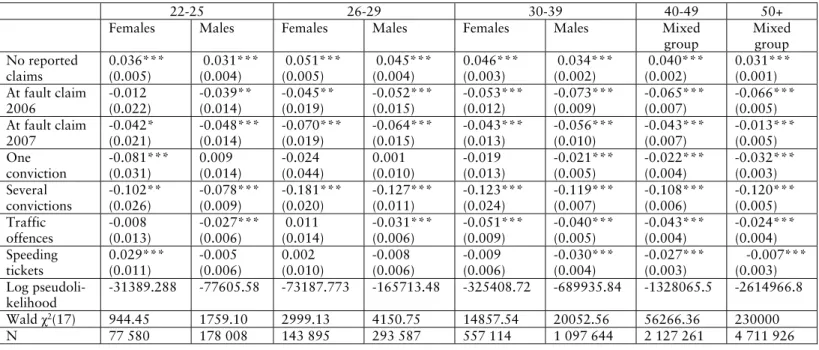
We perform a sensitivity analysis of the independence between observa-tions, where we cluster-adjust the standard errors with respect to policy-holder-id. The significance levels are slightly affected and the results are in Table 1 and 2 in Appendix B. Still, a resolution of the methodological is-sues associated with these kinds of data is beyond the scope of this paper; refined methods are nevertheless a promising field for future methodologi-cal work.
3.2 Descriptive statistics
We start the analysis with some descriptive statistics concerning policy-holders that stayed with the insurer for a period or less (t1), and loyal
cus-tomers that stayed with the insurer for at least five years (t5). We also look
at the whole sample to see if there tend to be any differences between the groups.
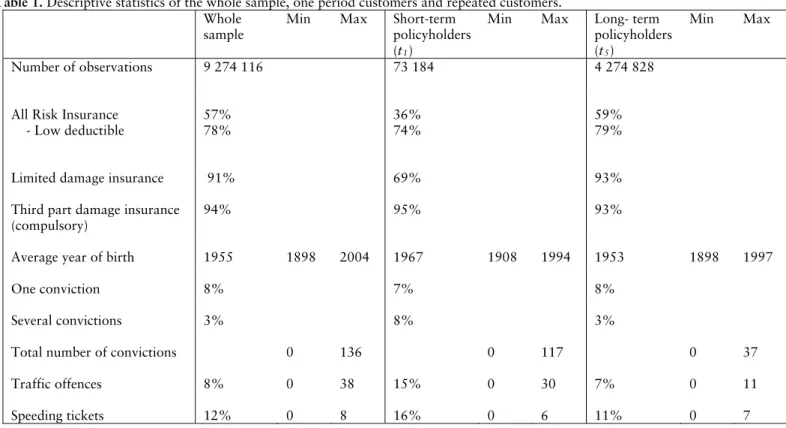
Table 1. Descriptive statistics of the whole sample, one period customers and repeated customers.
Whole sample
Min Max Short-term policyholders (t1)
Min Max Long- term policyholders (t5)
Min Max
Number of observations 9 274 116 73 184 4 274 828
All Risk Insurance 57% 36% 59%
- Low deductible 78% 74% 79%
Limited damage insurance 91% 69% 93%
Third part damage insurance (compulsory)
94% 95% 93%
Average year of birth 1955 1898 2004 1967 1908 1994 1953 1898 1997
One conviction 8% 7% 8%
Several convictions 3% 8% 3%
Total number of convictions 0 136 0 117 0 37
Traffic offences 8% 0 38 15% 0 30 7% 0 11
The share of All Risk Insurance contracts is higher for long-term customers (59%) compared to the whole sample (57%) and in particular to policy-holders that left the company during 2007 (36%). The number that chose the lower deductible is about the same in all groups. The share of Limited Damage Insurance is highest for long-term policyholders (93%) and lowest for policyholders who departed during 2007 (69%). Policyholders with the compulsory third party damage insurance are approximately the same in the whole sample as for short-term and repeated policyholders (about 94%). Since this insurance coverage is compulsory for vehicles in traffic, about 6% in each group have de-registered vehicles that are not used in traffic during the year.
Short-term policyholders are younger than loyal customers in comparison. The table shows that the minimum age of the policyholders is below the age of 18, which is the legal driving age in Sweden. Until the first of Octo-ber 2006 it was legal for under-aged people to own a vehicle. This is a special group of policyholder who are not likely to be the main users since they do not have a driving license. For this reason they are eliminated from the analysis (838 observations).
Contracts where the policyholder has one conviction are the same in all groups; the share of contracts with a policyholder who has had several convictions is higher for departing customers. This is also true when it comes to traffic offences and speeding tickets, which may indicate of that high risk drivers tend to be short-term policyholders and switch insurer more often.
Younger groups tend to have a higher share of fines compared to older groups while the opposite is true for convictions. One reason is that fines covers a shorter time period (2004-2007) compared to convictions
(1973-2007), suggesting that the probability of having a conviction increases with age while the probability of being fined does not. Females tend to have lower frequencies of violations and at-fault claims; they also constitute a lower share of vehicle ownership, compared to males. In sum, females and younger groups have lower frequencies compared to males, which suggests that the results regarding males are more robust.
3.3 Econometric approach
To test if traffic violations and previous claims have any effect on loyalty we estimate two probit models where the first equation estimates the effect of private information on being a loyal customer. The second equation estimates the effect on private information of being a short-term customer. The control variables included when studying information asymmetries calls for further attention since previous studies have pointed out the im-portance of a careful conditioning on all the information that is observed by the insurance company and used in the premium price (Chiappori and Salanié: 2000 and Finkelstein and McGarry; 2006: Cohen and Siegelman; 2010). A preferred approach is therefore to condition on the company actuarial risk classification since this is the basis for the premium and al-lows the insurer to place policyholders in different risk classes. The risk classification variables used in the insurance company’s actuarial model in 2006-2008 are included in the vector, X. The variables included differ slightly in the equations, the reason being that the insurer has more infor-mation about loyal customers compared to new customers. We clarify the variables that are included in each equation below.
In all regressions we perform the analysis on sub groups that consist of the age and gender groups used by the insurer in the actuarial model in 2007
and 2008. This provides us with ten groups on which we perform the analysis.
The dependent variable in equation (1) takes the value one if the policy-holder left the company during 2007 after being a customer for a year or less and zero otherwise.
Prob(Short term=1) = Φ(X1+NC2+C063+C074+D5 ) (1)
The variable X is a vector that consists of the risk classification variables used in the insurance company’s actuarial model in 2006-2008. More spe-cifically, X in equation (1) consists of age of policyholder, vehicle age, kilometer class, vehicle risk classification and residential area risk classifi-cation.
NC is an indicator variable that takes the value one if no claim was re-ported during the period. Furthermore C06 and C07 are indicator variables
taking the value one if the policyholder reported a claim where he or she was at fault during 2006 or 2007, respectively; zero otherwise.
D is a vector of four indicator variables; The first takes the value one if the
policyholder has at least one fine for speeding, or zero otherwise. The sec-ond takes the value one if the policyholder has received at least one fine for traffic offences other than speeding, or zero otherwise. The third indicator variable takes the value one if the policyholder has received one conviction for traffic safety violations, or zero otherwise. The fourth indicator vari-able takes the value one if the policyholder has received two or more con-victions for traffic safety violations, or zero otherwise.
The dependent variable of equation (2) takes the value one if the policy-holder has stayed with the insurance company for at least five years. The vector X in equation (2) generally consists of the same explanatory vari-ables as equation (1). The difference is that information about claims with the insurer is added. We have constructed four dummy variables taking the value one for one, two, three and four years of no claims, or zero other-wise.7 These variables are included in the loyal policyholder analysis since
reported claims during the period are observed by the insurer and used in the premium pricing scheme.
Prob(Loyal =1) = Φ (Xδ1+NCδ2+C06δ3+C07δ4+Dδ5) (2)
We are mainly interested in the private information indicators, D, and previous claims, C06, C07, from which we can ascertain whether the
policy-holder's private information about risky behavior and reported claims differ between loyal and short-term customers.
4. Results
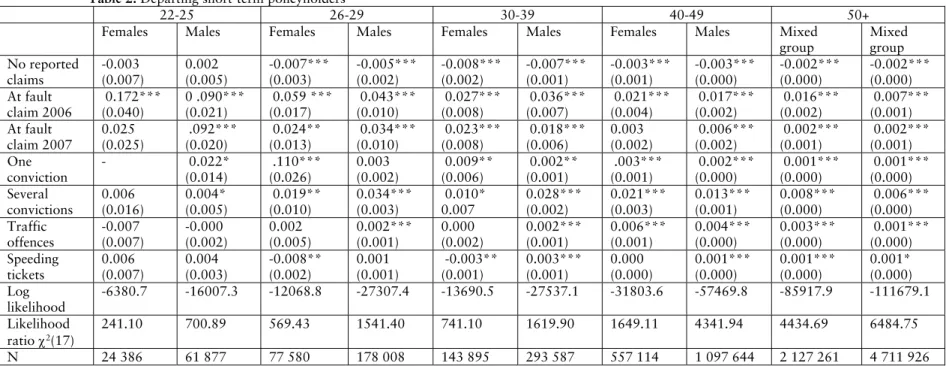
Table 2 reports the marginal effects from probit estimation of equation (1). We estimate the relationship of private information and previous at-fault claims on the exit decision conditioned on the risk classification, X.
7 According one of the actuaries in our insurance company this variable is
Table 2. Departing short-term policyholders
22-25 26-29 30-39 40-49 50+
Females Males Females Males Females Males Females Males Mixed
group Mixed group No reported claims -0.003 (0.007) 0.002 (0.005) -0.007*** (0.003) -0.005*** (0.002) -0.008*** (0.002) -0.007*** (0.001) -0.003*** (0.001) -0.003*** (0.000) -0.002*** (0.000) -0.002*** (0.000) At fault claim 2006 0.172*** (0.040) 0 .090*** (0.021) 0.059 *** (0.017) 0.043*** (0.010) 0.027*** (0.008) 0.036*** (0.007) 0.021*** (0.004) 0.017*** (0.002) 0.016*** (0.002) 0.007*** (0.001) At fault claim 2007 0.025 (0.025) .092*** (0.020) 0.024** (0.013) 0.034*** (0.010) 0.023*** (0.008) 0.018*** (0.006) 0.003 (0.002) 0.006*** (0.002) 0.002*** (0.001) 0.002*** (0.001) One conviction - 0.022* (0.014) .110*** (0.026) 0.003 (0.002) 0.009** (0.006) 0.002** (0.001) .003*** (0.001) 0.002*** (0.000) 0.001*** (0.000) 0.001*** (0.000) Several convictions 0.006 (0.016) 0.004* (0.005) 0.019** (0.010) 0.034*** (0.003) 0.010* 0.007 0.028*** (0.002) 0.021*** (0.003) 0.013*** (0.001) 0.008*** (0.000) 0.006*** (0.000) Traffic offences -0.007 (0.007) -0.000 (0.002) 0.002 (0.005) 0.002*** (0.001) 0.000 (0.002) 0.002*** (0.001) 0.006*** (0.001) 0.004*** (0.000) 0.003*** (0.000) 0.001*** (0.000) Speeding tickets 0.006 (0.007) 0.004 (0.003) -0.008** (0.002) 0.001 (0.001) -0.003** (0.001) 0.003*** (0.001) 0.000 (0.000) 0.001*** (0.000) 0.001*** (0.000) 0.001* (0.000) Log likelihood -6380.7 -16007.3 -12068.8 -27307.4 -13690.5 -27537.1 -31803.6 -57469.8 -85917.9 -111679.1 Likelihood ratio 2(17) 241.10 700.89 569.43 1541.40 741.10 1619.90 1649.11 4341.94 4434.69 6484.75 N 24 386 61 877 77 580 178 008 143 895 293 587 557 114 1 097 644 2 127 261 4 711 926
Notes: The reported coefficients are marginal effects from a probit estimation of equation (1). (–) indicates that there are too few observa-tions and that the variable is not included. *** ,**,* represent significance at the 1, 5 and 10 percent levels respectively. Standard er-rors are in parentheses. See the main text for more details.
Consistent with the findings in Cohen (2005) our results suggest that at-fault claims in the same period, as well as in the previous period, increase the probability of leaving the company. Hence, the results indicate that departing customers are disproportionately ones with claims the same pe-riod or the pepe-riod preceding the departure decision. The results also indi-cate that no reported claims during the period decrease the probability of leaving the insurer. This suggests that lower risk drivers stay with their current insurer and have no incentive to end their contract.
Traffic violations in terms of on-the-spot fines and convictions increase the probability of departure in all groups. However, speeding decreases the probability of leaving the company for females aged 22-25 aged 26-29.
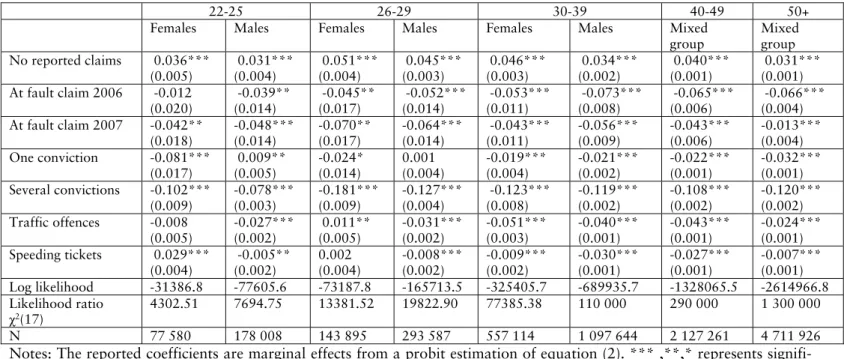
Table 3 reports the results of the marginal probit estimation of equation (2), where the relationship of traffic violations and previous claims on be-ing a long-term customer is estimated. Policyholders in the age groups 18-21 have been removed from the loyal customer analysis since they are too young to have been with the company for at least five years.8
8 A policyholder can take a driving license at the age of 18 in Sweden. After 1
Oc-tober 2006 it became illegal for individuals under 18 years old to own a vehicle. This implies that the age group 18-21 could have owned their vehicles, but could only have been customers for 0-3 years.
Table 3. Loyal policyholders
22-25 26-29 30-39 40-49 50+
Females Males Females Males Females Males Mixed
group Mixed group No reported claims 0.036*** (0.005) 0.031*** (0.004) 0.051*** (0.004) 0.045*** (0.003) 0.046*** (0.003) 0.034*** (0.002) 0.040*** (0.001) 0.031*** (0.001) At fault claim 2006 -0.012 (0.020) -0.039** (0.014) -0.045** (0.017) -0.052*** (0.014) -0.053*** (0.011) -0.073*** (0.008) -0.065*** (0.006) -0.066*** (0.004) At fault claim 2007 -0.042** (0.018) -0.048*** (0.014) -0.070** (0.017) -0.064*** (0.014) -0.043*** (0.011) -0.056*** (0.009) -0.043*** (0.006) -0.013*** (0.004) One conviction -0.081*** (0.017) 0.009** (0.005) -0.024* (0.014) 0.001 (0.004) -0.019*** (0.004) -0.021*** (0.002) -0.022*** (0.001) -0.032*** (0.001) Several convictions -0.102*** (0.009) -0.078*** (0.003) -0.181*** (0.009) -0.127*** (0.004) -0.123*** (0.008) -0.119*** (0.002) -0.108*** (0.002) -0.120*** (0.002) Traffic offences -0.008 (0.005) -0.027*** (0.002) 0.011** (0.005) -0.031*** (0.002) -0.051*** (0.003) -0.040*** (0.001) -0.043*** (0.001) -0.024*** (0.001) Speeding tickets 0.029*** (0.004) -0.005** (0.002) 0.002 (0.004) -0.008*** (0.002) -0.009*** (0.002) -0.030*** (0.001) -0.027*** (0.001) -0.007*** (0.001) Log likelihood -31386.8 -77605.6 -73187.8 -165713.5 -325405.7 -689935.7 -1328065.5 -2614966.8 Likelihood ratio χ2(17) 4302.51 7694.75 13381.52 19822.90 77385.38 110 000 290 000 1 300 000 N 77 580 178 008 143 895 293 587 557 114 1 097 644 2 127 261 4 711 926
Notes: The reported coefficients are marginal effects from a probit estimation of equation (2). *** ,**,* represents signifi-cance at the 1, 5 and 10 percent level respectively. Standard errors are in parentheses. See the main text for more details.
Table 3 further shows that the probability of being a loyal customer in-creases if the policyholder does not report a claim during the period. Simi-larly at fault claims during the period, and the one before, decrease the probability of being a loyal customer. The results further indicate that in-dividuals with traffic violations are less likely to be loyal customers.
Taken together the results in Table 2 and 3 suggest that policyholders with previous claims and traffic violations increase the probability of leaving the company after one year or less. Policyholders that commit traffic violations and report claims are less likely to be loyal customers. This suggests that the information asymmetry differs in the two groups; Short-term customers tend to be more risky, while loyal customers are less risky.
As previously mentioned there are lower frequencies of traffic violations and at-fault claims for females, and young females in particular, which implies that the results for these groups tend to be more sensitive to changes in the independent variables compared to male groups and mixed gender groups.
Another note of caution regards the results for traffic violations. Since these the policyholder’s private information both ex ante and ex post (if type is not revealed), we expect traffic violations to have an insignificant effect on the exit decision. There is no reason why policyholders should depart if they do not reveal their information to the insurer. We know that individuals who commit traffic violations are more likely to makes at-fault claims, which means that the observed relationship may have some indirect effect on the exit decision. There may, however, be other characteristics of these individuals that make them more prone to flee the company and less likely to be loyal.
5. Conclusions
In this paper we find that at-fault claims and traffic violations affect whether or not a customer is loyal to the insurance company; loyalty is defined as the number of years the customer stays with the insurer. Our results suggest that private information on convictions, e.g. for driving intoxicated, and/or on-the spot fines, such as for running red lights, in-creases the probability of leaving the insurer after one period or less. Con-sistent with these findings we show that risky behavior decreases the prob-ability of being a loyal customer.
Moreover, our results support the findings by Cohen (2005) in that previ-ous claims affect the departure decision when claims history with other insurers is private information. Once a claim is reported there are eco-nomic incentives for the policyholder to switch insurer and flee the claim record. The reason is that high risks can mimic a low risk one by underre-porting claims; thus the premium will be lower at a new insurer compared to staying with the current insurer to whom the claim is reported. As in the study by Cohen we cannot control for whether departing customers actu-ally purchase insurance elsewhere, since there is a possibility that some departing customers leave the insurer and drive uninsured or decide not to own a vehicle anymore.
Previous research has established that policyholders that commit violations are more likely to report an at-fault claim. Still, since traffic violations are the policyholder’s private information there are no reasons to expect that policyholders switch insurer with the purpose of hiding their risk type, at least if it is not revealed to their current insurer. Since we control for at-fault claims during the same period and the period preceding the departure, as well as the insurers’ risk classification, there are reasons to believe that the purpose of their departure is not to hide their risk type. There may,
however, be other characteristics of individuals who commit traffic viola-tions, unobservable to us and possibly observed by the insurer, that affect the departure decision. The characteristics of individuals who commit traf-fic violations need further investigation. Despite this, we conclude that risky driving behavior affects customer loyalty.
All in all, our findings suggest that short-term customers constitute an ad-verse selection of risks, and are more likely to commit traffic violations and report claims. Loyal customers, on the other hand, constitute a propitious (favorable) selection of risks, loyal customers are less likely to commit traf-fic violations and report claims. Another indicator of loyalty is that they are more likely to be claim-free during their time as a customer with the insurer. The results support the notion that the market suffers from oppor-tunistic behavior, since short-term departure customers are disproportion-ately those with claims; once a claim is reported there are incentives to switch company.
Our conclusion is that the automobile insurance market would benefit from sharing information about traffic violations and/or claim records with other insurers since this will likely reduce opportunistic behavior. In some countries premiums are already based on fines for traffic safety violations. If the policyholder receives a speeding ticket, the premium increases for some period of time, and with several tickets within some time period x, the premium increases dramatically. Premiums depending on traffic viola-tions further provide incentives to comply with the traffic laws. An addi-tional benefit is that violations are a more direct measurement of risky behavior and are likely better predictors of future claims than the current risk classification used by the insurers. With access to information about traffic violations and/or previous claims with other insurers, it is possible
for insurers to adjust the premium ex ante a claim rather than ex post, which increases the actuarial fairness.
It is possible to reduce the information asymmetry without high admini-stration costs, the reason being that insurers have access to a common claim register and can this check policyholders’ self-reports of previous claims from the year 2000 onwards. The insurers are not allowed to use this information to check the honesty of new customer, though. The inter-est in information pooling systems has been debated within the European Union, and systems of information pooling existed in Belgium and France but were ruled out by the European Commission since this behavior was considered as anticompetitive (Cohen; 2008). Despite this there are other ways to reduce the information asymmetry. In Italy, for instance, the indi-vidual has to bring a certificate of previous claims from the previous in-surer when applying for insurance from a new company. This reduces the inefficiency associated with non-observable claim history (See Ceccarini; 2007). Our primary conclusion is that accessing contract-relevant informa-tion on violainforma-tions and the claim history of new policyholders will reduce the market inefficiencies associated with the opportunistic behavior consid-ered in this paper. Approaching first best will nevertheless require amend-ments to the information-sharing between authorities and insurers.
References
Andreoni, J., Y.K. Che and J. Kim: 2006, “Asymmetric information about rivals’ type in standard auctions: an experiment”. Elsevier 59(2), 240-259.
Arvidsson, S.: 2010, "Does private information affect the insurance risk? Evidence from the automobile insurance market." Scandinavian working papers in economics (SWOPEC), 2010:1.
Ceccarini, O: 2007, “Does Experience Rating Matter in Reducing Accident Probabilities? A Test for Moral Hazard”. Working paper, University of Pennsylvania.
Chiappori, P-A. and B. Salanié: 2000 “Testing for Asymmetric Information in Insurance Markets”, Journal of Political Economy 108(1), 56-78.
Cohen, A: 2005, "Asymmetric Information and Learning: Evidence from the Automobile Insurance Market". The Review of Economics and
Statistics 87(2), 197-207.
Cohen, A: 2008, "Asymmetric Learning in Repeated Contracting: An Empirical Study". NBER Working Paper No. 13752.
Cohen, A. and P. Siegelman: 2010, “Testing for adverse selection in insurance markets”. Journal of Risk and Uncertainty (forthcoming).
Dell’Ariccia, G. E. Friedman and R. Marquez: 1999, “Adverse Selection as a Barrier to Entry in the Banking Industry”. The Rand Journal of
Economics 30, 515-534.
Finkelstein, A. and K. McGarry: 2006, "Multiple Dimensions of Private Information: Evidence from the Long-Term Car Insurance Market"
Amecan Economic Review 96(4), 938-958.
Forward, S., D. Kós-Dienes and S. Obrenovic: 2000, “Invandrare i trafiken, en attitydsundersökning i Värmland och Skaraborgs län” [Immigrants in traffic, a study of attitudes in two counties in Sweden] VTI report 454.
Forward, S: 2008, “Driving violations investigating forms of irrational rationality”. Digital comprehensive summaries of Uppsala dissertations from the faculty of social sciences 44. Uppsala University.
Golan, L.: 2005, “Counteroffers and efficiency in competitive labor mar-kets with asymmetric information”. Journal of Labor Economics 23(2), 373–93.
Laffont, J-J. and J. Tirole: 1988, “Repeated Auctions of Incentive Con-tracts, Investment, and Bidding Parity with an Application to Takeovers”.
RAND Journal of Economics 19(4), 516-537.
Marquez, R.: 2002, “Competition, Adverse selection and Information Dis-persion in the Banking Industry”. Review of Financial Studies 15, 901-926.
Pinkston, J.: 2009, “A Model of Asymmetric Employer Learning with Testable Implications”. Review of Economic Studies 76(1).
Waldman, M.: 1999, “Asymmetric learning and the wage/productivity relationship”. Journal of Economic Behavior & Organization 31(3).
Appendix A
The data covers the time period 2006-2008. Each observation in the data set contains the following information:
1. Demographic characteristics of the policyholder: individual id-number, year of birth, gender, home district and self-reported number of kilometers driven per year.
2. Residential area risk classification: the actuarially predicted risk in the neighborhood where the policyholder lives. Each type of insur-ance coverage (Traffic Insurinsur-ance, Limited Damage Insurinsur-ance and All Risk Insurance) has a classification. All policyholders have each classification regardless of coverage.
3. Car characteristics: vehicle model, brand, construction year, size of engine and vehicle-id.
4. Vehicle risk classification: the actuarial risk classification regarding the vehicle. As with residential area risk classification, each type of insurance coverage has a risk classification regarding the vehicle. 5. Private information: The number of on-the-spot fines for speeding
or other traffic offences of the policyholder during 2004-2007, and the number of convictions a policyholder had during 1973-2007. 6. The type of policy purchased: Traffic Insurance (required if the car
is in use but not if it is deregistered), Limited Damage Insurance, All Risk Insurance (not generally required for new cars since most manufacturers provide assurance) and Additional insurance. 7. Deductible Choice: The only contract providing deductible choice
8. Premium: The price of the insurance policy.
9. Period covered: From-date and to-date for each period in the con-tracts. The number of days with insurance is between 1-365 days for one period.
10. Realization of risk: Claims submitted by the policyholder and in-formation on which insurance covers the claim. It is also possible to identify the level of at-fault in the claim (none, partial or full re-sponsibility).
11. Driver information: The insurer’s information on the identity of the reported driver in an accident (not necessarily the policy-holder), age, gender and personal identity number and private in-formation according to (5). Note that additional drivers are the policyholder’s private information since the premium is not de-pendent on drivers other than the vehicle owner.
12. Other variables: Household identity, two or more policyholders in the same household share the same household-id.
Appendix B.
Table 1. Departing short-term policyholders (cluster adjusted standard errors)
18-21 22-25 26-29 30-39 40-49 50+
Females Males Females Males Females Males Females Males Mixed
group Mixed group No reported claims -0.003 (0.008) 0.002 (0.005) -0.007** (0.003) -0.005** (0.002) -0.008*** (0.002) -0.007*** (0.001) -0.003*** (0.001) -0.003*** (0.000) -0.002*** (0.000) -0.002*** (0.000) At fault claim 2006 0.172*** (0.040) 0.090*** (0.021) 0.059 *** (0.017) 0.034*** (0.010) 0.027*** (0.008) 0.036*** (0.007) 0.021*** (0.004) 0.017*** (0.002) 0.016*** (0.002) 0.007*** (0.001) At fault claim 2007 0.025 (0.025) 0.092*** (0.020) 0.024** (0.013) 0.034*** (0.010) 0.023*** (0.008) 0.018*** (0.006) 0.003 (0.002) 0.006*** (0.002) 0.002*** (0.001) 0.002*** (0.001) One conviction - 0.022 (0.024) 0.108** (0.083) 0.003 (0.004) 0.009 (0.011) 0.002 (0.002) 0.003*** (0.001) 0.002*** (0.000) 0.001*** (0.000) 0.001*** (0.000) Several convictions 0.006 (0.022) 0.006 (0.006) 0.019* (0.014) 0.034*** (0.005) 0.010 (0.011) 0.028*** (0.004) 0.021*** (0.005) 0.013*** (0.001) 0.008*** (0.000) 0.006*** (0.000) Traffic offences -0.007 (0.011) -0.000 (0.002) 0.002 (0.005) 0.002 (0.001) 0.000 (0.002) 0.002** (0.001) 0.006*** (0.001) 0.004*** (0.000) 0.003*** (0.000) 0.001*** (0.000) Speeding tickets 0.006 (0.012) 0.004 (0.005) -0.008** (0.002) 0.001 (0.001) -0.003 (0.002) 0.003*** (0.001) 0.000 (0.000) 0.001*** (0.000) 0.001*** (0.000) 0.001** (0.000) Log pseudolikeli-hood -6380.6 -16007.3 -12068.8 -27307.4 -13690.4 -27537.1 -31803.6 -57469.8 -85917.9 -111679.1 Wald χ2 125.03 358.55 252.05 635.87 335.69 679.73 837.06 1801.78 2058.06 6484.75 N 24 386 61 877 77 580 178 008 143 895 293 587 557 114 1 097 644 2 127 261 4 711 926
Table 2. Loyal policyholders and private information (clustered adjusted standard errors)
22-25 26-29 30-39 40-49 50+
Females Males Females Males Females Males Mixed
group Mixed group No reported claims 0.036*** (0.005) 0.031*** (0.004) 0.051*** (0.005) 0.045*** (0.004) 0.046*** (0.003) 0.034*** (0.002) 0.040*** (0.002) 0.031*** (0.001) At fault claim 2006 -0.012 (0.022) -0.039** (0.014) -0.045** (0.019) -0.052*** (0.015) -0.053*** (0.012) -0.073*** (0.009) -0.065*** (0.007) -0.066*** (0.005) At fault claim 2007 -0.042* (0.021) -0.048*** (0.014) -0.070*** (0.019) -0.064*** (0.015) -0.043*** (0.013) -0.056*** (0.010) -0.043*** (0.007) -0.013*** (0.005) One conviction -0.081*** (0.031) 0.009 (0.014) -0.024 (0.044) 0.001 (0.010) -0.019 (0.013) -0.021*** (0.005) -0.022*** (0.004) -0.032*** (0.003) Several convictions -0.102** (0.026) -0.078*** (0.009) -0.181*** (0.020) -0.127*** (0.011) -0.123*** (0.024) -0.119*** (0.007) -0.108*** (0.006) -0.120*** (0.005) Traffic offences -0.008 (0.013) -0.027*** (0.006) 0.011 (0.014) -0.031*** (0.006) -0.051*** (0.009) -0.040*** (0.005) -0.043*** (0.004) -0.024*** (0.004) Speeding tickets 0.029*** (0.011) -0.005 (0.006) 0.002 (0.010) -0.008 (0.006) -0.009 (0.006) -0.030*** (0.004) -0.027*** (0.003) -0.007*** (0.003) Log pseudoli-kelihood -31389.288 -77605.58 -73187.773 -165713.48 -325408.72 -689935.84 -1328065.5 -2614966.8 Wald χ2(17) 944.45 1759.10 2999.13 4150.75 14857.54 20052.56 56266.36 230000 N 77 580 178 008 143 895 293 587 557 114 1 097 644 2 127 261 4 711 926