STATENS VAG- OCH TRAFIKINSTITUT National Swedish Road and Traffic Research Institute
STABILITY AND MANCEUVRABILITY PERFORMANCE OF DIFFERENT TYPES OF BICYCLES
A literature survey and an experimental study by
Peter W Arnberg & Thomas Tydén
REPORT No. 45 A
STATENS VAG- OCH TRAFIKINSTITUT
National Swedish Road and Traffic Research InstituteSTABILITY AND MANCEUVRABILITY PERFORMANCE OF DIFFERENT TYPES OF BICYCLES
A literature survey and an experimental study
by
Peter W Arnberg 85 Thomas Tydén
REPORT No. 45 A Stockholm 1974
3.1 3.2 3.3
4.1 I
4.24.2.
4.2.
4.2.
4.2.
4.2.
4.2.
4.2.
4.2.
4.2. .
4.2.
4.3 4.3. 4.3. 4.3. 4.3. 4.3. 4.3. 4.3. d ( 4 0 0 0 ( D m m V O U I -A C O N I c o m m .i.i CONTENTS 'ABS TRACT 1N TRODUC Tl ONSURVEY OF EARLIER EXPERIMENTS .
BAC KGROUND 'EXPERIMEN TS SUMMARY
THE PRESEN T EXPERT-MEN T
PURPOSE _
. METHOD Subiects §igzcl es Test stations Pre~ test Training of subjects Procedure interviews Analysis of data Statisticai methods RESULTS Organization Explanation of terms Presentation of dataCombined results from all ten test stations (Trials 1 and 2 in regard to time expenditure, number of errors committed, and assessments at
1223221395 Pelenss
Time expenditure
.1 .2 Number of errors committed
.i .3 Assessment of the subjects' balance
Page \ I U I U I L n 0 0 0 0 0 0 0 0 0 0 20' 2O 20 20 21 '21"
21
22
22 I
22
'22 22 22 24 254.3.4 Comparison of results from Trials l and 2 regarding time expenditure and number of errors committed
4.3.5 Presentation and analysis of results from each individual test station
4 -3 -5-
I911;__L991<jng_tzes':vzezés_1vbl'5:siding. '
4.3.5. l .1 Number of errors committed
4-3'5'2
IEELZ;-31éi lQELQ lXPPIXVPEI JVXSJIDEE
4.3.5.2.l Time expenditure
4.3.5.2.2 Number of errors committed
4-3 -5-3 ' 1251.31;£1499.ssiwssejzeeésnhlssl:Béirs
4.3.5.3.] Time expenditure
4.3.5.3.2 Number of errors committed
4-3-5-4 Test 4. Block slalom '
4.3.5.4.] ting-£55553};
4.3.5.4.2 Number of errors committed
4-3-55
Isat§;_Biéir1qulenss
4.3.5.5.l Time expenditure
4.3.5.5.2 Number of errors committed
4.35.6
Is§*_é_-._B..e_'ez_rjélr1s1
4.3.5.6.l Time expenditure
4.3.5.6.2 Number of errors committed
4-3-5 -7 IsstZ;_Bléir19_12_<15_i:e's_
4.3.5.7.l Time expenditure
4.3.5.7.2 Number of errors committed
4-3-528
Esau};-§Ie:i999:z_tz<1'99_cs_
,4.3.5.8.l Time expenditure
43-5-9 Isat 2;3_is qujbzeaqhm ewge
4.3.5.9.l Time expenditure
4.3.5.9.2 Number or errors committed
4.3 -5- 1 0
91:19:-5.92.6919599.test-4.3.5.l0.l Time expenditure
4.3.5
.lO.2 Number of errors committed'
Page 26 28 28 28
'29
29 29 30 3O 30 3] 3] 3T 32 32 32 33 33 33 34 .34 34 35 35 36 36 36 37 37 37Page
4.3.6 Results From the interviews I ' 38
4-3 -6- 1
éfEéfiiEEEE lDLQQISJPEQED95°}.BSLEETPDES.9f.159319151?
38
ée pgiheié
V
V
4-3 .6.2 ' §9f §£9§£ 9§
'
'
38
4-3-6-3
§9912L93F£ E
_
'
39
4.4 A BRIEF SUMMARY OF THE RESULTS 40
5
DISCUSSION
'
41
PREFACE AND AC KNOWLEDG EMEN TS
This study was initiated and sponsored by The National Swedish Road. Safety » Office.
The present report was taken From a larger Swedish report which gives more detailed infarmation concerning the literature survey.
We thank Bertil Norén For his help with the experiment and Lenore N . Arnberg for her assistance in the writing of this English edition.
ABSTRACT
The following report consists of two parts: a survey of earlier investigations concerning bicycles characterized by extreme handlebars and small. wheel diameters and an experi-ment with 18 twelve-year-old boys in which. six different bicycles were evaluated in regard to their manoeuvrability and stability performance in a series of ten tests.
\
in the experiment the bicycles used were all currently available on the Swedish market. Three different models distinguished by differences in-frame construction, wheel dia-meter, and wheelbase, I) and two different handlebar types, one standard and the other extreme in height, were used. The tests were performed at ten separate stations and were designed to measure skills similar to those required in actual traffic situations.
-The experiment was repeated once so that at its conclusion, eighteen subjects had ridden six bicycles at ten test stations twice, for a total of 2,160 trials.
The results from the experiment showed that bicycles with extreme handlebars gave a worse rnanoeuvrability performance than bicycles with standard handlebars, affecting both the time expenditure and the number of errors which were committed. The modern rodeo bicycle caused approximately 50% more errors than either of the other bicycle models. The results were supported by interview data from the subjects and by analyses of bicycle accident from other studies which indicated that bicycles with extreme
handlebars were more dangerous than bicycles with standard handlebars in actual traffic
situations .
INTRODUCTION
At the end of the l9th century andin the beginning of the 20th century, the bicycle played a central role in the development of modern technology and transportation, influencing the evolution of the ball bearing, the pneumatic tire, the automobile, and rthe airplane. it was also the first machine to be mass produced for transportation and
is one of man s most efficient means of transportation in terms of energy consumption in, grams per kilometer. For example, a man when walking consumes 75 calories per gram per kilometer; when riding a bicycle, heconsumes only l5 calories per gram per
kilometer. Since its prominence in the beginning of this century, the bicycle has once again become popular, and the number of people using bicycles has greatly increased during the last decade. Each year 35 40 million bicycles are produced (Wilson, 1973), and in many countries the bicycle is the major means of transportation, especially in underdeveloped countries, but also in countries such as the Soviet Union and the Peoples Republic of China. In addition to its advantages as an inexpensive, efficient, and fuel free form of transportation, the bicycle provides both recreation and exercise and it has no detrimental environmental effects. Despite the obvious benefits in
connection with bicycle riding, there are certain risks involved which require closer
examination .
Each'year about 2,000 bicyclists are injured or killed in Sweden. According to the National Swedish Central Bureau of Statistics, in the year 1972, 138 were killed when riding bicycles, 652 were severely injured, and 1,102 were slightly injured. One third were children under 14 years of age. Since these statistics refer only to the traffic accidents which involved police investigation, it is assumed that the actual number of bicycle accidents causing bodily injury is higher than the statistics show. This assumption is validated in a study by Thorson and Sande 0969) which showed that of approximately 350 people treated in a hospital in Uppsala, Sweden, in l966, for injuries caused by bicycle accidents, less than 40 were entered into the official statistics. Using this study as a basis, the real number of bicycle accidents causing bodily injury would be more than nine times higher than what the official statistics show. The number of persons killed or injured severely enough to require medical care in a hospital should, in that case, be about 18,000 per year.
.According to a recent report by Hayes (T974), bicycle sales in the United Statesvhave tripled over the past ten years. 1) Between T970 and T973 alone, more than 45.6 million new bicycles have beenadded to the transportation mix, and an estimated
T6 million will be added by 1974. The concomitant increase in the rate of bicycle-related accidents and deaths is alarming. The National Safety Council reports that in T972, approximately l, 100 deaths and40,000 disabling injuries resulted from motor vehicle-bicycle collisions, an increase of approximately 140 percentfrom the figure in T960. Bicycle injuries of a more minor nature havealso increased substantially during this 12-year period.
Berger (T969) has also studiedthe risks of bicycling, especially for children. The data showed that during the years T964 l966, in the Federal Republic ofGermany, children represented the age group that were most often killed or wounded in traffic accidents. Bicycles, with or without a motor, were frequently involved in these accidents. Statistics from the T973 report of the National Safety Council show that in the United States, as well, the bicycle accident problem predominantly involves children. The age group 5-15 accounts for about two-thirds ofthe occurring injuries and one-half of the deaths resulting from bicycle accidents.
w . _ e c. , _ - . - w m» _ . _VV ' , _, . s...
With the advent of the new, modern "high rise" bicycles designed to resemble motor cycles (high, wide handlebars and elongated, narrow seats), the safety aspects of these bicycles have been an area of much concern, and recentstudies have been done in which their performance is compared with that of other types of bicycles. Among these, Craft, Show and Cartlidge (T973), in a recently published study in Great Britain, analyzed 405 bicycle accidents involving children under 15 years of age which resulted in hospital treatment. Through the use of questionnaires, they were able to determine the type of bicycle involved in the accident. The results showed that bicycles with extreme handlebars caused decidedly more injuries (the difference was significant at
the .01 percent level). Borrowed and newly bought bicycles with extreme handlebars seemed to be an especially dangerous combination. The authors suggested that a lack of familiarity with riding bicycles which had extreme handlebars was probably a causative factor in many accidents and that parents and children ought to be aware
of the extra risk involved when these circumstances arose.
I) From 3.7 million units to 7.5 million units between T960 and 1968, to more than 15.3 million units in T973
According to the National Safety Council (1970), there have been many complaints about the newly designed bicycles in the United States. Howel (1968) reported a strong increase in skull and face iniuries among children who were using the "high rise bicycle. 1he report showed that 45' percent of all children possessing bicycles owned the modern type and that these bicycles were involved in 57 percent of all injuries involving bicycling in the United States. In a survey of 2,800 bicycle accidents '(Rector, 1974) involving school-age Children conducted over the three-year period
1970-1972 in Los Angeles, it was strongly suggested that the "high rise bicycle was more hazardous than the conventional type and that specific accident-«causing design aspects should be isolated and studied more throughly.
The data support the view that children are frequentlyinvolved in bicycle accidents and that bicycles with extreme handlebars and small wheels are involved in a significant proportion of these accidents. Further investigation is necessary and, therefore, a review of experiments concerning the effects of extreme handlebars and Small wheel diameter on the performance aspects of bicycles will be presented.
3.1
3.2
SURVEY OF EARLIER EXPERIMENTS
wished to study . BACKGROUND
Even before the new types of bicycle models were introduced on the market, experi mental studies had been carried out concerning bicycle design. One experimental method involved the use of mathematical'models of the rider bicycle system . Data for these models were prOvided from the results of tests run on various bicycle types.
Stassen and van Lunteren (1969) and Rice and Roland (1970) have developed such models and the latter specifically tested a bicycle with extreme handlebars and small wheels. Godthelp(1974), another systems Oriented researcher, constructed an instrumented
bicycle and through this method was able to isolate the specific variables which he
.
In another type of investigation, initiated because of the assumed extra risk associated with the new bicycle models, Campbell, Foley and Pascarella (1971) studied both new and standard bicycle models under normal conditions by comparing their accident rates. Lewis (1973) and Mortimer, Domas and Dewar (1973) also studied the differences between the new and standard models by comparing their performance results in various tests, 6.9. tests involving manoeuvrability, stability, and braking.
EXPERIMENTS
Lewis (1973) carried out an investigation of the effect of wheel diameter on manoeuvra-bility and braking performance in an experiment involving approximately one hundred children between 8 and 11 years of age. The (results showed no significant differences between bicycles with varying wheel diameters. He also referred to Starks and Lister (1960) and to the Consumers Association (1964 and 1968) who had also compared bicycles with different wheel diameters and found no significant differences either. Campbell, Foley and Pascarella (1971) compared three bicycle models by studying the correlation between riding distance and accident occurrence. For this investigati on, police, hospital, and self-reported accidents from 500 schoolchildren during a six-month period were used. The bicycle types consisted of standard, lightweight, and "high rise" (extreme handlebars) models. The differences between the bicycle types
were not found to be statisticallysignificant, I One of the objections to this study is that the 500 children who participated in the investigation were volunteers and came from a larger group of 2,369 children (a loss of about 80%). It is possible that the volunteers were the most skilled riders and were, thus, able tohandle even the difficult "high rise".bicycle without trouble.
Rice and Roland (T970) have developed a mathematical model of the bicycle. They tested two bicycles, a lightweight standard bicycle and one having small wheels and high handlebars, in a series of tests which measured braking, acceleration, and serpen~ tine manoeuvring . There was no significant difference between the two types of
bicycles regarding acceleration and serpentine manoeuvring performance, but in
brak-ing, the "high rise" bicycle was more sensitive to pitchover, even at speeds as low
as T0 MPH Due to the limited number of Subiects, only f0ursubiects were used in this experiment , the validity of the data is somewhat reduced.
Mortimer, Domas and Deward (T973) also measured manoeuvrability performance in different tests, e.g. riding in a circle, figure 8, and slalom course. Bicycles with extreme handlebars, racing, and standard bicycles were compared. The racing bicycle showed the worst results in this experiment.
Godthelp (T974), in a literature review, listed some of the most relevant properties related to bicycle stability and manoeuvrability performance:
T. The mechanical trail (Herfkens, T949, Jones, T970)
2. The moment of inertia of the front wheel around the Y axis (He-rfkens, T949, Rice and Roland, T970)
3. The moment of inertia of the front wheel around the steering aXis ('Herfkens, T949) 4. The distance between the seat and the handlebars (Godthelp, T974)
He criticized the field studies interms of the handling of the bicycle properties as well as the tests designed to measure these properties. Godthelp suggested that in
order to realisticaliy assess the bicycle-related properties, it was necessary to isolate them and to test them individually on one specific bicycle. in regard to the tests designed to measure the properties, he suggested that tests be designed which simulated
3.3
Godthelp'has developed a bicycle on which the four aforementioned properties could be varied. He tested four Sixteen-year-old subjects in a series of manoeuvrability and stability tests which consisted-of straight course riding, slow riding, curve riding, and zig zag riding with side wind and road uneveness used as hindrances. The subiects were instructed to ride at comfortable and at accelerated speeds with one and with both hands on the handlebars for each of these speeds.
Most of the results from each test showed strong interrelationships between the four
varied factors. Godthelp especially emphasized the importance ofthe distance between the seat and the handlebars. He suggested that when the body assumed a horizontal
position during riding, the effect of the extra pressure .on the handlebars could act as a resistanceagainst side wind and road unevenness hindrances and, thus, could increase high-speed stability. I The disadvantage of the horizontal position was that it worsened manoeuvrability performance .
SUMMARY
In the previous survey of experiments, both extreme handlebar and small-wheel factors have been investigated in different ways. The role which extreme handlebars play in manoeuvrability and stability performance is not clear. Bicycles with extreme handle-bars appear to be more sensitive to pi'tchover than lightweight standard models
(Rice and Roland). Although Godthelp doesn t suggest that bicycles with extreme handlebars are, more dangerous than other types, he does stress therelationShip between pressure on the handlebars and high-speed stability. When extreme handlebars are used, the rider s upright position on the bicycle reduces the possibility of weight distribution on the handlebars. Small-wheeled bicyclesdo not seem to cause problems in
manoeuvrability or stability performance.
In some of the experiments,wheel diameter and handlebar faCtors have not been
isolated (standard bicycles were compared with small-wheeled bicycles having extreme handlebars). Also, the small number of subiects and limited number of performance tests in many of the studies reduce the validity of the data. Both of these factors, as well as the need for further study of the specific role which extreme handlebars play in manoeuvrability and stability performance, were taken into account in the planning of the present experiment.
4.1
4.2 4.2.1
4.2.2
THE PRESENT EXPERIMENT
- PURPOSE
The purpose of the experiment Was to test the stability and manerVrability performance of six different bicycles with special regard to. the modern rodeo bicycle (extreme
handlebars, small wheels, and an elongated seat). ME THOD
Subiects '
. Eighteen boys, approximately twelve years of age, in sixth grade in a Swedishschool were selected for the experiment. The subiects were matched according to riding experience: in the two years preceding the experiment, each boy had ridden a bicycle daily. Also, one third of the subjects owned the rodeo bicycle, one third owned the standard, and one third owned the small-wheeled type. All. of the subjects originally selected participated, in the experiment.
Bicycles
-Six bicycles, all currently available on the Swedish market, were used in the experi-ment. Three bicycle models and two handlebar types were tested. The bicycle models consisted of a standard bicycle, a small-wheeled bicycle, and the popular rodeo , bicycle, characterized by a small wheel diameter, elongated seat whose position
places the rider s centre of gravity farther back toward the rear of the bicycle than in the other models, and extreme handlebars. Another differencebetween the rodeo bicycle andthe other models used in theexperiment is its three-speed gear system. Since rodeo bicycles are sold with gears in Sweden and the experiment was restricted . to bicycles available on the Swedish market, this variable could not be eliminated.
To control the effects of the gear-system to as great an extent as possible, the subiects .
were not allowed to change gears during the tests; they were instructed to select a
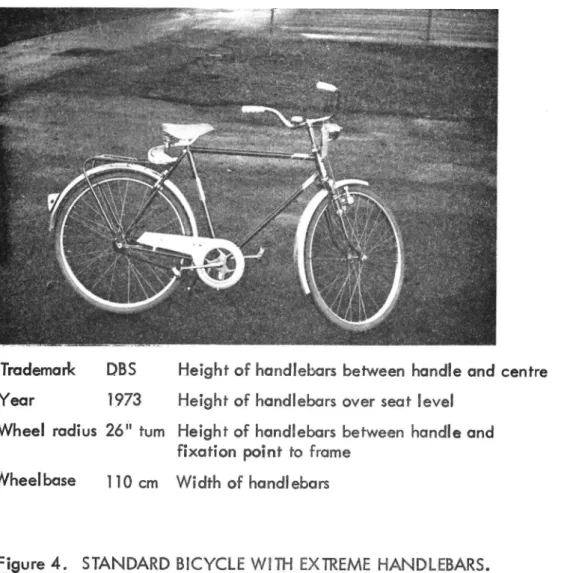
Each of the three bicycle models was tested with standard and with extreme handlebars. Variables in the Frame construction (size, design, andweight), Wheel radius,
wheel-base, 'and handlebar dimensions of the six bicycles are shown on the Following . pages.
TO.
M STANDARD BICYCLE WITH STANDARD HANDLEBARS.
. t h ' U H r" ' A > t I i r' -~' a " " . .~ r* ;:r7, »~:-wtr1~%~éwx ' *- 3,.t r uh «rI 9 rr- *1,- a r . .. ',. , - ' \ - . . .7 v x '3'-"\\ a . _ u 5 ; ' A _ .. , . *M 53" - ~ r . . V ' 1"" 4 ' r» 1 . I - Myl . -. ,'u ;+}r_2 ,: a. .V .V 0 H V A . - mw ,t _.e ~
V' Trademark DBS Height of handlebars between handle and centre 12 cm 'Year 1973- Height of handlebars over seat level l5 cm Wheel radius 26" tum Height of handlebars between handle and 25 cm
fixation point to frame
Wheelbase 110 cm Width of handlebars 52 cm
Figure 4. STANDARD BICYCLE WlTH EXTREME HANDLEBARS.
Trademark DBS Height of handlebars between handle and centre 32 cm Year 1973 Height of handlebars over seat level 37 cm Wheel radius 26 turn Height of handlebars between handle and 45 cm
fixation point to frame
ll.
Figure 5. SMALL-WHE ELED BICYCLE WITH STANDARD HANDLEBARS.
Trademark Crescent Height of handlebars between handle and centre ll2 cm Year l973 Height of handlebars over seat level U4 cm Wheel radius 20" turn Height of handlebars between handleiand 32» cm
fixation point to frame
Wheelbase 98 cm Width of handlebars 58 cm
Figure 6. SMALL WHEELED BICYCLE WiTH EXTREME HANDLEBARS.
Trademark Crescent Height of handlebars between handle and centre 34 cm Year , 1973 Height of handlebars over seat level 48 cm Wheel radius 20" turn Height of handlebars between handle and 60 cm
fixation point to frame
12.
Figure 7. RODEO BICYCLE WITH STANDARD HANDLEBARS.
m"' :34 . ~ 44 a L ". 1r * ' " "-l . ". r- I z ' \ n Trademark Year Wheel radius Wheelbase Monark 1973 20" turn 97 cm .F ' 2..»
Height of handlebars between handle and centre 22 cm Height of handlebars over seat level 2-7 cm Height of handlebars between handle and 35 cm fixation point to frame
Width of handlebars 60 cm
Figure 8. RODEO BICYCLE WITH EXTREME HANDLEBARS.
Trademark Year Wheel radius Wheelbase Monark T973 20 " turn 97 cm
Height of handlebars between handle and centre 30 cm Height of handlebars over seat level 33 cm Height of handlebars between handle and 47 cm fixation point to frame
4.2.3
13.
Test stations
The subiects were required to ride the bicycles in a series of ten tests which were conducted at ten separate stations. In these tests, competence in skills related to those necessary for actual traffic situations was measured. The tests were carried out on a dry, asphalt surface.
Test 1 . Looking backwards while ridi;g_
While riding a fifteen-metre course, the subject was required to look backwards and observe the combinations of numerals which the experimenter held up. After he had returned to a forward-riding position, the subject called out the numbers which he had observed. The subiect was not allowed to touch either foot to the ground or to touch the sidelines with the bicycle wheels. This was the only test in which no
measurement of time was made. Errors consisted of wrongly iudged numerals, touching the sidelines with the bicycle wheels, or touching afoot to the ground. The number of errors and an assessment of the subiect's balance were recorded by the experimenter. fi_gir_e_9_. Drawing showing subject in Test T .
50cm lSrn
14.
Test 2. Riding slowly between two lines
The subject was required to ride as slowly as possible between two lines. The length of the course was fifteen metres. The first five metres were used for stabilization and the riding speed was taken for the last ten metres of the course. In this test the longest time was the best one. Errors consisted of touching a foot to the ground or touching the sidelines with the bicycle wheels. Two seconds were counted for each error.
The time required for the accomplishment of the task, the number of errors, and an assessment of the subject s balance were recorded by the experimenter.
Figure l0. Drawing showing subject in Test 2.
10 " 40cm
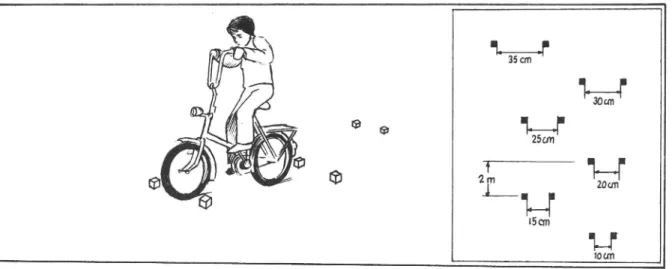
Test 3. Riding between wooden block pairs
The subject was required to ride through a series of block pairs, spaced at measured intervals, with both front and rear wheels passing through all pairs. Errors consisted of touching a foot to the ground or touching or omitting a block pair. Two seconds were counted for each error. The time required for the accomplishment of the task, the number of errors ,and an assessment of the subject s balance were recorded by the experimenter .
Figure ll . Drawing showing subject in Test 3. WJ 30cm
9 e
'L J'
25cm te
ml
15cm 10cmTest 4. Block slalom
The subiect was required to ride a slalom course marked by wooden blocks, with front and rear wheels passing each of the ten blocks. Errors consisted of touching a foot to the ground or touching or omitting a block. Three seconds were counted For each error. The time required for the accomplishment of the task, the number of errors, and an assessment of the subject's balance were recorded by the experimenter. Figure 12. Drawing showing subiect in Test 4.
16.
Test 5. Riding balance
The subiect was required to ride the length of a curved course with only the left hand on the handlebars, to turn around while shifting hands, and to ride in the opposite direction with only the right hand on the handlebars. Errors consisted of touching a foot
to the ground or touching a sideline. Two seconds were counted for each error. The time required for the accomplishment of the task, the number of errors, and an assess-ment of the subject's balance were recorded by the experiassess-menter.
Figure 13. Drawing showing subiect in Test 5.
5
m
Test 6. Relay ridilg_
The subject was required to move balls (similar to tennis balls) from one cone to another with one hand. The ball on the first cone was moved to the second, and the ball on the third cone to the fourth. The ball on the fifth cone was transferred to the opposite hand before being placed on the last cone. Errors consisted of touching a foot to the ground or dropping a ball . Two seconds were counted for each error. The time required for the accomplishment of the task, the number of errors, and an assessment of the subiect s balance were recorded by the experimenter.
Figure 14. Drawing showing subject in Test 6.
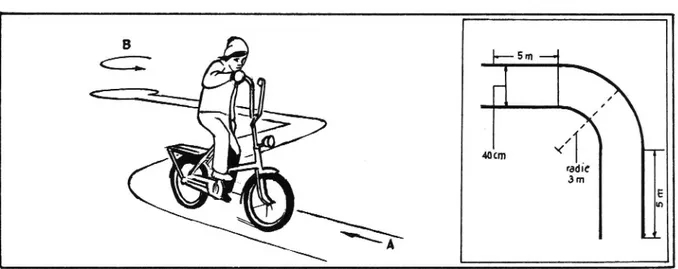
Test 7. Riding in a circle
The subject was required to ride into a circle, ride around the circle three times, and ride out again. Errors consisted of touching a foot to the ground or touching the circle lines. Two seconds were counted for each error. The time required for the accomplish-ment of the task, the number of errors, and an assessaccomplish-ment of the subject's balance were recorded by the experimenter.
Figure 15. Drawing shoWing subject in Test 7.
18.
Test 8. Stationary balance
The subject was required to ride forward to a small circle, to stop there so that the front wheel'remained within the circle, and to keep his balance For as long as possible. In this test, the longest time was the best one, and there was no possibility of errors.
The time required for the accomplishment of the task and an assessment of the subiect's balance were recorded by the experimenter.
M Drawing showing subject in Test 8.
Test 9. Riding through narrow gates
The subject was required to ride through two pairs of gates spaced at three metres apart. The width of the gates was ten centimetres wider than the width-of the handlebars. Errors consisted of touching a foot to the ground or touching a gate stick . Two seconds were counted for each error. The time required for the accomplishment of
the task, the number of errors, and an assessment of the subiect s balance were recorded by the experimenter.
19.
Figure 17. Drawing showing subiect in Test 9
5cm 5cm
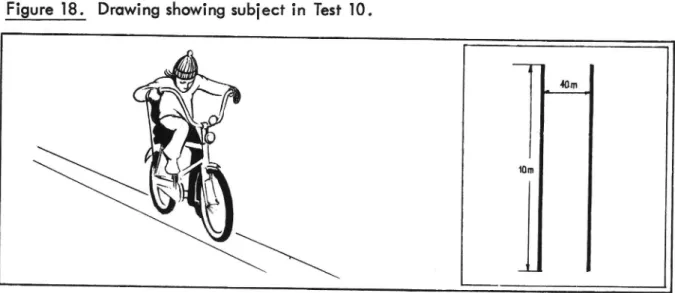
Test 10. Acceleration test
The subiect was required to accelerate as quickly as possible while riding between two lines. He was required to remain seated for the duration of the test. Errors consisted of rising from the seat, touching the sidelines, or touching a foot to the ground. Two seconds were counted for each error. The time required for accomplishment of the task, the number of errors, and an assessment of the subiect's balance were recorded by the experimenter .
Figure l8. Drawing showing subject in Test 10.
4.2.4 4.2.5 4.2.6 4.2.7
20.
Pre- testA pre- test wasconducted with twelve-year-dd boys from another school in the same town that the subjects were from . The main purposes of the pre test were to work out appropriate measures of the time to be adjusted for errors in each testand to train the experimenters so that they could record the results in a standardized manner.
Training of subjects
All of the subjects were allowed one practice ride on each ofthe six bicycles at all - '
test stations .
Procedure
The subjects'were instructed as to the purpose of the eXperiment. It was explained to ' them that time would be counted for errors and, therefore, that it was most effective for them to ride only as fast as they were able to ride without making errors.
To control systematic effects such as training and motivation, the order of bicycles and test stations Was randomized over the subjects. The experiment was repeated once so ' that at its conclusion, eighteen subjects had ridden six bicycles at ten test stations
twice, for a total of 2,160 trials.
l ntervi ews
After the experiment, each subject Was interviewed by a psychologist in order to as-certain how he had felt about the different bicycles, i.e. which he had liked/disliked
the most, T which he had found the most/least difficult to accomplish the tests with, and which he had felt was the safest. The data from the interviews were later compared with the experimental data.
4.2.8.
4.2.8.1
4.2.8.2 21. Analysis of Data Statistical methodsAnalyses of variance of the total time expenditure (actual riding time plus time added or deducted for errors) were performed to evaluate the effects of the following five variables: bicycle models, handlebar types, subjects, test stations, and trials ("trials" represents the two times which the experiment was conducted). A mixed block design model was used where the variables bicycle models, handlebar types, and trials were fixed and where subiects and test stations were regarded as random
I (\Niner l970) . Chi squaretests of the number of committed errors for bicycle models and
1)
handlebar types were performed according to the goodness of fit method.
[Qteissimsifesti
In order to evaluate the interaction effects, an analysis of variance was performed (randomized block design, Kirk l968) . ¥
The results showed that there was no significant interaction effect betWeen bicycle
2 .
models and handlebar types. ) _
There was a significant interaction effect. at the l % level between bicycle models and test station-subjects, a factor which encouraged the presentation of the results from
each of the ten tests.
9
There was no significant interaction effect between handlebar types and test station-:-subiects .
) The empiri cal distribution of the number of committed errors for bicycle models and handlebar types was tested against a theoretical rectangular distribution.
2) in the-first triai the F value of the interaction effect was 2.22. with 0 df of 2/358 and in the second trial the F-value was 2.49 with a df of 2/358.
4.3
4.3.1 4.3.24.3.3.1
*4.3.3.l.l 22. RESULTS OrganizationThe results will be presented the following order:
l . Combined results from all test stations in regard to time expenditure, number of errors committed, and assessments of the subjects balance
2. Comparison of results from Trials 1 and 2
3. Presentation and analysis of results from each test station 4. Results from interviews
5. A brief summary Explanation of terms
In the following tables, time expenditure is used to represent the actual riding times as adi usted for errors. Actual riding time consists of the time required by the subject to complete the task. In Tests 3 thru 7, 9, and 10, a fast time represents the best per-formance while in Tests 2 and 8, it represents the worst perper-formance.
In Tests 3 thru 7, 9, and TO, the time allotted for errors was added to the actual riding time and in Test 2, where the longest time was considered the best, the time allotted for errors Was deducted from the actual riding time. Test l did not involve the
meaSUre-ment of time and Test 8 did not involve the measuremeaSUre-ment of errors.
Presentation of data
§s>mblne§{ 531:s_£L°rr19lLIse_te.§:§:9_ Osi zisl en i'1590:4Isjlniiséeseéiiyss;
number of errors committed, and assessments of the subjects' balance Time expenditure
A statistically significant difference (at the . i % level) with regard totime expenditure was obtained between the two handlebar types. There was no significant difference
23.
between the bicycle models, Averages of the total time expenditure (actual riding time plus time-addition or time-deduction for errors) for each of the bicycle types are shown
in Table 1.
Table l 7 Average time in seconds for time expenditure in all test stations combined (excluding Station l) for the different bicycle typesx
(Bicycle model F 2/l70 = 2.8, handlebar type F l/l70 = l6.2 XX)l) _' BICYCLE MODEL
Standard Smal l - Rodeo Mean
HAND LEBAR
Wheeled
_
TYPE Standard 48.4 45.5 50.3 48. l
Extreme 50 . 8 53. O 54.5 52 . 8
Mean _ 49.6 49.3 52.4 50.4
Table l shows that the best result was obtained by the small-wheeled bicycle with standard handlebars. When extreme handlebars were used on the small-wheeled bicycle the results change drastically. The rodeo bicycle showed the worst results of all the bicycle models tested both with standard handlebars and with extreme ones, despite the additional advantage of the gear system .
1)
x . designates significance at the5% levelxx designates significance at the l°/o level xxx designates significance at the . l 0/0 level
l.3.3.l .2 Number of errors committed
The total number of errors committed for eaCh bicycle type is presented in Table 2. Table 2 Total number of errors committed in all test stations combined
(excluding Station 8) for the different bicycle types [Chi square
for bicygle model (df=2) = 59.990 , for handlebar type (df=1)
= 61 .9 J . BlCYCLE MODEL
Standard Small- Rodeo Total wheeled
HANDLEBAR Standard .l60 T44 _ 25] 555
- TYPE Extreme 235 26] 354 850
, Total 395 . 405 605 T405
A statistically significant difference (at the .l % level) was obtained both between bicycle models and between handlebar types. The standard and the small-wheeled bicycle showed nearly an equal number of'errors and the rodeo cycle showed approxi-mately 50% more errors. Bicycles with extreme handlebars caused approxiapproxi-mately 50% more errors than bicycles with standard handlebars. The results are illustrated in the
diagram below. I
Figure 19. Total number of errors committed by the different bicycle models and handlebar types. ERRORS COMMITTED ' EXTREME. sou-g \ Goo RODEO \ // STANDARD s SMALL- / V \ s WHEELED 40 o .. STANDARD . / ¢ \ \. MW. ,
1
24.N
A
/ /
BICYCLE MODEL
/
2
U r m
-l I < > 'U m D I)25.
A comparison was also made of the results from the rodeo bicycle and the combined results from the Standard and small-wheeled bicycles regarding the total number of v errors committed, which gave a significant difference at the .1 % leyel .
4.3 .3.1 .3 Assessment of the subjects balance
The experimenters' assessments of the subiects balance ability were made in good (l point), medium (2 points), and poor (3 points) ratings.
The differences between the bicycle models and the handlebar types are shown in
Tables 3 and 4.
Table 3 Average balance estimations for the bicycle models at Test Stations 1-10 in good (1 point), medium (2 points), and poor (3 points) ratings
TEST STATION
.12
3
4
5
6
7
8
9'10
CYCLE Standard l 7 1 7 l 7 1 9 1 8 1 7 2 1 1 l 4 1 4 17 5
' - . . . 2. . . .2
MODEL Small wheeled 1 7 2 0 1 7 2 2 2 0 1 9 1 8 0 1 4 1 5 18 I Rodeo 2.1 2.4 2.1 2.4 2.3 2.0 2.0 2.3 1.3 1.6 20.5 Table 4 Average balance estimations for the handlebar types at TestStations
1-10 in good (l point), medium (2 points), and poor (3 points) ratings
TEST STATION
1 2 3 4 5 6 7 8 9 10 Total Standard 1.7 1.7 1.7 2.0 1.8 1.6 1.9 2.0 1.4 17.0 . Extreme 1.9 2.3 2.0 2.3 2.3 2.1 2.1 2.2 1 1.6 20.3 f -d (n ix: iANDLEBAR TYPEThe results were similar to those found earlier; the standard bicycle showed the best results and the rodeo bicycle the worst. Standard handlebars showed better balance
4.3.4 Comparison Of results fromTrials l and 2 regarding time expenditure and number of
errors committed
1)
A small training effect was found between Trials l and 2 as regards time expenditure and number of errors committed. The subiects used a mean total time expenditure of 52.5 seconds in Trial 1 and 48.4 seconds in Trial 2 (see Tables 5 and 6). y The subiects also committed more errors during Trial 1 than during Trial 2; 746 and 659 respectively
(see Tables 7 and 8). The training effect did not, however, influence the established performance relationships betWeen the handlebar types or between the differentbicycle
3)
models, which remained consistent in both trials. The rodeo bicycle model and the extreme handlebar type consistently showed the worst results in regard to both time expenditure and number of errors committed (see Tables 5 thru 8).
Average time in seconds for total time expenditure (in all test stations Table 5
combined (excluding Station 1) for Trial l (Bicycle model F 2/85: l .3,
handlebar type F 1/85: 8.7 )
BICYCLE MODEL
a Sta nda rd Smal l- Rodeo Mean
HANDLEBAR
Wheeled
TYPE Standard 50.7 i 47.3 51.5 49.8
Extreme 54 . 4 54 . l 56 . 8 55 . 1
Mean 52.6 50.7 54.1 52.5
Table 6 Average time in seconds for total time expenditure in all test station s combined (excluding Station l) for Trial 2- (Bicycle model F 2/85-==l .9,
handlebar type F 1/85=5.2")
.
(BICYCLE MODEL
_ Standard Smal l - Rodeo Mean
HANDLEBAR
wheeled
TYPE Standard 46. 0 43 .7 49. 0 ' 46 . 2
Extreme 47 .3 52 . 0 52 .l 50 . 5
Mean 46.7 47.8 50.6 48.4
i) F = 12.2 (df l/l70) which is significant at the .l % level 2) Chi-square (df==l) = 5.5 which is significant at the .T% level
3)
F = .60 (df 2/l70) for the difference in results between bicycle models andTable 7 HANDLEBAR TYPE Table 8 HAND LEBAR TYPE 27.
Total number of errors committed in all test stations combined
(excluding Station 8) during Trial l [Chi-square For bicycle
model (dr=2) = 20.60 , For handlebar type (dF=i) = 30.2Xxx ]
BICYCLE MODEL
Standard Smal l Rodeo Total _ wheeled
Standard 91 80 l 27 298
Extreme l3] l 37 T80 448
Total '
222
217
307
746
Total number of errors committed in all test stations combined (excluding Station 8)X§3(§J<ring Trial 2 [Chi square for bicche model (df=2) = 42.4 , for handlebar type (dF = l) = 3i .9 XX] BICYCLE MODEL
Standa rd Smal l- Rodeo Total
V wheel ed
Standard 69 64 l 24 257
Extreme l 04 l24 l 74 402
4.3.5 4.3.5.] 4.3.5.1.l
28. Presentation and analysis of results from each individual test station
Test l . Looking backwards while riding
. Test l did not involve the measurement of time. Number of errors committed
Table 2 Total number of errors committed per bicycle model and handlebar
type at Station l [Chi-square for bicycle model (df=2) = l9. lxxx, for
handlebar type (at: 1) = 21.2XXX 1
BICYCLE MODEL _ g
Standard Smal l- Rodeo Total wheeled HANDLEBAR . Standard 5 3 15 23 TYPE _ Extreme l0 5 T9 34 Total ~ 15 87 34 57
The results show that in the 216 rides occurring at this station, 57 errors were committed. The difference between bicycle models was significant with the small wheeled bicycle showing the best results and the rodeo bicycle the worst. The difference between handlebar types was also significant.
4.3.5.2
4.3.5.2.]
4.3.5.2.2
Table 10
Standard Smal l- Rodeo Mean
' HANDLEBAR
Whee'ed
TYPE
Standard
20.0
19.5
20.0
19.8
Extreme 19.4 19.7 19.1 19.4
Mean
19.7
19.6
19.6
19.6
29.
I§§f_2;_ Rjglrlgflowlx between two lines
In this test, the longest time indicates the best result.
Time expenditure r
Average time in seconds (with a time deduction for errors) required for the accomplishment of the task at Station 2 for each bicycle model and handlebar type (Bicycle model F 2/3420.1, handlebar typeF1/3421.9) '
BICYCLE MODEL
There was very little difference between bicycle models or between handlebar types in this test, with regard to time expenditure.
Number of errors committed
Table 11 Total number of errors committed per bicycle model and handlebgr< type at Station 2 [Chi-square to! bicycle model (df=2) = 45.7 , for handlebar type (df=1) = 30.9 XX ]
BICYCLE MODEL
Standard ' Small Rodeo Total wheeled ' HANDLEBAR 1 - 2 52 TYPE Standard 10 O 3 Extreme 23 33 69 125 Total 33 43 101 _ 177
There was a significant difference in results between bicycle models and handlebar types in this test with regard to the total number of errors committed. Of the 216 rides occuring at this station,- 177 errors were committed. The rodeo bicycle shoWed more than double the number of errors of either the standard or small wi :-:'s_;.=f3:5 :: Bicycles withextreme handlebars showed over twice as many errors as bicycles with standard handlebars .
30.
1-3-5-3 E5194-355 }EQEEMEEQ.YZ ZEQQQPJEEEEQFIE
1.3.5.3.l Time expenditure
Table l2_ Average time in seconds (with a time addition for errors) required for the accomplishment of the task at Station 3 for each bicycle model and handlebar type (Bicycle model FZ/l 87: l .4, handlebar
type F 1/187: 5.0x)
'
'
BICYCLE MODEL
Standard Smal l - Rodeo Mean
wheeled HANDLEBAR St . . .2 . TYPE andard 5 5 6 l 6 5 9 Extreme 6.4 6.5 7.1 6.7 Mean 6.0 6.3 6.7 6.3
The results showed a significant difference between the handlebar types. The difference between the bicycle models was not significant but less time was required to accomplish the task with the standard bicycle than with the small wheeled or rodeo models.
-.3.5.3.2 Number of errors committed
Table 13 Total number of errors committed per bicycle model and handlebar type at Station 3 [Chi sqggre for bicycle model (df=2) = 3.6, for handle
bar type (at =1) = 6.7 It
.
'
BICYCLE MODEL
Standard Smal l- Rodeo Total
HANDLEBAR
v
Wheeled
TYPE Standard 21 J 28 30 79
' Extreme 36 32 47 1 l5
Total 57 60 77 T94
Of the 2l6 rides occuring at this station, l94 errors were committed. There was a significant difference between bicycles with standard handlebars and those with the
extreme type. The difference between bicycle modeis was not significant/but the standard model showed feWer errors than the other models. The difference in the number of
. u ~ l
4.3.5.4 4.3.5.4.1 4.3.5.4.2 31.
Isité;_§les':.s_'9[<zr2
Time expenditureAverage time in seconds (with a time addition for errors) required for the Table 14
accomplishment of the task at Station 4for each bicycle model and handlebar type (Bicycle model F 2/187=7.9XX, handlebar type
F 1/187=0.9)
BlCYCLE MODEL 1 I V
Standard Smal l - Rodeo Mean wheeled HANDLEBAR Standard 13.0 14.0 16.2 14.4 TYPE _ . Extreme 12.7 15.9 16.6 15.1 _ Mean 12.9 . 14.9 16.4 14.7
There was a significant difference between the bicycle models with the standard model showing the best result and the rodeo model the worst. The difference between handlebar types was not significant, although the extreme handlebars showed a slightly worse
result than the standard type. Number of errors committed
Table 15 Total number of errors committed per bicycle model and hanggfbar type at Station 4 [Chi-square for bicycle model (df=2) = 16.9 , for handlebar type (df=1) = 0.3 ]
BICYCLE MODEL
Standard Small- - Rodeo Total
HANDLEBAR
Whee'ed
TYPE Standard 53 67 88 208 '
Extreme 53 79 87 21 9
Total 106 y 146 175 427
Of the 216 rides occuring at this station, 427 errors were committed. There was a ~ significant difference between the bicycle models. The difference between the
handlebar types was not significant, but a slightly greater number of errors occurred
4.3.5.5 4.3.5.5.1
4.3.5.5.2
Test 5. Riding balance Time expenditure Table 16
HAND LEBAR TYPE
The results showed significant differences between bicycle models and handlebar types.
Number of errors committed
Table 11
HANDLEBAR TYPE
The differences between bicycle models and handlebar types were both significant. Bicycles with extreme handlebars showed more than twice as many errors as bicycles
Ayerage time in secOnds (with a time addition for errors) required for the accomplishment of the task at Station 5 for each bicycle "model and handlebar type (Bicycle model F 2/187=3.7x, handlebar type F 1/187
=13.9"" )
BICYCLE MODEL
32.
Standard Smal l- Rodeo Mean wheeled
Standard 18.2 18.4 18.9 18.5
Extreme 18.8 19.9 20.0 19.6
Mean 18.5 19.1 19.4 19.0
Total number of errors committed per bicycle model and handlebar type. at Station 5 [Chi square forxbécycle model (df=2) = 14.7XXX, for handlebar type (df=1) = 33.3 J BICYCLE MODEL Small- Rodeo Standard Total wheel ed Standard 1 9 21 3O 70 Extreme 34 53 7O . 157 M Total 53 74 1 00 227
with the standard type.
4.3.5.6 4.3.5.6.]
4.3.5.6.2
Iszté;_3s.iez_rléi!3_9_
Time expenditure Table l8 HANDLEBAR TYPEThere was a significant difference between handlebar types, but there was no significant Average time in seconds (with a time addition for errors) required for
the accomplishment of the task at Station 6 for each bicycle modei and handlebar typeX(Bicycle model F 2/l87==2.9, for handlebar type
F i/l87=iO.3 X)
BICYCLE MODEL
Standard Smal l Rodeo Mean
I wheeled
Standard 8.6 8.3 9.5 8.8
Extreme 9.] 10.2 10.0 f 9.8
Mean 8.9 9.8 9.3
difference between bicycle models.
Number of errors committed
Table 19
HANDLE BAR TYPE
The difference between bicycle models was significant. The difference between handle-bar types was also significant and the extreme handlehandle-bar types showed more than twice
9.3
Total number of errors committed per bicycle and handlebar type'at Station 6 [Chi-square for bicycle model (df=2) = 8.3x, for
handle-bar type (dr: 1) = 8.0 ]
BICYCLE MODEL
Standard Smal l Rodeo Total wheel ed
Standard / 7 l 20 28
Extreme 24 20 24 68
Total 3i 2 l 44 96
as many errors as the standard type.
4.3.5.7 4.3.5.7.1
4.3.5.7.2
34.
Test 7. Riding in a circle Time expenditure
' M_ Average time in seconds (with a time addition for errors) required for the accomplishment of the task at Station 7 fogxeach bicycle model and handlebar type (Bicycle model-F 2/187=38.4 , handlebar type
F 1/187=1.7)
~
BICYCLE MODEL
Standard Smal l Rodeo Mean
h l d
HANDLEBAR
TYPE Standardw ee 8
14.7 10.9 11.7 12.4
Extreme 14.7 12.1 11.8 12.9
Mean
14.7
11.5
11.8
12.7 77
The results in this test were opposite those of the previous tests. The small wheeled bicycle showed the best result with the rodeo bicycle showing nearly the same result.
There Observations showed that a small wheelbase was most advantageous in this test.
was no significant difference between handlebar types.
Number of errors committed
Table'21 Total number of errors committed per bicycle model and handlebg;X type at Station 7 [Chi-square ior bicycle model (df==2) = 18.4 , for handlebar type (df=1) = 4.0 :l
BICYCLE MODEL
Standard Smal l Rodeo Total
HANDLEBAR _
Wheeled
TYPE Standard 38 9 30 77
Extreme 45 27 32 104
Total 83 36 62 181
As can be seen from Table 21, the results in regard to total errors per bicycle model were (as in Table 20) opposite those of the previous tests. The difference between the handlebar types was significant with the standard. type showing less total errors than the extreme type .
4.3.5.8
35.
Test 8. Stationary balance
In this test, the task was to keep the balancie For as long as possible; therefore, the longest time indicates the best result.
4.3 .5 .8.l Time expenditure
Iable 22 Average time in seconds required For the accomplishment of the task at Station 8 for each bicycle model and handlebar type. (Bicycle model
F 2/1872 5.8 X, handlebar type Ft/187=O.1)
-BICYCLE MODEL
. Standard Smal l- Rodeo Mean
HANDLEBAR
Wheeled
TYPE Standard 2.8 2.7 2.4 2.6
Extreme 2.8 2.8 2.2 2.6
Mean
2.8
2.8
' 2.3
2.6
Table 22 shows that the differences between the bicycle models and between the handlebar types were rather small. The rodeo bicycle, nevertheless, showed a
worse result than either the standard or the small-wheeled models, both with standard
4.3.5.9 4.3.5.9.]
4.3.5.9.2
Test 9. Riding through narrow gates Time expenditure
_Table 23
HANDLEBAR TYPE
Average time in seconds (with a time-addition for errors) required for the accomplishment of the task at Station 9 for each bicycle model and
36.
handlebar type (Bicycle model F 2/l87=ll .4XX, handlebar type
F 1/1872] .3)
BlCYCLE MODEL
Standard Smal l- Rodeo Mean a wheeled
Standard 6.3, 5.1 5.3 5.6
Extreme 6.l 5.7 5.4 5.7
Mean 6.2 5.4 5.4 5.7
There was a significant difference between bicycle models, with the rodeo and small wheeled models showing the best result and the standard model the worst.
There was no significant difference between handlebar types.
Number of errors committed
Table 24
HAN D LEBAR TYPE
Of the 2T6 rides occurring at this station, only 29 errors were commit-ted. The rodeo Total number of errors committed per bicycle model and handlebar type at Station 9 [Chi square for bicycle model (df=2) = l . l , for handlebar type (elf: l) = 0.3 ]
BICYCLE MODEL
Total
Standard Smal l - Rodeo wheeled
Standard 6 4 l3
Extreme 5 7 16
Total
11
H
29 V
bicycle showed the least number of errors committed. There were no significant differences between bicycle models or between handlebar types.
37.
4 -3 ~5- 0 Ie2t..19_-_Aeeelsre smej
4.3 .5 . lO.i Time expenditure
Table 25 Average time in seconds (with a time addition For errors) required For the accomplishment of the task at Station 10 for each bicycle model and handlebar type (Bicycle model F 2/l87=2.0, handlebar
type F 1/1-87=7.ix 7
BlCYCLE MODEL
, Standa rd Smal l-> Rodeo Mean
HANDLEBAR
'
Wheeled
TYPE Standard 5 . O 4 .9 5 .O 5 . 0
Extreme 5.2 5.3 4.9 r . 5.1
Mean 53.1 5.l 5.0 5.1
There was a small but significant difference between handlebar types with thestandard type showing a slightly better mean result- There was no significant difference
between the bicycle models. The rodeo bicycle gave the best mean result.
4.3.5.i0.2 Number of errors committed
Table 26 Total number of errors committed per bicycle and handlebar type at Station 10 [Chi-square for bicycle model (df==2) = l .l , for handlebar type (dt=l) = 0.3)
BICYC LE MODE L
Standard Smal l - Rodeo Total wheeled
Standard i i 3 5
Extreme I 5 5 2_ 12
Total 6 6 5
i7-OF the 216 rides occurring at Station l0, anly l7 errors were recorded. The small number of errors makes a closer analysis of the distribution of errors irrelevant.
4.3.6 4.3.6.i
4.3.6.2
38.
_ Results from the interviews
ores-3.25.. Eéi E l size 391539EQEEE'.E§£E?ETEDE§_ eiibeueisysl s:93:119. .tb 212.6515...
The subjects were first asked which type of bicycle they owned. There was no
correlation between the results from the experiment and the subject's own bicycle type. They were then asked which bicycle they felt was the easiest to perform the tests
with and which was the most difficult. As regards the bicycle easiest to perform the tests with, there was a correlation between the subjects' estimations and the results from the tests fvor one third of the subjects. regards the bicycle most difficult to perform the tests with, there was a correlation between the subjects' estimations and
the results from the tests for one sixth of the subjects.
§e£etn9§aeet§
The subjects were asked to rank the bicycles according to their safety value on a scale from l - 6 where l referred to the safest bicycle and 6 to the least Safe. Table 27' shows the subjects' estimations as compared with the results from the tests.
Iable 27 Subjects' rating of the safety value of the bicycles as compared with a rating of the bicycles according to the results from the tests (total number of errors Committed per bicycle type) on a scale of i -- 6, where 1 refers to the safest bicycle and 6 to the least safe. Bicycle Subjects" rating Rating based on
number of errors committed per bicycle type Standard Handlebars Standard l V _ _ 2 Small-wheeled I r 2 l Rodeo 4 4 Extreme Handlebars
Standard -
'
3
Smail wheeled _ 6 Rodeo 5There was a strong correlation between the subjects estimations and the results from the experiment.
- -.
4.3.6.3
39. Social aspects I
It is important to recognizethe social value of the bicycle for the subiects in this age group, boys approximately age l2, who regard thebicycle not merely as a means of transportation, but as a part of their social life as well. This was evident From some of the responses to questionsspecifically designed to evaluate this issue as well as from the subiects' impressive knowledge about bicycle models, tire types, etc.
Some of the subiects stated that they liked to "sit" at the bicycle and chatwith friends. This was easily accomplished on the rodeo bicycle because it allowed the rider to lean back against the seat while doing so. Almost all the subiects Felt it was in to own a rodeo bicycle and several subiects stated that it was fun to own the same type of
bicycle that everyone else owned.
It is suggested that the social aspects should be considered when designing bicycles for children since they appear to have a strong influence upon the child s choice of
4.4
40.
A BRIEF SUMMARY or THE RESULTS
ln this experiment, six bicycles have been tested in a series of tests designed to assess manoeuvrability and stability performance. Three bicycle models and two handlebar types were used. The tests were given twice in order to study the training effects. To test handlebar performance, two types of handlebars were used, one standard and the other extreme in height. The results showed a significant difference between the handlebar types, with the standard handlebars showing the best results in regard to both time expenditure and number of errors committed.
The bicycle models consisted of standard, small wheeled, and rodeo models, with the variables consisting of differences in frame construction (size, design and weight), wheel radius, and wheelbase. There wasgno significant difference between the
bicycle models regarding time expenditure, but there was a significant difference regarding the number cf errors which were committed. When the results from all the tests were combined, the rodeo bicycle showed approximately 50% more errors than the other bicycle models.
The results from interviews held after the completion of the experiment showed a correlation between the subjects' ranking of the bicycles in terms of their safety value and the results from the experiment. Information collected from the interviews also showed that the subjects viewed the bicycle not only as a means of transportation but as an important part of their social life .i
41 .
DISCUSSION
The accelerating number of bicycles and bicycle accidents, especially those involving children, requires attention. The bicycle must be regarded as a highway vehicle, competing with the automobile'for road space, and, thus, the education and training of cyclists, the development and enforcement of safety and design standards for bicycles, and thoughtful highway and street planning are all of importance if the present
increasing death and injury rate is to be arrested.
The increasing death and injury toll .of unprotected cyclists can effectively be reduced through improved bicycle designs. The aim of the present literatUre survey and experi-ment was to study the manoeuvrability and stability performance of six bicycles current-ly available on the Swedish market in order to isolate design components which might be affecting performance .
The results from the experiment show that bicycles with extreme handlebars give a worse manoeuvrability performance than bicycles with standard handlebars regardless of which of the three bicycle models was used. The results also showed that the modern rodeo bicycle caused approximately 50 percent more errors than either of the other
bicycle models tested, despite the added advantage of a gear system. These results were supported by the subjects ranking of the bicycles in regard to their safety value.
Two conclusions can be drawn from the results shown in this experiment: bicycles with extreme handlebars have a poorer manoeuvrability performance than those with standard
handlebars, and the rodeo bicycle has the worst manoeuvrability performance out of
the three models tested. Since-the rodeowbicycle showed poor results both with standard and with extreme handlebars, it is unclear,_at this point, what the specific design components affecting its manoeuvrability performance are. Some possible factors might be the design and position of the seat or the relationship between the seat and the
_ handlebars .
WWW... MW.-.«,4,» v , _~_______h _
It can be assumed that if certain bicycles show poor results in manoeuvrability tests, then they will be more dangerous on the road. The question of whether or not the manoeuvrability tests used in this experiment mirror skills required in actual traffic situations plays an important role in this assumption. The tests were felt to be an
accurate measurement of skills needed in traffic situations because they were developed with this putpose in mind and because the number of tests given was large enoUgh to accommodate most possible traffic situations.
The results from the present experiment, from accident analySes in other studies, and from earlier experiments all indicate that bicycleswith extreme handlebars are dangerous. It is; therefore, suggested that a change inthis aspect of bicycle design might encourage a decrease in the rate of bicycle accidents. Further experi v ments having the specific purpose of studying handlebar heights are we ll justified .
As regards the rodeo bicycle, further research is required before the specific design components affecting manoeuvrability performance are fully understood.
REFERENCES
BERGER, lm Strassenverkehr T966 verunglUckte Kinder und Jugendlich (Traffic accidents among children and youth T966) . Zeitschrift fUr Verkehrssicherheit, T969, No T.
CAMPBELL, B.J., FOLEY, J.P. and PASCARELLA, E.A. Bicycle riding and
accidents among youth. The University of North Carolina Highway . Safety Research Center, July, 1971.
CRAFT, A.W., SHAW, DA. and CARTLIDGE, N.E.F. Bicycle injuries in
Children. British Medical Journal, T973, 4, 146-147.
GODTHELP, J . Stability and manoeuvrability characteriStics of single track vehicles. Institute for Perception TNO, Soesterberg, The Netherlands,
1974.
HAYES, J.J. Bicycles in the modal (mix: The scope of the problem. Paper presented at the Third International Congress on Automotive Safety, San Fransisco, July 15 17, 1974.
HERFKENS, B.D. De stabilitet van het riiwiel . Report lROZ-B. Institute for Road Vehicles TNO Delft, The Netherlands, 1949.
HOWELL, T.R. Pediatrics, 1968, 43, 214.
JONES, D.E.H. The stability of the bicycle. Physics Today, 1970, 34 41.
KIRK, R.E. Experimental design: Procedures for the behavioural sciences. Belmont, California: Brooks-Cole, T968.
LEWIS, G .D. ' The manoeuvrability and braking performance of small-wheeled bicycles when ridden by children. Report LR 500. Transport and Road Research Laboratory(TRRL), Department of Environment, Crowthorne, Berkshire, I973.
MORTIMER, R.G., DOMAS, P.A. and DEWAR, R.E. The relationship of
bicycle manoeuvrability to handlebar configuration. Report UM-HSRI HF- TM-73-5. Highway-Safety Research Institute , the University of Michigan, Ann Arbor, I973, 48/05.
NATIONAL SAFETY COUNCIL. National Commission on Product Safety. Final report. Washington, D.C.: Government Printing Office, I970. NATIONALSAFETY COUNCIL. Accident Facts, I972, I973, Edition: 43, 56, 58,
6I, 77, 90-92.
THE NATIONAL SWEDISH CENTRAL BUREAU OF STATISTICS. Road traffic accidents with iniuries on individuals. OfficiaI statistics of Sweden,
Stockholm, I968 I972.
RICE, R.S. and ROLAND, Jr R.D. Anuevaluation of the performance and handling qualities of bicycles. Final report. Buffalo, New York, I970, 4, 72. RECTOR, D.W. (prepared by). The nature of 2,800 bicycle accidents involving
school age children in Los Angeles. Paper presented at the Third International Congress on Automotive Safety, San Francisco, July I5 I7, I974.
STARKS, H.J .H. and LISTER, R.D. Some safety aspects of pedal and motor-assisted cycles. Road Research Technical Paper No 38, I960.
STASSEN, H.G . and van LUNTEREN, A. Investigations on the bicycle simulator. Annual Report of the Mam Machine System Group, I969, Laboratory for MeasUrement andControI, Delft University-of Technology, The
THORSON, J. and SANDE, l. Hospital studies on road traffic accidents. How adequate are official statistics concerning seriously iniured persons.
Laboratory for Traffic Medicine, National Council on Road Safety Research, Stockholm, l969.
WlLSON, 5.5. Bicycle technology. Scientific American, March, 1973.
WINER, B. J. Statistical principles in experimental deSign. London: McGraw-Hill,