2020; 6(1): 1-15
Published by the Scandinavian Society for Person-Oriented Research
Freely available at https://journals.lub.lu.se/jpor and https://www.person-research.org
https://doi.org/10.17505/jpor.2020.22042
1
Early Warning Signals Based on Momentary
Affect Dynamics can Expose Nearby Transitions
in Depression: A Confirmatory Single-Subject
Time-Series Study
Marieke Wichers, Arnout C. Smit, and Evelien Snippe
University of Groningen, University Medical Center Groningen (UMCG), Dept. of Psychiatry, Interdisciplinary Center Psychopathology and Emotion regulation (ICPE), Groningen, The Netherlands
Corresponding author:
Marieke Wichers, UMCG, Hanzeplein 1, 9713GZ Groningen, The Netherlands Triade building entrance 24, room kz. 1.05 Internal post code CC72
Tel: ++31 (0) 50 3610566 Email: m.c.wichers@umcg.nl
E-mail addresses to co-authors a.c.smit@umcg.nl
e.snippe01@umcg.nl
To cite this article:
Wichers, M., Arnout C. Smit, A. C., & Snippe, E. (2020). Early warning signals based on momentary affect dynamics can expose nearby transitions in depression: a confirmatory single-subject time-series study. Journal for Person-Oriented Research, 6(1), 1-15.
https://doi.org/10.17505/jpor.2020.22042
Abstract:
Background: In complex systems early warning signals such as rising autocorrelation, variance and network connectivity are hypothesized to anticipate relevant shifts in a system. For direct evidence hereof in depression, designs are needed in which early warning signals and symptom transitions are prospectively assessed within an individual. Therefore, this study aimed to detect personalized early warning signals preceding the occurrence of a major symptom transition. Methods: Six single- subject time-series studies were conducted, collecting frequent observations of momentary affective states during a time-period when participants were at increased risk of a symptom transition. Momentary affect states were reported three times a day over three to six months (95-183 days). Depressive symptoms were measured weekly using the Symptom CheckList-90. Presence of sudden symptom transitions was assessed using change point analysis. Early warning signals were analysed using moving window techniques. Results: As change point analysis revealed a significant and sudden symptom transition in one participant in the studied period, early warning signals were examined in this person. Autocorrelation (r=0·51; p<2.2e-16), and variance (r=0·53; p<2.2e-16) in ‘feeling down’, and network connectivity (r=0·42; p<2.2e-16)
sig-nificantly increased a month before this transition occurred. These early warnings also preceded the rise in absolute levels of ‘feeling down’ and the participant’s personal indication of risk for transition. Conclusions: This study replicated the findings of a previous study and confirmed the presence of rising early warning signals a month before the symptom transition oc-curred. Results show the potential of early warning signals to improve personalized risk assessment in the field of psychiatry.
Keywords:
complex systems, early warning signals, depression, momentary mental states, experience sampling meth-odology, time-series analyses, networksWichers et al.: Early warning signals based on momentary affect dynamics
2
Introduction
Theoretical and empirical support is accumulating that psychopathology behaves as a complex system (Cramer et al., 2016; Hayes et al., 2007; Heinzel et al., 2014; Olthof et al., 2019; Schiepek et al., 2014; van de Leemput et al., 2014; Wichers et al., 2016). This is relevant as it provides novel tools, derived from principles of complex system theory, to anticipate sudden transitions in the system. Com-plex systems tend to have several alternative states and are likely to shift from one state to the other when the system is unstable. Scheffer (Scheffer et al., 2009; Scheffer et al., 2012) showed that this instability can be assessed using early warning signals (EWS), and proved that rising insta-bility indeed anticipates sudden transitions in various sorts of complex systems. If psychopathology also behaves like a complex system, the application of these principles may reveal important novel information on the behaviour of psychopathology. Furthermore, if psychiatry can translate these principles to similar designs in which the dynamics of a single system are prospectively monitored, and EWS could be derived from those data, then psychiatry will jump towards the next level: towards accurate personalized risk assessment.
Signals hypothesized as EWS are rising autocorrelation, rising variance, and rising connectivity between elements in the system (Scheffer et al., 2009). This is because all of these signals indicate that the system is getting slower in recovering from minor perturbations, which is also referred to as ‘critical slowing down’ (Scheffer et al., 2009; Scheffer et al., 2012; van de Leemput et al., 2014). EWS are generic and thus hypothesised to work for a wide range of systems, although the system elements that may show EWS differ per system.
Where EWS in CO2 measures seem important in the
search for transitions in climate (Scheffer et al., 2009), EWS in emotions may be needed to anticipate transitions in psychopathology. Emotions or affect states are core indica-tors of mental (ill-)health as they are altered in all types of psychiatric disorders. Furthermore, a long tradition of work has provided evidence for the relevance of affect dynamics (Houben et al., 2015; Koval et al., 2013; Kuppens et al., 2012; Wichers et al., 2015) in relation to the development of psychopathology. The subtle dynamics of momentary affect states (e.g., autocorrelation and variance) and the continuous dynamics of how affect states impact on one another (connectivity) are likely to reveal previously unex-posed and crucial information on the stability of a person’s mental health state (Curtiss et al., 2019; Wichers et al., 2015; Wigman et al., 2015).We hypothesize, therefore, that complex system principles may play out at this level of momentary affect dynamics. This idea is supported by some group-level studies (Curtiss et al., 2019; van de Leemput et al., 2014), which showed that people with higher levels of EWS at a particular period in time, as measured in time-series of momentary affect states, are the
ones that will develop more novel symptoms in the near future. One problem, however, is that previous group-level studies did not directly observe the timing and shape of the symptom change. Also, they did not observe alterations in affect dynamics over time. Therefore, these studies cannot confirm whether autocorrelation, variance, and connectivity were indeed rising within individuals in close anticipation of a jump towards higher symptom levels. Studies that can test this are rare, as the combination of ‘catching’ sudden transitions of symptoms in real-time and having performed intensive measurements to observe EWS before that critical moment requires scientific persistence. Radically different designs are needed, namely single-subject time-series stud-ies during a period when patients are at risk of having a symptom transition. Only such studies adequately mimic designs that have been used in other scientific fields to di-rectly test the value of EWS to foresee transitions in a sys-tem and only with these designs can we test whether EWS in psychiatry can yield accurate estimations of patient- specific risk (Wichers et al., 2014).
The only study with a design in which momentary affect states of a patient were measured long enough to prospec-tively detect the near presence of a sudden transition of psychiatric symptoms in the system, found rising autocor-relation and variance in affect states in anticipation of the sudden symptom transition (Wichers et al., 2016). Further- amore, results showed increasing connectivity between affect states while time to transition decreased. This is in line with the hypothesis that the system becomes less stable when affect states, elements of the complex system, start to trigger each other more strongly. These changes were ob-served already weeks before the transition took place and suggest that momentary affect dynamics can reveal crucial system changes, which have been invisible with standard questionnaire measures, and which may yield timely patient-specific information about the future course of symptoms. If replicated, the impact on the field of psychia-try may be huge.
Therefore, this study aimed to replicate the previous findings in a similar unique single-subject time-series study, to see whether EWS precede a transition towards higher levels of depressive symptoms. We additionally checked whether EWS were present before the presence of changes in absolute levels of ‘feeling down’ and before the moment the participant felt that a relapse was approaching.
Method
Sample
Six individuals engaged in a pilot case-series study where the primary aim was to explore the feasibility of monitoring changes in momentary mental states during dose-reduction of antidepressant medication (see also Smit, et al., 2019). Participants were recruited at a mental health care institution and through advertisement in a local news-paper. Participants were included based on being on
anti-3 depressant medication because of a previous depressive episode, and having made a shared decision with their gen-eral practitioner or psychiatrist to (gradually) stop using medication because of remission. Exclusion criteria were age<18, current psychotic symptoms, and having a bipolar disorder. All participants provided written informed consent. Participants monitored their momentary mental states in the final period of their dose-reduction and in the period there-after for 95 to 183 days. One of these participants experi-enced a sudden major increase in depressive symptoms after the dose-reduction and within the study period. We used the data of this participant in the current study to rep-licate the results of the previously published study showing that EWS anticipated a transition in depressive symptoms (Wichers et al., 2016). The participant used venlafaxine and tapered this medication gradually over a period of 16 weeks. As further demographic and clinical information of the par-ticipant are not relevant for the current research question, we decided not to report this information because of priva-cy reasons. The study did not require ethics evaluation as judged by the Ethics Committee of the University Medical Center Groningen, The Netherlands.
Study procedures
Experience sampling (ESM) was used for the assessment of momentary mental states in the flow of daily life (Csikszentmihalyi & Larson, 2014; Myin-Germeys et al., 2009; Trull & Ebner-Priemer, 2009). A text message was sent to the mobile phone of the participant with a link to an online ESM questionnaire three times a day at fixed mo-ments that were 5½ hours apart (at 11:30, 17:00, and 22:30). Furthermore, the participant performed weekly online as-sessments of depressive symptoms. The current participant started the study in week four of the tapering schedule (46.9 mg) and continued for 23 weeks (164 days) including 11 weeks of assessments after antidepressant discontinua-tion. The participant completed 370 out of 492 ESM as-sessments (75%) and 23 weekly SCL-90 asas-sessments (100%).
Measurements
In total, ten momentary mental states were assessed in each ESM questionnaire: (feeling down, irritable, tired, listless, restless, stressed, content, cheerful, self-assured, energetic). These items were rated on a continuous scale from 0 (“ not at all”) to 100 (“very much”). See Appendix A for more details on the selection of items. Depressive symptoms were measured weekly using the Symptom Checklist (SCL)-90 depression subscale (Derogatis & Cleary, 1977).
We additionally asked the participant beforehand to pro-spectively indicate the moment at which (s)he thought that a relapse might be approaching in order to know whether the participant would be as efficient in forecasting the tran-sition as the used statistical measures.
Statistical analyses
For all analyses we used as much as possible the same methodological choices and statistical pre-processing steps as in the previous publication (Wichers et al., 2016); see Appendix A for details. For estimating the moment of the symptom transition we used change point analysis (Matteson & James, 2014) on the weekly SCL-90 depres-sion scores.
Change in autocorrelation and variance
We used the item ‘feeling down’ as the primary affective state for the examination of changes in autocorrelation and variance. This negative affect state is conceptually the closest proxy of depression in which, therefore, the strong-est signal is expected (van de Leemput et al., 2014; Wichers et al., 2019). As a robustness check, however, we reran the analyses using the total of all momentary mental states, in conformity with the procedure used in Wichers et al. (2016).
To filter out trends in the time series, we subtracted a kernel smoothing function from the data (see Figure B.1 in Appendix 2) and used the residuals for the estimation of the autocorrelation and variance. In order to see the changing pattern of autocorrelation and variance over time, moving window techniques were applied using time-windows of 30 days of observations using STATA 15.0. For each day from day 30 on, autocorrelation and variance were estimated using data from the previous 30 days (max 90 measure-ments). To test if autocorrelation and variance were rising when closer to the transition, as hypothesized, the Kendall rank correlation was calculated between the window esti-mates and their time index. We examined whether autocor-relation and variance increased before the transition as well as if these measures started rising earlier than the absolute levels of feeling down.
Change in momentary affective state network connec-tivity
To examine changes in affect dynamics, again, we per-formed analyses similar to Wichers et al. (2016). See Ap-pendix A for further details. We selected five variables to include in the network model. To avoid that items in the network actually refer to the same underlying entity, it is important to include states that assess different aspects of mental experience (Wichers et al., 2017). We therefore chose the five mental states, including ‘feeling down’, that showed the lowest overall correlations with each other. This resulted in the following combination: feeling down, stressed, irritable, tired and energetic. The last variable was recoded to reflect the reverse (not energetic).
Any trends in the time series were filtered out using a kernel smoothing function (see appendix A for more de-tails). Regression analyses were performed to make a vector-autoregressive (VAR) model and to obtain network connection strengths. For each mental state, a linear
regres-Wichers et al.: Early warning signals based on momentary affect dynamics
4 sion analysis was performed in which the independent var-iables consisted of the lagged varvar-iables (t-1) of all five mental states. The analyses differed from each other only in that the dependent variable was different for each analysis: each mental state was the dependent variable once. The 25 beta-coefficients of the independent variables of the five regression models represent the network internode connec-tivity between the five mental states and the autocorrela-tions. Continuous change of the sum of all internode net-work paths in the period before the symptom transition was calculated using similar moving window techniques as for the first analyses. This resulted in dynamic estimates to capture changes in total network connectivity in anticipa-tion of the transianticipa-tion. Autocorrelaanticipa-tions were not included here.
Results
Rise in autocorrelation and variance as early
warning signals
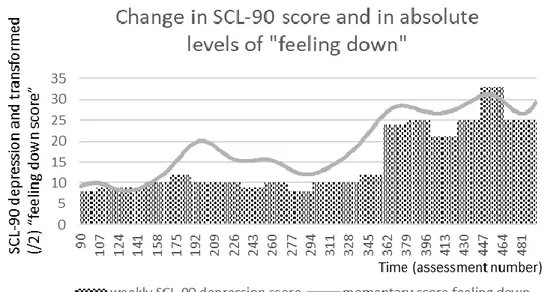
The upper panel of Figure 1 illustrates the changes in weekly depressive symptoms measured with the SCL-90 depression subscale, and in levels of “feeling down” meas-ured three times a day with experience sampling. We re-scaled the “feeling down” score, using a division by two, to plot the measures in the same graph. Change point analysis revealed a significant shift in the weekly assessed depres-sive symptom scores (SCL-90) around assessment 357, at day 119 (p <.0001; see Figure 1, upper panel). The middle panel of Figure 1 shows the continuous change in autocor-relation of the mental state ‘feeling down’.). As expected, autocorrelation showed a steep increase before the symp-tom transition (r=0·51; p<2.2e-16). Visually, we can observe
that autocorrelation already started to rise around assess-ment 241, day 80; more than a month before the shift in depressive symptoms, and more than two weeks before the increase in the absolute levels of feeling down. The rise in autocorrelation peaked at day 93 (assessment 278). Also, the autocorrelation remained relatively high till very shortly before the transition in SCL-90 symptoms, when autocor-relation dropped steeply. The results were similar when change in autocorrelation was assessed using the sum of momentary mental states. An additional peak in autocorre-lation arose around assessment 143, just before a first smaller rise in absolute levels of ‘feeling down’ (see Figure B.2 in Appendix B).
The variance in feeling down also showed a significant increase in the period before the symptom transition
(r=0·53; p<2.2e-16); see Figure B.3 in appendix B).
How-ever, when analyses were repeated with the sum of mo-mentary mental states no clear pattern appeared (see Figure B.2 in appendix B).
The participant’s own indication of increased risk for symptom recurrence was only at day 119.
Changes in momentary affect state network
dynamics
Total internode connectivity increased before the symp-tom transition (r=0·42; p<2.2e-16; see the lower panel in
Figure 1). A further exploration revealed that for all varia-bles except for ‘feeling stressed’ a steep increase in inter-node connectivity (in terms of instrength) could be visually observed from day 69 to day 99 close before the transition (see Figure B.4 in Appendix B). The increase in internode temporal connectivity thus peaked around the same time as autocorrelation did. Also, again a steep drop in connectivity was present around the moment of the symptom transition. Furthermore, internode connectivity seemed to show a small increase before the start of the first minor rise in ab-solute levels of ‘feeling down’.
To be useful in clinical practice it is important that early warning signals are not producing too many false alarms. They should thus be absent in participants without a signif-icant symptom transition. Post hoc analyses showed that only 1 out of 8 examined EWS was significantly positive in the participants who did not experience significant symp-tom transitions (for results see supplementary text and Fig-ure B.5 in the appendixes).
Discussion
This replication study provides evidence that principles of complex systems theory seem to apply to symptom tran-sitions in psychopathology. Furthermore, it shows that these principles may expose subtle, and previously invisible, system changes that indicate the approach of a relevant symptom transition for a specific patient at a specific mo-ment in time. If replicable, this finding is of crucial im-portance in the field of psychiatry as it may bring personal-ized psychiatry, and successful transfer of scientific find-ings to clinical practice to the next level. Further large-scale replication (with many similar single-case time-series stud-ies) is necessary to know how often these signals appear, their average timing, and to estimate their sensitivity and specificity.
5
Figure 1.
Early warning signals precede symptom transition and absolute changes in “feeling down”
Note. The upper panel shows the changes in weekly depressive symptoms measured with the SCL-90 depression subscale, and in levels of “feeling down” measured three times a day with experience sampling. The middle panel shows the moving window estimates of the autocorrelation of “feeling down”. The lower panel shows the moving window estimates of the total internode network connectivity. Note that the moving window procedure is the reason the x-axis starts at assessment 90.
Wichers et al.: Early warning signals based on momentary affect dynamics
6
Early warning signals and symptom
transi-tions
This study, and the previously published single-subject experiment are the first studies that have prospectively ex-posed precise micro-level affect dynamics anticipating sig-nificant depressive symptom transitions in relapsing pa-tients. The findings of this second, currently described, single-subject experiment replicated those of the first: ris-ing autocorrelation was found in momentary measures of feeling down and the sum of momentary mental states, pre-cisely in the period anticipating the sudden symptom shift. The peak of this rise occurred before levels of feeling down started to rise towards the moment of the transition. The steep drop in autocorrelation, once the symptom transition took place, is exactly what is expected in complex systems as stability reemerges when the system has shifted towards another equilibrium. Moreover, the autocorrelation of feel-ing down also seemed to increase just before the start of the first smaller rise in levels of feeling down. This, unexpect-edly, produced a within-study replication of the phenome-non that EWS peak before levels of momentary states start to change.
The results support the potential clinical value of using autocorrelation as EWS for symptom transitions. First, the start of the rise in autocorrelation occurred at least a month before the transition took place. This time lag would pro-vide the opportunity to monitor the continuous EWS rise and provide warnings to the clinician and patient in real time when the rising signal would cross boundaries of ‘normal’ variation. A proof of principle study using pro-spective statistical procedures for this purpose demonstrat-ed the feasibility hereof (Smit et al., 2019). Second, the autocorrelation signal seems useful as it did much better than the participant’s personal insight as an indication for the moment of the transition. The participant felt it coming only closely (within a week) before the transition occurred. It thus seems that a more complex statistical measure may indeed contribute to early detection on top of personal in-sight.
A limitation is that we did not include additional insights of significant others as potential indications. We could therefore not test whether these would do better than those of the participant him/herself. Another limitation is the presence of missing values in the time-series data (see Ap-pendix A). Finally, variance disappeared as a signal when analyses were repeated with the sum of all momentary states. Also previous studies showed that variance as EWS may be less robust than other measures such as autocorrela-tion (Dakos et al, 2012; van de Leemput et al., 2014).
Internode connectivity changes
This study also replicated the finding that internode net-work connectivity (based on temporal associations between momentary affect states) increased in strength over time and in anticipation of the symptom transition.
As EWS are indicators of system instability, and as the
system is expected to move to a new stable equilibrium after a transition, EWS are assumed to decline after the transition occurred. This is precisely what was observed. Connectivity dropped steeply around the moment of the symptom transition. Thereby, these results suggest that ris-ing connectivity behaves as an EWS, similar to autocorre-lation. This provides strong support for the relevance of network dynamics at the micro-level of momentary affect states. Caution, however, is warranted in that we cannot be certain that the current temporal associations between affect states were indeed causal in nature.
The specificity level of early warning signals
In order to understand the potential clinical value of EWS it is important to additionally check whether EWS are absent when people are not close to a symptom transition. Post hoc analyses showed that only one out of eight EWS examined measures provided a ‘false alarm’. This finding is promising and suggests that EWS may possess a level of specificity that is useful for clinical purposes. Furthermore, the current findings suggest that a combination of EWS may further increase the accuracy of EWS, as the combina-tion of increasing autocorrelacombina-tion and increasing internode network connectivity was exclusively observed in the par-ticipant with the symptom transition and not in the partici-pants without such a transition. Future research consisting of a larger number of individual time-series studies are needed to confirm that a combination of various EWS measures can predict symptom transitions with considera-ble levels of sensitivity and specificity.
Future directions and implications
Various aspects are important for future studies that aim to replicate these results. First, it is important to measure affect states in a momentary way as retrospective recall hereof is unreliable, and to measure them multiple times a day as these experiences change quickly. Second, replica-tions require designs that have a high quantity of these fre-quent measurements of momentary mental states before the transition occurs and in the time window when EWS are expected (in this case this was a month prior to transition), to be able to detect rising EWS before that point. A third requirement is the use of statistical techniques that can deal with nonlinear changes in data patterns. The currently used moving window technique is an option. However, other novel useful techniques have also recently been developed, such as time-varying autoregressive models (Bringmann et al., 2017).
The current findings have several implications for the potential use of early warning signals in clinical practice. First, it supports the idea that long-term monitoring of af-fect states is feasible. Second, the fact this study replicated previous results makes it unlikely that the finding of rising EWS prior to the symptom transition was a chance finding. Another potential threat to clinical application is the possi-bility that EWS only signal a small percentage of transi-tions in depression. However, also this possibility is rather
7 unlikely, as the case examined in the present study showed similar results to those in the previous study. Promising for potential clinical application is the fact that the statistical signals appeared much earlier than the participant felt the approaching transition. Also promising is the low level of false alarms as found in this study in people without a symptom transition. If replicated in a larger sample of indi-viduals, the monitoring of people with regard to EWS dur-ing the taperdur-ing of antidepressant medication may prove useful to foresee and, thereby, possibly prevent recurrence of symptoms.
Conclusion
By replicating a first single-subject time-series study, this study shows that personalized EWS can be detected that anticipate relevant symptom transitions in depression. Con-firmation of these findings in the current study, using a similar design, was crucial to establish whether early warning signals have utility in clinical practice. Further-more, the fact that EWS were present a month before the symptom transition occurred, plus the fact that these EWS appeared before absolute levels of depressive experiences changed, and that EWS seemed to have a reasonable level of specificity, underscores the clinical potential of the find-ings. Thereby this approach may constitute a major step forward in the ability to expose personalized risk in the field of psychiatry.
List of abbreviations
ESM - Experience Sampling Method EWS - Early warning signals SCL-90 - Symptom Checklist – 90 VAR model - vector autoregressive model
Declarations
Ethical approval and consent: the study was approved by the local ethics committee of the University Medical Center Groningen (METc 2015/21) and participants provided con-sent to participate in the study.
Consent for publication: The current manuscript contains individual person’s data. We therefore obtained this partic-ipant’s consent for the publication of the current manu-script.
Availability of data and material: The datasets generated and analyzed during the current study are not publicly available due to them containing information that could compromise research participant privacy/consent. Herewith we act in accordance with the novel EU General Data Pro-tection Regulation (GDPR).
Competing interests: The authors declare that there is no conflict of interest.
Funding: This project has received funding from the Eu-ropean Research Council (ERC) under the EuEu-ropean Un-ion’s Horizon 2020 research and innovative programme (ERC-CoG-2015; No 681466 to M. Wichers)”
Author contributions
MW designed the study, organized the data collection, carried out part of the statistical analyses, and drafted the first version of the manuscript. ACS carried out part of the statistical analyses, and was actively involved in revising the manuscript. ES co-designed the study, participated in the data collection, and helped to revise the manuscript. All authors read and approved the final manuscript.
Action editor
Lars-Gunnar Lundh served as action editor for this article.
References
Bringmann, L. F., Hamaker, E. L., Vigo, D. E., Aubert, A., Bors-boom, D., & Tuerlinckx, F. (2017). Changing dynamics: Time-varying autoregressive models using generalized additive modeling. Psychological Methods, 22(3), 409-425.
http://dx.doi.org/10.1037/met0000085
Cramer, A. O. J., van Borkulo, C. D., Giltay, E. J., van der Maas, H. L. J., Kendler, K. S., Scheffer, M., & Borsboom, D. (2016). Major Depression as a Complex Dynamic System. PloS one, 11(12), e0167490-e0167490.
https://doi.org/10.1371/journal.pone.0167490
Csikszentmihalyi, M., & Larson, R. (2014). Validity and Reliability of the Experience-Sampling Method. In Flow and the Founda-tions of Positive Psychology (pp. 35-54): Springer Netherlands. Curtiss, J., Fulford, D., Hofmann, S. G., & Gershon, A. (2019).
Network dynamics of positive and negative affect in bipolar disorder. Journal of Affective Disorders, 249, 270-277. http://dx.doi.org/10.1016/j.jad.2019.02.017
Dakos, V., van Nes, E. H., D'Odorico, P., & Scheffer, M. (2012). Robustness of variance and autocorrelation as indicators of critical slowing down. Ecology, 93(2), 264-271.
http://dx.doi.org/10.1890/11-0889.1
Derogatis, L. R., & Cleary, P. A. (1977). Confirmation of the di-mensional structure of the scl-90: A study in construct valida-tion. Journal of Clinical Psychology, 33(4), 981-989. Hayes, A. M., Laurenceau, J.-P., Feldman, G., Strauss, J. L., &
Cardaciotto, L. (2007). Change is not always linear: the study of nonlinear and discontinuous patterns of change in psychothera-py. Clinical Psychology Review, 27(6), 715-723.
https://doi.org/doi:10.1016/j.cpr.2007.01.008
Heinzel, S., Tominschek, I., & Schiepek, G. (2014). Dynamic patterns in psychotherapy – discontinuous changes and critical instabilities during the treatment of obsessive compulsive dis-order. Nonlinear Dynamics, Psychology, and Life Sciences, 18(2), 155-176.
Houben, M., Van Den Noortgate, W., & Kuppens, P. (2015). The relation between short-term emotion dynamics and psychologi-cal well-being: A meta-analysis. Psychologipsychologi-cal Bulletin, 141(4), 901-930. http://dx.doi.org/10.1037/a0038822.
Koval, P., Pe, M. L., Meers, K., & Kuppens, P. (2013). Affect dynamics in relation to depressive symptoms: Variable, unstable or inert? Emotion, 13(6), 1132-1141.
Wichers et al.: Early warning signals based on momentary affect dynamics
8 http://dx.doi.org/10.1037/a0033579
Kuppens, P., Sheeber, L. B., Yap, M. B. H., Whittle, S., Simmons, J. G., & Allen, N. B. (2012). Emotional inertia prospectively pre-dicts the onset of depressive disorder in adolescence. Emotion, 12(2), 283-289. http://dx.doi.org/10.1037/a0025046
Matteson, D. S., & James, N. A. (2014). A Nonparametric Ap-proach for Multiple Change Point Analysis of Multivariate Data. Journal of the American Statistical Association, 109(505), 334-345. http://dx.doi.org/10.1080/01621459.2013.849605 Myin-Germeys, I., Oorschot, M., Collip, D., Lataster, J., Delespaul,
P., & van Os, J. (2009). Experience sampling research in psy-chopathology: opening the black box of daily life. Psychological Medicine, 39(9), 1533-1547.
http://dx.doi.org/10.1017/s0033291708004947
Olthof, M., Hasselman, F., Strunk, G., Aas, B., Schiepek, G., & Lichtwarck-Aschoff, A. (2019). Destabilization in self-ratings of the psychotherapeutic process is associated with better treatment outcome in patients with mood disorders. Psychotherapy Research, 30(4), 520-531.
http://dx.doi.org/10.1080/10503307.2019.1633484.
Scheffer, M., Bascompte, J., Brock, W. A., Brovkin, V., Carpenter, S. R., Dakos, V., . . . Sugihara, G. (2009). Early-warning signals for critical transitions. Nature, 461(7260), 53-59.
http://dx.doi.org/10.1038/nature08227
Scheffer, M., Carpenter, S. R., Lenton, T. M., Bascompte, J., Brock, W., Dakos, V., . . . Vandermeer, J. (2012). Anticipating Critical Transitions. Science, 338(6105), 344-348.
http://dx.doi.org/10.1126/science.1225244
Schiepek, G. K., Tominschek, I., & Heinzel, S. (2014).
Self-organization in psychotherapy: testing the synergetic model of change processes. Frontiers in psychology, 5, 1089-1089. https://doi.org/10.3389/fpsyg.2014.01089
Smit, Arnout C., Snippe, E., & Wichers, M. (2019). Increasing Restlessness Signals Impending Increase in Depressive Symp-toms More than 2 Months before It Happens in Individual Pa-tients. Psychotherapy and Psychosomatics, 88(4), 249-251. http://dx.doi.org/10.1159/000500594
Trull, T. J., & Ebner-Priemer, U. W. (2009). Using experience sampling methods/ecological momentary assessment (ESM/EMA) in clinical assessment and clinical research: in-troduction to the special section. Psychological Assessment, 21(4), 457-462. https://doi.org/doi:10.1037/a0017653 van de Leemput, I. A., Wichers, M., Cramer, A. O. J., Borsboom,
D., Tuerlinckx, F., Kuppens, P., . . . Scheffer, M. (2014). Critical slowing down as early warning for the onset and termination of depression. Proceedings of the National Academy of Sciences of the United States of America, 111(1), 87-92.
https://doi.org/doi:10.1073/pnas.1312114110
Wichers, M., Borsboom, D., Tuerlinckx, F., Kuppens, P., Viecht-bauer, W., van de Leemput, I. A., . . . Scheffer, M. (2014). Reply to Bos and De Jonge: Between-subject data do provide first empirical support for critical slowing down in depression. Pro-ceedings of the National Academy of Sciences of the United States of America, 111(10), E879-E879.
https://doi.org/doi:10.1073/pnas.1323835111
Wichers, M., Groot, P. C., Psychosystems, ESM Group, & EWS
Group. (2016). Critical Slowing Down as a Personalized Early Warning Signal for Depression. Psychotherapy and Psychoso-matics, 85(2), 114-116. http://dx.doi.org/10.1159/000441458 Wichers, M., Schreuder, M. J., Goekoop, R., & Groen, R. N.
(2019). Can we predict the direction of sudden shifts in symp-toms? Transdiagnostic implications from a complex systems perspective on psychopathology. Psychological Medicine, 49(3), 380-387. https://doi.org/doi:10.1017/S0033291718002064 Wichers, M., Wigman, J. T. W., Bringmann, L. F., & de Jonge, P.
(2017). Mental disorders as networks: some cautionary reflec-tions on a promising approach. Social Psychiatry and Psychiat-ric Epidemiology, 52(2), 143-145.
http://dx.doi.org/10.1007/s00127-016-1335-z
Wichers, M., Wigman, J. T. W., & Myin-Germeys, I. (2015). Mi-cro-Level Affect Dynamics in Psychopathology Viewed From Complex Dynamical System Theory. Emotion Review, 7(4), 362-367. http://dx.doi.org/10.1177/1754073915590623 Wigman, J. T. W., van Os, J., Borsboom, D., Wardenaar, K. J.,
Epskamp, S., Klippel, A., . . . Wichers, M. (2015). Exploring the underlying structure of mental disorders: cross-diagnostic dif-ferences and similarities from a network perspective using both a top-down and a bottom-up approach. Psychological Medicine, 45(11), 2375-2387.
9
Appendix A. Supplementary text
Analytic choices network analyses
The current study had a different selection of items, and a strongly reduced amount of items compared to the previous single-subject time-series study. This was done to increase feasibility of long-term monitoring of self-reported affect states. Also, the items included were to a certain extent personalized to the participants’ wishes in both studies. Thus, we could not use exactly the same items as in the previous study. Therefore, we used an approach in which we tried to base the method-ological and statistical choices on the same reasoning as in the previous study.
Similar as in the previous study we decided to include five nodes in the network. This choice was made previously as the inclusion of more nodes is likely to lead to convergence issues. Second, similar as in the previous study we only included momentary affect states as variables to construct the network.
Third, it is considered important to include items that measure as many different aspects as possible of affective experience in this type of network analysis, thus items that are not strongly correlated to one another (Wichers et al, 2017). As different items were available in the current study and as each person may differ in correlation structure we included slightly differ-ent items in the network compared to the previous study. For this study, therefore, the five items were included that showed the lowest correlation with each other. Also, we chose to be consistent in using only single items this time as nodes and not a combination of component scores and single items. This will increase the possibility for future studies to perform precise replications with the same items in other individuals. As we considered ‘feeling down’ to be the closest proxy of depression among the affect states measured, it was used for the examination of autocorrelation and variance, and we also included feeling down as one of the five variables in the network. Subsequently, we added step by step the variable (affect state) that resulted in the lowest average of correlations between all chosen variables. The average of all correlations of the resulting five items (feeling down, irritable, not energetic, tired, and stressed) with each other was 0.48.
Statistical analyses
Change point analysis
Similar as in the previously published case-study we used the ecp R package (James & Matteson, 2014) to establish the presence of a significant change point based on 23 weekly measures of depressive symptoms measured with the SCL-90 depression subscale.
Non-linear detrending using kernel-weighted local polynomial smoothing
Early warning signals (EWS) were calculated based on the momentary affect state measurements as collected with the ex-perience sampling method (ESM). As we measured over almost half a year, non-linear changes in absolute levels of affect states are likely to occur. Such changes in absolute levels of affect may crucially influence the window based autocorrela-tion, variance, and network connectivity that are the focus of this study (Dakos et al., 2012). Therefore, we detrended the data which ensures that resulting patterns in EWS were not the result of changes in absolute levels of affect. Kernel- weighted local polynomial detrending is a suitable method for nonlinear detrending (Cleveland & Devlin, 1988). At each point in the time-series a low degree polynomial is fitted using weighted least squares, giving more weight to observations near the point whose response is being estimated and less weight to observations further away. The value of the regression function for the specific data point is then obtained by evaluating the local polynomial using this local polynomial fit. This results in a continuous function representing the nonlinear change in absolute levels of that variable. For detrending we subtracted the resulting kernel estimations from the observed values to obtain nonlinearly detrended values. See SI figure 1. Robustness check for the detrending procedure
To check the robustness of this detrending method we compared the resulting autocorrelation values based on this method with autocorrelation results based on linear detrending procedures. To minimize the mismatch between linear trend estima-tions and the nonlinear reality we divided the complete time-series into three equal parts. For these three parts different linear trend estimations were made. To obtain the linear detrended values we subtracted the linear trend estimations from the observed values. The correlation in autocorrelation values based on these two methods was 89%. Thus, the kernel detrending procedure does not yield very different results from the adapted linear detrending procedure. Likely, the latter is slightly imperfect as it does not account for subtle non-linear trends within each of the three parts of time-series data. Moving window technique
In order to calculate changing values of autocorrelation, variance, and network parameters we used a moving window tech-nique. As these parameters can only be estimated using multiple measurements, measures of affect in this case, we decided to use a window of 30 days (a max of 90 observations) to estimate each value. The first estimation can thus be calculated at
Wichers et al.: Early warning signals based on momentary affect dynamics
10
assessment 90. Following that estimation the window moves one time point to estimate the second window from assess-ment 2 to assessassess-ment 91. This process continues until the last assessassess-ment has been reached. Note that the estimated value thus represents the average autocorrelation, variance, or network parameter over the past 30 days.
Missing data
As expected in an ESM procedure the time-series data contained missing values. We checked to what extent these missing values were missing at random by examining whether missing values were predicted by mood state at the previous time point and by examining whether missing values predicted mood state at the next time point. These associations were not significant for the variable ‘feeling down’. However, the p-value for the effect of missing values at ‘t’ on ‘feeling down’ at ‘t+1’ was 0.064, which is close to the cut-off of 0.05. This suggests that missing values at t predict a slightly higher level of ‘feeling down’ at t+1. However, given the high number of observations, very small effects can already yield (borderline) significant values, and the effect size hereof was small (standardized effect of 0.23). Mood state did not predict next mo-ment’s missing status.
Missing data were not imputed. Rather, the coefficients of lags involving missing values were not included in the analyses. We thus may have missed out on some measurements at moments with lower mood states and autocorrelation, variance, or network parameter values related to these moments. Given the small effect of missing values on mood, it is unlikely that this fact biased the current results to a strong extent.
Results for the participants without significant symptom transitions
In total 9 individuals were recruited to participate in the pilot study with the aim to replicate the first time-series study (Wichers et al., 2016) which examined EWS using experience sampling monitoring during the tapering of antidepressant medication and to check the feasibility of such long-term monitoring. Three of these individuals (participant 3, 4 and 5) dropped out (after collecting 2, 12 and 42 measurements respectively). This left us with 6 participants with time-series data in the pilot study, of which one had experienced a significant symptom transition (participant 7) as discussed in the main body of this study. To check whether similar rises in EWS as reported for this participant did not occur in the participants without a significant symptom transition we examined those data as well. As autocorrelation and internode network con-nectivity seemed most promising as EWS we aimed to examined those parameters as well for the other participants. One of the remaining 5 participants, however, showed almost no variation in ‘feeling down’. On a scale from 0 to 100 all observa-tions, but one, were below 10.2. This means that the remaining variation here probably results from measurement noise of using the touch screen to indicate a low number on the scale. Therefore, we decided to not analyse the data of this partici-pant (No. 6).
Patterns of autocorrelation and internode network connectivity for the other participants are shown in Figure B.5.
Only 1 out of the 8 EWS (4 autocorrelations and 4 internode network connectivity patterns for the 4 remaining participants) showed a significant increase. This concerned a rising autocorrelation in participant 1 (r=0.39, p<0.001). None of the par-ticipants showed positive signals for both examined EWS, as was the case for the individual examined in the main body of the study. This may suggest that sensitivity of EWS to signal risk for transition may benefit from the combination of multi-ple sorts of EWS, such as the combination of rising autocorrelation and rising network connectivity.
References
Cleveland, W. S., & Devlin, S. J. (1988) Locally Weighted Regression: An Approach to Regression Analysis by Local Fitting, Journal of the American Statistical Association, 83(403), 596-610. https://doi.org/10.1080/01621459.1988.10478639
Dakos, V., Carpenter, S. R., Brock, W. A., Ellison, A. M., Guttal, V., Ives, A. R., Kefi, S., Livina, V., Seekell, D. A., van Nes, E. H., & Scheffer, M. (2012). Methods for Detecting Early Warnings of Critical Transitions in Time Series Illustrated Using Simulated Ecolog-ical Data. PLoS ONE, 7(7), [e41010]. https://doi.org/10.1371/journal.pone.0041010
James, N. A., & Matteson, D. S. (2014). ecp: An R Package for Nonparametric Multiple Change Point Analysis of Multivariate Data. Journal of Statistical Software, 62(7), 1-25. http://dx.doi.org/10.18637/jss.v062.i07
Wichers, M., Groot, P. C., Psychosystems, ESM Group, & EWS Group. (2016). Critical Slowing Down as a Personalized Early Warning Signal for Depression. Psychotherapy and Psychosomatics, 85(2), 114-116. http://dx.doi.org/10.1159/000441458
Wichers, M., Wigman, J. T. W., Bringmann, L. F., & de Jonge, P. (2017). Mental disorders as networks: some cautionary reflections on a promising approach. Social Psychiatry and Psychiatric Epidemiology, 52(2), 143-145. http://dx.doi.org/10.1007/s00127-016-1335-z
11
Appendix B. Supplementary figures
Figure B.1 shows the raw scores of ‘feeling down’ over time (blue dots) combined with the trend line resulting from the
kernel-weighted local polynomial smoothing (brown line). The deviations between the observed values and the smooth trend were used for further analyses.
Wichers et al.: Early warning signals based on momentary affect dynamics
12
Figure B.2 illustrates the changes in weekly depressive symptoms as measured with the SCL-90 depression subscale, and
in levels of “feeling down” measured three times a day with experience sampling (upper panel). We rescaled the “feeling down” score using a division by 2 to plot the measures in the same graph. The lower panel shows the moving window es-timates of the variance of “feeling down”. Note that the moving window procedure is the reason why the time axis starts at assessment 90. The middle and lower panel show the moving window estimates, respectively, of the autocorrelation and variance when calculated based on the total sum of all momentary mental states.
13
Figure B.3
The lower panel shows the moving window estimates of the variance of “feeling down”. Variance peaks before absolute levels of “feeling down” start to increase.
Wichers et al.: Early warning signals based on momentary affect dynamics
14
Figure B.4 shows the change in internode instrength separately for feeling “stressed”, “not energetic”, “irritable”, “tired”
and “down”. Y-axes are the moving window estimates of instrength for each affect state. Autocorrelation was not included in the calculation of instrength. Feeling irritable, tired, and down showed a clear rise in instrength before the symptom tran-sition occurred. Feeling not energetic showed a modest increase. Feeling stressed, however, showed a rise in instrength in the period after the transition. These findings may serve to generate new hypotheses on the microlevel processes involved in the development and maintenance of symptoms.
15
Figure B.5
Autocorrelation and network results for the other participants in the pilot data with usable time-series data who did not ex-perience a significant symptom transition. We rescaled the autocorrelation score, by multiplying with a factor 50, to plot these values in the same graphs with the absolute value of feeling down. These patterns are depicted, per participant, in the upper panel. The lower panel shows the change over time in internode network connectivity. The x-axis represents time in terms of measurement moments.