Bank capitalization
and credit rating
assessment
MASTER THESIS WITHIN: Business Administration NUMBER OF CREDITS: 15 ECTS
PROGRAMME OF STUDY: International Financial Analysis
AUTHOR: Evgenia Dimitrova
TUTOR: Dorothea Schäfer
JÖNKÖPING May 2016
Acknowledgment
I would like to take this opportunity and express my special and sincere gratitude
to my supervisor Dorothea Schäfer who provided me with her constant assistance
and valuable feedback in this process.
Evgenia Dimitrova
Jönköping International Business School
May 2016
Master Thesis within Business Administration
Title:
Bank Capitalization and Credit Rating Assessment: Evidence
from the EBA stress test
Authors:
Evgenia Dimitrova
Tutor:
Dorothea Schäfer
Date:
2016-05-23
Subject terms:
Bank capitalization, Moody’s credit rating assessment, EBA
stress test, capital structures, banks adequacy and solvency,
excess equity
Abstract:
Banks face market pressure when determining their capital structures because they are subject to strict regulations. CFOs are willing to adjust their company’s capital structures in order to obtain higher ratings. The credit ratings are highly valuable not only because they assess the creditworthiness of the borrowers but also because those agencies take advantage of the information asymmetry and have access to data that companies might not disclose publicly. Also, this industry gained much interest after the BIS proposals back in 1999 and 2001 that the Basel Committee on Banking Supervision should consider the borrower’s credit ratings when examining banks’ solvency and adequacy.
Factors used to determine the credit ratings are banks’ asset quality which is fundamental measure for the creditworthiness, banks’ capital which is related to the asset quality in relation to the RWA, banks’ profitability, and liquidity measurements.
The purpose of this paper is to investigate whether the banks that keep excess equity to balance sheet receive better credit ratings, given the predictors capital, banks size and defaulted to total exposures. The European Banking Authority (EBA) stress test results are used as a benchmark for determining banks’ capital adequacy and solvency, whereas the credit ratings are obtained shortly after the EBA’s reports publication. The sample size is 73 and 95 banks for the years 2011 and 2014, respectively.
The results from the multivariate ordinal regression do not show significant correlation results between the excess equity to balance sheet and the credit ratings, even though the estimated coefficient is negative, namely excess equity is associated with lower credit ratings. An explanation to this one can find in the low-quality capital relative to the banks’ capital base. Also, banks which plan to implement risker projects or currently hold risker assets are subject to higher capital requirements. Moreover, banks currently being rated low but with the potential of being upgraded would be more willing to issue equity than debt in order to avoid the corresponding risk and achieve the higher rating. The equity ratio and the defaulted to total exposures ratio show significant correlation to the banks’ credit ratings.
Overall, since the results of the regression are insignificant, we do not have reasons to believe that holding excess equity is not beneficial for banks. When banks make changes in their leverage ratios they would either carry the cost of being downgraded or the cost related to issuing more equity, therefore at the end they will balance the leverage ratio close to the optimal and keep as much capital as required by regulations.
Table of Contents
1
Introduction ... 1
1.1
Problem Discussion ... 2
1.2
Purpose ... 3
1.3
Research Questions ... 3
1.4
Delimitation ... 3
2
Theoretical framework ... 4
2.1
Stress test ... 4
2.2
Basel framework ... 5
2.3
Bank capitalization ... 6
2.4
Credit ratings ... 7
2.4.1
CR-CS hypothesis and Trade-off theory ... 7
2.4.2
The pecking order theory ... 7
2.5
Literature review ... 8
3
Methodology ... 9
3.1
Choice of method ... 9
3.2
Data collection ... 9
3.2.1
Searching parameters ... 10
3.2.2
Aggregate Stress Test results for 2014 ... 10
3.2.3
Aggregate stress test results for 2011 ... 11
3.3
Data analysis ... 11
3.3.1
Excess Equity to Balance Sheet Ratio ... 11
3.3.2
Defaulted to Total Exposure Ratio ... 12
3.3.3
Leverage ratio ... 12
3.3.4
Balance Sheet Amount ... 12
3.3.5
Equity Ratio ... 13
3.3.6
Ordinal regression ... 13
3.4
Research Quality ... 14
3.4.1
Research validity and replicability ... 14
4
Empirical findings ... 14
4.1
Excess equity to balance sheet ... 14
4.2
Assumption checking - Multivariate ordinal regression ... 15
4.2.1
Multicollinearity diagnostic checking – Assumption 3 ... 15
4.2.2
Test of Parallel Lines – Assumption 4 ... 18
4.3
Multivariate ordinal regression ... 19
4.4
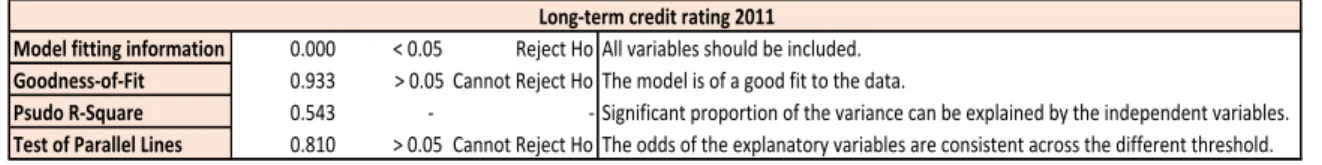
Multivariate ordinal regression results for 2011 ... 19
4.4.1
Long term credit ratings ... 19
4.4.2
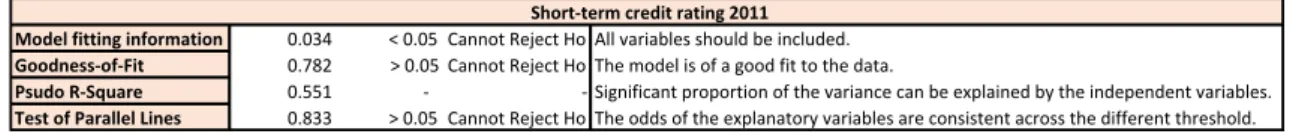
Short term credit ratings ... 20
4.5
Multivariate ordinal regression results for 2014 ... 21
4.5.1
Long term credit ratings ... 21
4.5.2
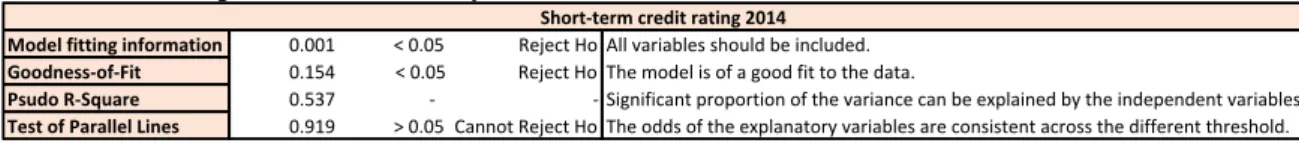
Short term credit ratings ... 22
5
Analysis ... 23
6
Conclusion ... 25
7
Discussion ... 26
Tables
Table 1 Searching parameters ... 10
Table 2 Moody's credit rating scale ... 11
Table 3 Bank size groups according to the ECB ... 13
Table 4 Multicollinearity tests for Long- and Short-Term credit ratings for 2011 ... 16
Table 5 Multicollinearity tests for Long- and Short-Term credit ratings for 2014 ... 17
Table 6 Multicollinearity tests for Long- and Short-Term credit ratings after adjustments
for 2014 ... 17
Table 7 Multicollinearity tests for Long- and Short-Term credit ratings after adjustments
for 2014 ... 17
Table 8 Test of Parallel Lines for Long- and Short-Term credit ratings for 2011 ... 18
Table 9 Test of Parallel Lines for Long- and Short-Term credit ratings for 2014 ... 18
Table 10 Summary: Ordinal regression for long-term ratings in 2011 ... 20
Table 11 Ordinal regression for long-term ratings 2011 ... 20
Table 12 Summary: Ordinal regression for short-term ratings 2011 ... 21
Table 13 Ordinal regression for short-term ratings 2011 ... 21
Table 14 Summary: Ordinal regression for long-term ratings 2014 ... 22
Table 15 Ordinal regression for long-term ratings 2014 ... 22
Table 16 Summary: Ordinal regression for short-term ratings in 2014 ... 22
Table 17 Ordinal regression for short-term ratings 2014 ... 23
Table 18 Case summary - Long term credit ratings 2011 ... 32
Table 19 Model Fitting Information - Long term credit ratings 2011 ... 32
Table 20 Goodness-of-fit - Long term credit ratings 2011 ... 32
Table 21 Pseudo R-Square - Long term credit ratings 2011 ... 32
Table 22 Parameters Estimates - Long term credit ratings 2011 ... 33
Table 23 Odds Ratios - Long term credit ratings 2011 ... 33
Table 24 Case summary - Short term credit ratings 2011 ... 34
Table 25 Model Fitting Information – Short term credit ratings 2011 ... 34
Table 26 Goodness-of-fit - Short term credit ratings 2011 ... 34
Table 27 Pseudo R-Square - Short term credit ratings 2011 ... 34
Table 28 Parameters Estimates - Short term credit ratings 2011 ... 35
Table 29 Odds Ratios - Short term credit ratings 2011 ... 35
Table 30 Case summary - Long term credit ratings 2014 ... 36
Table 31 Model Fitting Information - Long term credit ratings 2014 ... 36
Table 32 Goodness-of-fit - Long term credit ratings 2014 ... 36
Table 33 Pseudo R-Square - Long term credit ratings 2014 ... 36
Table 34 Parameters Estimates - Long term credit ratings 2014 ... 37
Table 35 Odds Ratios - Long term credit ratings 2014 ... 37
Table 36 Case summary - Short term credit ratings 2014 ... 38
Table 37 Model Fitting Information - Short term credit ratings 2014 ... 38
Table 38 Goodness-of-fit - Short term credit ratings 2014 ... 38
Table 39 Pseudo R-Square - Short term credit ratings 2014 ... 38
Table 40 Parameters Estimates - Short term credit ratings 2014 ... 38
Table 41 Odds Ratios - Short term credit ratings 2014 ... 39
Table 42 EBA stress test - banks sample 2011 ... 40
Table 43 EBA stress test - banks sample 2014 ... 41
Appendix
1
Introduction
The current chapter aims to introduce the reader in the topic of bank capitalization and credit rating assessment. It briefly outlies the relationship between banks’ capital structures and the credit ratings. Moreover, it highlights the importance of having regulated banking system by introducing the EBA stress test implication. Also, the purpose and the research questions are presented.
The literature does not seem convincing when discussing whether bank capital decisions are determined based on obligations to meet the regulatory requirements or based on market pressure from both investors and borrowers (Berlin, 2011). Since banks are efficient supplier of short-term balance to householders, firm and other financial institution, they will always be leveraged and keep risk assets portfolios (Tucker, 2014).
Banks are recommended to hold minimum amount of capital required by regulations. However, sometimes controversy occurs between the regulators, the theoretical models and the bankers. For example, the Modigliani-Miller basic theorem, in the corporate finance, which states that a firm’s value is independent of its capital structure (Miller, 1988) seems to be in conflict with bankers’ opinion that holding equity is too expensive and will affect the price of the credit (The economist, 2009). Even though banks are subject of capital regulations, the capital comes at a high cost, therefore managers would prefer to hold only as much as to meet the minimum requirements (Mishkin, 2000). However, market forces have more influence on banks in terms of bank’s capital decisions determination than the regulatory effects have, which challenges the assumption that banks keep as little capital as the supervision permits (Flannery and Rangan, 2002).
The question what determines bank’s capital structures is addressed by Gropp and Heider (2010). Firms leverage ratio is expressed as the value of a firm’s debt to the value of the total assets (Berlin, 2011). In the banking system, however, the leverage ratio represents the equity a bank holds as a percentage of the total assets.
Gropp and Heider (2012) prove in their research paper that banks follow the same pattern as firms when estimating the leverage ratio. Furthermore, Graham and Harvey (2001) conclude that when determining capital structures, CFOs are highly concerned about their company's credit rating grade. Credit ratings influence the costs associated with debt and equity financing. The focus of how the credit ratings impact the capital structures was highlighted by Kisgen (2006). Baek and Crusio (2015) conclude that companies near a potential upgrade are more likely to adjust their capital structure in order to achieve this upgrade and those near a downgrade would transform it in order to avoid the lower grade.
The credit ratings are essential part of the financial system in terms of providing information to investors. Hence, changes in the ratings can influence the market (Baek & Cursio, 2015). Moreover, the three major agencies namely Moody’s, Fitch and S&P, have a great market influence and market capitalization (Partnoy, 2002). The credit ratings assess the creditworthiness of the borrowers by capturing their default risk. But also, the credit rating agencies might have access to data that is not publicly available which is the reason why they are so highly valuable (Kisgen & Strahan, 2010).
The credit rating industry gained much interest after the Bank for International Settlements (BIS) had two proposals in June 1999 and January 2001 that the Basel Committee on Banking Supervision should include borrower’ credit ratings in the assessments of the adequacy of banks’ capital (White, 2002). However, during the financial crisis period in 2007 and 2008, the attention was highly concentrated on the ratings given to banks since many failing banks enjoyed a favourable grading shortly before default (Hau, Langfield & Marques-Ibanez, 2012). These events
left the impression that the credit rating system is not objective and there might be mistakes in the assessments.
1.1 Problem Discussion
The capital requirements as a research topic in the developing countries has been addressed in several papers. Rojas-Suares (2001) found that the capital requirements would not influence or strengthen banks in the emerging markets. Ferri, Liu and Majnoni (2001) assess the impact of the credit rating agencies contemplated by the Basel requirements in the low income countries. Their conclusion is that linking capital assets requirements to external rating agencies would have a negative effect on those countries because the ratings are not as highly widespread as in the developed ones. However, credit ratings can be used for a variety of purposes and reasons. Some companies use them as a check of their own findings, other use them because of their acknowledged high public value and worldwide recognition. In 2012, the European Central Bank published a paper which examines the quality of the credit ratings assigned by the three leading credit rating agencies in major banks in Europe and United States over the past two decades (Hau, Langfield & Marques-Ibanez, 2012). The analysis show that big banks enjoy more favourable credit ratings in relation to their default risk. The authors also mention about existing conflict between banks and credit rating agencies in relation to the “too big to fail” banks whose substantial economic power turns them into “too big to downgrade” for the agencies, and this creates biases in some of the results (Hau, Langfield & Marques-Ibanez, 2012).
There is much of credit rating shopping going on in the market. The question which gained much publicity is if it is accurate the main revenue stream of the credit rating agencies to come from companies which products are being rated (Bolton, Freixas, & Shapiro, 2012). This question also raised much popularity after the East Asian Financial Crisis from 1997 and the failure of Enron in 2001 and WorldCom in 2002 who have received very favourable credit ratings shortly before default (Bolton, et al., 2012). Moreover, according to SEC, the rating agencies are paid after the ratings are issued, hence, it is possible for the issuer to seek another rating, if they are not satisfied with the result. Basel II critics reproached the increased dependence the society is placing on credit rating agencies to determine risk weights given all of the above mentioned facts (Demirgüç-Kunt, Detragiache & Merrouche, 2010). Also, the increased reliance on banks internal rating based approach creates inconsistency and non-transparency between them.
Banks need to be regulated because of the fragility of their balance sheets (Tucker, 2014). Basel Committee was created in 1975 with the purpose of designing efficient bank regulations and supervisory (Goodhart, 2011). The 1988 Basel Accord on capital standards focused on the measurement of capital and the capital standards for credit risk (Santos, 2001). Countries under the Basel regulations are to large extend dependent on capital ratios formed on the basis of risk-weighted assets (Angora, Distinguin & Rugemintwari, 2009). With the new regulations accord, the raised minimum capital requirements are potential source of costs, despite the improved bank stability (Santos, 2001).
Partnoy (2002) finds the Basel Capital Accord as a non-accurate because it covers risk weights which are dependent on the credit ratings and suggest that policymakers should avoid implementing new regulations which are directly dependent on the credit ratings. Hite & Warga (1997), Partnoy (2002) and Grothe (2013) confirm that the ratings changes lag the market information, very often they are not a criterion for investment decisions anymore, and the market can foresee the credit rating changes.
The upward trend in the capital ratios noticeable among banks from the G-10 countries, namely Belgium, Canada, France, Germany, Italy, Japan, the Netherlands, Sweden, Switzerland, the UK and the US during the 1990s raised awareness of the topic why banks hold more capital than it is required by the regulators (Angora, et al., 2009). Scholars expect that banks hold their capital ratios close to the minimum capital requirements since the higher the ratios, the more restricted banks competitiveness is because equity is more expensive than debt. Controversially to these
expectations, however is that banks hold excess capital, which might be due to market pressure or during periods of economic upturns (Angora, et al., 2009).
The consequences of the European debt crisis imposed some policy regulations for an adequate bank capitalization (IMF, 2011). The European Banking Authority (EBA) stress test is designed to test banks’ financial stability in conditions of economic uncertainties and provide forward looking risk assessments. It is a valuable tool for monitoring and identifying trends, possible risks and vulnerabilities across the markets in the European Union (EBA, 2015).
Based on the EBA stress test data for 2011 and 2013, this study will analyse how the excess equity to balance sheet ratio reflects the credit ratings assessments of some of the major European banks and investigate whether the credit ratings are reliable and unbiased reflection of the bank capital situation. Banks excess equity to balance sheet is measured as the ratio of the difference between the equity and the equity capital requirements to the balance sheet amount.
1.2 Purpose
The purpose of this paper is to investigate whether banks keeping excess equity to balance sheet receive better credit rating. The European Banking Authority (EBA) stress test results are used as benchmark for determining banks’ capital adequacy and solvency, whereas the credit ratings are obtained shortly after the EBA’s reports publication.
1.3 Research Questions
1. What is the effect of the excess equity to balance sheet ratio on the credit ratings reported by Moody’s credit rating agency for major European banks examined by the EBA stress test?
2. Do European banks which keep excess equity enjoy favourable credit ratings?
1.4 Delimitation
The European Banking Authority has a responsibility to maintain functioning and stable financial system in the EU, therefore it uses stress test as a monitoring tool for trend identifications, possible risks and vulnerabilities across the market (EBA, 2015). The EBA stress test provides complete information on the capital requirements set by the regulatory and the banks’ capital adequacy and solvency. Hence, the data from the EBA test is used for further analysis.
In order to fulfil the purpose of this study, I have chosen to work with the same sample size as used in the EBA stress test exercise for the years 2011 and 2014. The number of stress tested banks in 2011 and 2014 is 90 and 123, but due to insufficient information on credit ratings, only 73 and 95 banks are used in the current study.
The EBA stress tests of 2009 and 2010 do not examine the individual banks but assess the whole European financial systems’ adequacy and capability to overcome economic shocks and downturns. The stress test of 2016 has not been published within the timeframe of the current study, therefore those tests are disregarded in this paper.
Moody’s credit rating agency provides at most comprehensive current and historical information on credit rating assessments for most of the European banks observed in the EBA stress test exercise which is freely accessible online, therefore this study is based on their assessments. As further explained, Moody’s publishes both long- and short-term ratings, therefore with regards to the statistical part of the research, they are tested separately.
2
Theoretical framework
This chapter introduces the reader to key concepts such as stress test, credit ratings and bank capitalization. Moreover, I present previous findings on the CR-CS relationship and introduce concepts such as the Basel framework, the trade-off theory and the CR-CS hypothesis which will serve as a framework for further analysis and interpretation of the results.
2.1 Stress test
The stress test is a tool implemented by the European and American regulators to assess and address the solvency conditions of the financial systems in adverse unexpected outcomes (Basel Committee on Banking Supervision, 2009; Acharya, Engle, & Pierret, 2014). After the financial crisis in 2008 the aim of the test became to strengthen banks and supervisory practices and to prevent financial distresses to spread in the economy (Acharya et al., 2014). The stress tests provide forward looking information on risk assessment and how much capital banks are required to hold in order to be able to cover losses if large economic shocks occur. The stress test provides results based on two different scenarios, namely baseline and adverse scenario. The baseline scenario considers situations in which banks perform in a favourable economic situation with a relatively moderate economic growth. The stress tests usually focus on the adverse macroeconomic scenario which occur when there are some deviations from the baseline (Acharya et al., 2014).
According to Greenlaw et al. (2012) and Acharya et al. (2014) the stress tests are not only macro but also micro prudential in nature because they focus on the wealth of individual banks. Generally, the stress tests are outcomes of macroeconomic scenarios defined by the European Central Bank presenting an overall assessment of the systematic risk in the financial system of the European Union.
The European Banking Authority (EBA) stress test exercise takes into consideration several risk dimensions.
- The credit risk is the one affecting both the profit and loss account (P&L) and the risk-weighted assets (RWA), because it is measured based on macroeconomic scenarios on default and loss parameters (ECB, 2014).
- The market risk which occurs from changes in the market prices (ECB, 2014). Key stress test figures are the banks’ capital ratios and factors that influence them such as profit and loss figures and key capital position data. The purpose of the stress is to identify capital shortfalls and require recapitalization plans from those banks failing to meet the minimum capital requirements. Among the key stress test figures are:
- Common Equity Tier 1 Capital (CET1) – the capital that the bank has readily available in the beginning of the stress test and based on which are evaluated the baseline and adverse scenarios.
- Common Equity Tier 1 Ratio (CET1 ratio) - the funds bank has readily available expressed in terms of the total exposure.
𝐶𝐸𝑇1 𝑟𝑎𝑡𝑖𝑜 =𝐶𝑜𝑚𝑚𝑜𝑛 𝐸𝑞𝑢𝑖𝑡𝑦 𝑇𝑖𝑒𝑟 1 𝐶𝑎𝑝𝑖𝑡𝑎𝑙
𝑅𝑖𝑠𝑘 − 𝑤𝑒𝑖𝑔ℎ𝑡𝑒𝑑 𝑎𝑠𝑠𝑒𝑡𝑠
- Total Risk Exposure – includes the total bank exposure such as cash and equities, which are subject to a certain risk. For example, the cash is perceived as less volatile and hence less risky than the equities. Referred also to as RWA in the EBA stress test, the total
exposure is derived upon Basel II and covers credit, operation and market risk components (Acharya et al., 2014). The best way for assessing credit risk to bank’s exposure and assigning their corresponding risk weights is to use the CET1 ratio (BIS, 2014).
• Core Tier 1 Capital (CT1) – composed primarily of permanent shareholders’ equity (Alfriend, 1988; Acharya et al., 2014). The Core Tier 1 consists of CET1 capital and Additional Tier 1 capital (AT1), which can be contingent convertible bonds(CoCo-Bonds) or other non-redeemable and non-cumulative preferred stocks.
2.2 Basel framework
The Basel Committee on Banking Supervision, established in 1988, published a set of regulations which provide a strong base for the macro prudential stress tests when defining banks’ financial performance measures i.e. the capital ratios (Acharya et al., 2014). The new regulations would stabilize the international banking system by removing the source of competitive inequality raised by the different national capital requirements (BIS, 2015). Basel I established a minimum capital ratio of 8% of the RWA, however more advanced framework was needed in order to be able to address not only the credit risk but also risk arising from banks’ foreign market exposure, traded debt, equities, commodities and equities.
Basel II framework was introduced in 2004, almost six years after the first Committee proposal (BIS, 2015). One of the Basel framework’s prescriptions is the use of external credit ratings when banks are about to determine risk weights of exposures (BIS, 2014). However, despite the valuable credit rating assessments on banks credit risk exposure, it is apparent that a significant proportion of banks’ exposure remains unrated (BIS, 2014). Hence, it is needed an alternative solution to the external ratings for the risk diversification. Under Basel II, banks have two alternatives to determine the capital requirements for credit risk, namely standard approach and internal rating based approach. The former measures credit risk supported by external credit assessments, while the latter one allows banks to use their internal rating systems for credit risk (Joosen, 2016). Basel III is a framework introduced in response to the financial crisis in 2008 which main idea is to strengthen banks’ capital basis, hence, improving the whole economy (BIS, 2010). According to this framework, a way to assure consistency in the liquidity risk supervision is to develop a set of monitoring tools used in the process of tracking banks’ liquidity risk exposures. It concentrates on the implementation of new quantitative and qualitative requirements concerning the liabilities side of the banks’ balance sheets (Joosen, 2016). Moreover, the Basel III is introduced in order to fill the gaps of the already existing frameworks and contribute to the overall financial stability by strengthening the regulatory capital framework, and it is expanding on Basel II three pillars (Basel Committee, 2010; Krug, Lengnick & Wohltmann, 2015). These new regulations promote enhanced quality and quantity of the capital base for banks and strengthened risk coverage of the capital framework.
Basel III minimum capital requirements are constantly increasing throughout the years. The minimum common equity ratio raised from 2% to 3.5% in 2013 and to 4% in 2014. The Core Tier 1 capital ratio also increased from 4% to 4.5% in 2013. The most recent thresholds of the Basel III capital requirements include even higher CET1 ratio equal to at least 4.5% of the RWA, Tier 1 Capital at least 6.0% of the RWA and Total Capital (Tier 1&2) of at least 8.0% of the RWA (Basel Committee, 2010). The EBA would be monitoring the impact of the Basel III capital requirements on samples of European banks since June 2011.
Slovik and Cournède (2011) found in their study that some banks in US, Japan and EU have already increased their capital ratios as a pre-crisis measure from the market pressure by the end of 2009. Hence, their recommendation is that Basel III capital requirements for Tier 1 should be reduced by the increase already obtained. Moreover, by 2019, on average, banks will increase their CET 1 by 3.7% and Tier 1 capital ratio by about 3.0% in order to meet the capital requirements.
2.3 Bank capitalization
Banks capital serves two main purposes. Similarly, to any other business, the capital is an input to the production process and the capital investments should correspond to banks capital rate of return. Also, the capital is a tool used to attract deposit funds, which are essential part of the production process, and they provide insurance to depositors against a drop in banks assets (Mingo, 1975; Peltzman, 1970). The capital is viewed as a residual which is able to absorb losses (Dietrich & James, 1983). Bank regulators examine the riskiness of banks assets and banks capital capacity to overcome periods of declines without incurring losses for the depositors (Peltzman, 1970). Banks balance sheet can undergo changes depending on whether the asset portfolio is considered to be risky or capital inadequate, and hence, a bank can choose to hold more capital or less risky assets. Banks should also strive to achieve an appropriate balance between holding less risky portfolios and more adequate capital, which is also the main focus of the regulators in their examination activities. The better capitalized banks experience smaller decline in their equity value during periods of economic downturns (Demirgüç-Kunt, Detragiache & Merrouche, 2010). Moreover, with more capital banks would be able to absorb loses which reduces the possibility of a liquidity problem (Moody’s, 2016).
Banks equity capital accounts for about 10 percent of the total bank’s resources (Peltzman, 1970). However, the owners rarely use capital directly to buy assets, but instead they use it to attract deposits with which to purchase capital later. Moreover, the equity financing incentives are different in banks and nonfinancial firms primarily due to the deposit insurance, which transfers the risk from the depositor to the insurer (Dietrich & James, 1983).
Peltzman (1970) concludes that no significant evidence can support the statement that banks investment behaviour conforms to the regulatory standards. Dietrich and James (1983) also support the evidence that regulatory capital standards are not efficient. Mingo (1975), on other hand, contradicts other researchers that banks investments capital is not affected by regulators desires. His findings are that the lower the ratio of actual capital to desired capital is, the more likely bankers are to add capital over the next period, to satisfy regulators desires. The contradicting results might be raised from the assumption made by Peltzman that there is a linear regression between the capital investment and the regulator’s capital adequacy standards and because of the aggregated data he used in the analysis (Dietrich & James, 1983).
Dahl and Shrieves (1990) explain in their research how the capital standards influence the infusion of equity in commercial banks which builds on previous researches on how bank regulations affect the capital structures. Central issue concerns whether the capital structures arise from natural capital market forces or they result from the minimum capital adequacy standards imposed by regulators. Some changes in capital or capital ratios might be caused by factors which are only partially controllable such as modification of dividend policies or asset size. Hence, a heavy reliance on those ratios as a metric for bank capital adjustments and modification might lead to misleading interpretations. However, equity issue is important for the banks’ capital structures, outsiders, and regulators as a proof that banks are committed to improve their capital positions (Dahl & Shrieves, 1990).
The equity infusion is positively correlated with growth rate, market concentration and location in urban market areas but only for the well capitalized banks (Dahl & Shrieves, 1990). However, better capitalized banks have higher probability to issue equity than lower capitalized banks. The infusion of equity has significantly larger proportion in the presence of regulation than it would have had in the absence. Hence, minimum capital requirements are to some extend impacting the bank's equity issuance (Dahl & Shrieves, 1990).
Holding equity comes at a higher price for banks due to the information asymmetry, hence the equity capital is expected to be negatively correlated to the cost (Angora, et al., 2009). For example, under Basel II requirement banks are required to hold more capital if they are about to imply riskier plans or hold riskier assets (Angora, et al., 2009).
2.4 Credit ratings
The credit ratings are not only examining the current financial performance and stability of the issuer, but they also incorporate forward looking expectations regarding the overall vulnerability of default of the issuer, industry and overall economy (Moody’s, 2006; Ueda & di Mauro, 2013). The most widespread category is the overall credit rating which assess the issuer’s ability to meet its financial obligations and cope during adverse business and economic crisis (Ueda & di Mauro, 2013).
Cantor and Packer (1996) explain the quantitative indicators taken into consideration in the credit rating determination such as per capita income, GDP growth, inflation, fiscal balance, external balance, and external debt. According to Hand, Holthausen and Leftwich (1992) the credit rating announcements by two of the big agencies S&P and Moody’s directly affect the corporate bond and stock prices.
The credit rating agencies list a number of economic, social and political factors which could possibly influence the credit rating. For example, the overall long-term ratings are lower after the crisis period in 2009 than they are before the crisis in 2007 (Ueda & di Mauro, 2013). For the investors, a potential downgrade would lead to losses, increased capital costs and restricted capital access for issuers which might result in default (Fons, Cantor & Mahoney, 2002). On other side, an upgrade is very favourable for the issuer, allowing for greater capital market access and interest cost savings, as well as enhanced security prices for the investor (Fons, Cantor & Mahoney, 2002). Credit ratings determine the creditworthiness of the issuers, which can also be expressed as the expected loss rate, which is a sum of the expected default rate and the loss-severity rates (Fons, Cantor & Mahoney, 2002).
Kisgen (2004) reveals that the credit rating agencies might have access to information besides the publicly available one, since they take advantage of the information asymmetries. Also, they might be provided with information that firms are reluctant to disclose publicly, therefore their creditworthiness assessments are considered as highly reliable.
The credit ratings usually represent not only the quality of the debt obligations but also the overall frim situation. Companies in the same rating category are often pooled together and all firms will be assessed similarly disregarding the extreme values (Kisgen, 2004). Hence, firms near a potential change in the rating will have more incentives to keep the higher grade and be pooled with highly rated companies.
2.4.1
CR-CS hypothesis and Trade-off theory
Kisgen (2004) bases his paper on the Credit Rating Capital Structure hypothesis (CR-CS), which is built upon the belief that managers’ decisions on the capital structures are influenced by the credit rating announcements mainly due to costs and benefits associated with the differences in the ratings.
Those firms near a potential downgrade would issue less debt relative to equity than the ones which are not near a change in the rating or elsewise face the cost associated with a change in the rating (Kisgen, 2004).
The trade-off theory argues that the firm will balance its leverage ratio close the optimum (Kisgen, 2004). Applying that into the the CR-CS hypothesis have the implication that banks’ capital structures would change accordingly.
2.4.2
The pecking order theory
The pecking order theory is quite similar to the trade-off theory and plays an important role in the capital structures decision making. Firms usually prefer not to issue equity because it is a costly source of funding, and instead search either for internal source of financing or debt (Frank & Goyal, 2003; Kisgen, 2004). The equity has higher risk premium than debt and retained earnings, therefore investors would demand higher returns on equity. The standard pecking
theory suggests that firms avoid issuing equity as a source for project financing but instead issue debt when the internal cash flows are scarce for the investment (Shyam-Sunder & Myers, 1999). Equity is issued in cases then there is a junk debt or the financial distress costs are extremely high. Kisgen (2004) states that in contrast to the pecking theory, some firms near a credit rating upgrade might prefer to issue more equity than debt to avoid the corresponding risk, and likewise to avoid issuing debt when there is a foreseen downgrade.
2.5 Literature review
Ueda and di Mauro (2013) address the problem of the “too-systematically-important-to-fail” financial institutions which failure can be prevented through implementing tighter regulations or increased capital buffers. The authors are estimating the impact of the structural subsidy embedded in the credit ratings, since the ratings evaluate not only the institution’s own financial strength but also the external support it receives. They come to a conclusion that an increase in the government support impacts the overall long-term credit rating with an increase of up to 0.9 notches during the pre-crisis period. This impact nearly doubled in 2009. Moreover, the authors support previous findings that the credit ratings tend to overrate structural products.
One of the most important research papers in the field is written by Kisgen (2004), concluding that firms near positive rating change are more likely to adjust their capital structures in order to obtain the more favourable grade. Further investigations test different theories which are influential factor in the capital structure decision making. The pecking and the trade-off theory provide strong evidences of why companies choose to keep certain leverage ratios and why issuing equity is not a preferable option.
Greenlaw, Kashyap, Schoenholtz and Shin (2012) suggest that in order to be able to overcome banks undercapitalization, EBA’s stress test recommendations should be provided in euro amounts instead of ratios, because in order to comply with the regulations requirements banks tend to reduce their asset base (Acharya, et al., (2014). The problem with using capital ratios is that the denominator is the risk-weighted assets and its disclosure can be limited or inconsistent across banks. Demirgüç-Kunt et al. (2010) contribute to the above findings by testing whether strong capital positions are associated with strong stock market performance. If the capital is measured by leverage ratio and not risk-adjusted ratio, then the relationship between the stock and capital will be significantly stronger, because the risk-adjusted capital ratios under the Basel requirements are usually subject to manipulation.
Acharya et al. (2014) conclude in their paper that the Basel risk standards do not provide any incentives for diversification, so firms build their entire portfolios on one asset category, ignoring the risk weights which results in excess leverage. As a consequence, banks’ exposures are built upon low-weighted risk assets. Moreover, stress tests cannot capture ex ante the increased risk unless there are market-based measures, thus stress tests relying only on Basel regulation are not sufficient.
Poon and Firth (2005) examine the trend of the credit agencies to grade banks that have not requested it with significantly lower ratings. They test several banks in terms of asset quality and profitability. Firm that did not request a rating are said to receive a “shadow” rating since the agencies base their decision entirely on publicly available information. The authors come to a conclusion that the shadow banks have lower asset quality and less equity capital to absorb the losses.
The credit rating agencies and existing literature lack reporting details on what impact the credit rating determination. Mellios and Paget-Blanc (2006) find that past upgrades do not prefigure future upgrades, whereas once start downgrading a particular company, the agencies tend to overreact which presumes future downgrades as well. Therefore, it is important to determine what influences the ratings and how banks can avoid future sequence of downgrades. The expected default frequencies incorporate equity market expectations and are used my Moody’s credit rating
agency as a measure or risk (Hau, et al., 2012). The stock market reacts to changes in the ratings but so far there are no evidence on whether the imposed minimum capital requirements, and in particular equity holdings, are related to favorable credit ratings.
3
Methodology
In this chapter, I justify the chosen quantitative research method and present the techniques used for data collection. Moreover, I disclose an aggregate summary of the stress test results for 2011 and 2014, as well as an explanation of the multivariate ordinal regression and the control variables used for data analysis.
3.1 Choice of method
In order to achieve the purpose of this theses to investigate how the credit rating assessments are related to the bank’s capital structures, I have chosen to conduct quantitative research. This method allows the researcher to focus on hypothesis and theory testing, by using empirical data in order to see if they are supported or not (Johnson & Christensen, Larry, 2012).
The quantitative research follows confirmatory method, meaning first the researcher set the hypothesis, often based on already existing theory, second, he tests them empirically using the collected data, and finally, the researcher makes a decision whether to reject or accept the hypothesis based on the statistical tests (Johnson & Christensen, Larry, 2012).
The quantitative research uses data which can be statistically tested and expressed numerically (Bax, 2013). The quantitative method is part of the empirical studies, also called statistical researches, and it includes experimental and quasi-experimental studies (Campbell& Stanley, 1963; Newman & Benz, 1998). In order to be able to make general conclusions for a particular population based on a random sample of it, one need to have strict control of variables, randomization and valid and reliable measures (Newman & Benz, 1998).
The qualitative research, on other hand, is used in cases when there is little information available about certain phenomena, and the researcher would like to bring new concepts and hypothesis about this unknown event. Hence, the qualitative research follows exploratory method, meaning first the researcher makes observation, second he identifies an existing pattern from them, and finally he draws a conclusion and makes generalization on this phenomena (Johnson & Christensen, Larry,2012).
The quantitative approach is more appropriate for this study because I attempt to test relationship between variables, namely credit rating assessments and banks excess equity to balance sheet, and identify whether the EBA stress test results on excess equity are correlated with the credit rating assessments. However, the theories underlying the theoretical framework are incorporated in the analysis part, in order to provide clearer interpretation of the statistical results.
3.2 Data collection
The appropriate techniques and methods are essential part of the research process when collecting the data. Considering the quantitative essence of the research, I base my paper on secondary data collected from well-known and publicly accessible sources. Johnson & Christensen, Larry (2012) define secondary data as one which is usually collected, recorded and stored at some previous point in the time by other people and for different purposes than the purpose of the current study.
The choice of banks is based on same sample as the EBA stress test exercise for 2011 and 2014. There are 73 and 95 banks used in the current study which is slightly less than the original sample due to information unavailability.
The credit ratings from Moody’s were obtained from a database provided on their official website. However, several banks were withdrawn from credit ratings before and during 2011, hence no data can be obtained.
The European Banking Authority makes a decision on which banks to include in the stress test based on the total value of banks assets which should be above €30 billion and the ratio of the total assets to country’s GDP which has to be higher than 20%, where an exception is made for those banks with total assets of less than €5 billion (ECB, 2014). Only the European banks meeting those requirements can be stress tested.
Each year is tested individually and the results are reported separately.
3.2.1
Searching parameters
Relevant articles and publication on the EBA stress test, credit rating assessments, excess equity, capital adequacy and bank capitalization were retrieved from well-known databases such as Scopus, Google Scholar, Jönköping University Library and Primo.
Database search engines Scopus, Google Scholar, Jönköping University Library, Primo
Key words EBA, stress test, excess equity, bank solvency,
bank capitalization, credit rating assessment, credit rating agencies, Basel capital accord, Basel framework, excess equity, leverage ratio, capital adequacy.
Literature types Academic articles, Books, Internet
Publication period 1965 – 2016
Languages of publication English
Table 1 Searching parameters
3.2.2
Aggregate Stress Test results for 2014
The stress test for 2014 was published on 26th of October 2014. The stress test summary report
for 2014 presents aggregate results for all 123 tested European banks for the time horizon 2014 to 2016. Its focus is on the solvency ratio (CET1) under the two macroeconomic scenarios. The minimum CET 1 ratio is set to 4.5% of the RWA. Under the baseline scenario the CET 1 ratio equals 8%, whereas under the adverse scenario it is 5.5%. The average CET1 ratio at the end of 2013 is equal to 11.5% (EBA, 2014).
Whereas under the baseline scenario the aggregate CET1 ratio increases from 11.1% in 2013 to 11.7% in 2016, the adverse scenario decreases to 8.5% in 2016. Under the adverse scenario, which assess banks capitalization solvency in times of unfavourable macroeconomic situations, about 56% of banks are above the 8% thresholds. However, a significant number of the banks in the sample are close to the threshold value of 5.5% under baseline scenario.
With a minimum CET 1 ratio of 8% under the adverse scenario a total of 24 banks experienced capital shortfall in 2016 which on aggregate is EUR 24.2BN. Also, the total risk exposure increased with 11% in 2016 under the adverse scenario.
Another objective of the stress tests focuses on banks risk coverage, requiring banks to rise their risk coverage on the credit, market, sovereign, securitization risk and the cost of funding and interest income.
3.2.3
Aggregate stress test results for 2011
The stress test for 2011 is highly transparent, very comprehensive at bank level and easily accessible and downloadable for the EBA website (Acharya et al, 2014). The minimum CET 1 ratio is equal to 3.5% of RWA. The threshold CT1 ratio under the adverse scenario us 5% of the RWA, where on average banks have about 8.9% in the end of 2010. Despite the strengthening, there are three banks that fall below this threshold (EBA, 2011). Under the adverse scenario this ratio decreases to 7.7% on average.
The results from the 2011 stress test shows that 27 banks experience a capital shortfall which will be addressed by limiting the RWA without harming the lending to the economy and by increasing the high quality capital elements (EBA, 2012).
3.3 Data analysis
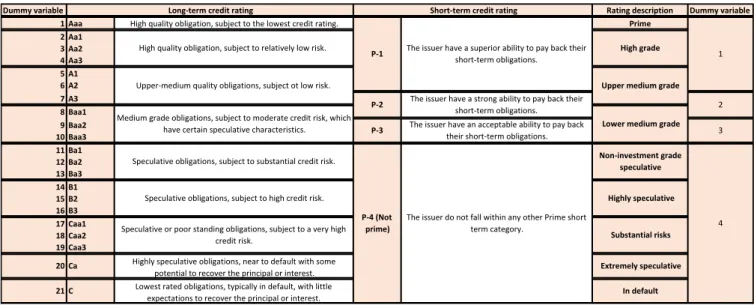
Moody’s credit rating scale for long-term debt ratings runs from the highest Aaa to the lowest C, comprising 21 notches in total, whereas the short term debt rating is classified in four primes (Moody’s, 2016). A summary of the ratings is presented in Table 2. The information is based on Moody’s official symbols and definitions. However, in order to be able to perform a multivariate regression analysis, for each categorical variable is assigned a corresponding number equal to 1 for Aaa down to 21 for C rating. The short term debt obligations are ranked in 4 categories, where 1 is Prime 1, or namely those issuers who have the ability to pay back their debt and 4 are the highly speculative debts or those with substantial risk.
Table 2 Moody's credit rating scale
3.3.1
Excess Equity to Balance Sheet Ratio
The equity capital requirements are the amount of capital that the banks must hold as it is required by the financial regulators. However, it is commonly seen that banks keep excess equity, which is measured as the difference between the actual equity amount reported in the balance sheet and required equity banks must hold in terms of RWA.
𝐸𝑥𝑐𝑒𝑠𝑠 𝐸𝑞𝑢𝑖𝑡𝑦 = 𝐸𝑞𝑢𝑖𝑡𝑦 − 𝑅𝑊𝐴 ∗ 𝐶𝐸𝑇1 𝑚𝑖𝑛𝑖𝑚𝑢𝑚 𝑟𝑞𝑢𝑖𝑟𝑒𝑚𝑒𝑛𝑡
The Excess Equity to Balance Sheet ratio would then be expressed by using the following formula:
𝐸𝑥𝑐𝑒𝑠𝑠 𝐸𝑞𝑢𝑖𝑡𝑦 𝑡𝑜 𝐵𝑎𝑙𝑎𝑛𝑐𝑒 𝑆ℎ𝑒𝑒𝑡 =
𝐸𝑥𝑐𝑒𝑠𝑠 𝐸𝑞𝑢𝑖𝑡𝑦
𝐵𝑎𝑙𝑎𝑛𝑐𝑒 𝑠ℎ𝑒𝑒𝑡 𝑎𝑚𝑜𝑢𝑛𝑡
Dummy variable Dummy variable 1 Aaa 2 Aa1 3 Aa2 4 Aa3 5 A1 6 A2 7 A3 8 Baa1 9 Baa2 10 Baa3 11 Ba1 12 Ba2 13 Ba3 14 B1 15 B2 16 B3 17 Caa1 18 Caa2 19 Caa3 The issuer do not fall within any other Prime short term category. Short-term credit rating Highly speculative Non-investment grade speculative Lower medium grade Upper medium grade High grade 20 21 P-1 P-2 P-3 P-4 (Not prime) Ca C High quality obligation, subject to the lowest credit rating. High quality obligation, subject to relatively low risk. Upper-medium quality obligations, subject ot low risk. Medium grade obligations, subject to moderate credit risk, which have certain speculative characteristics. Speculative obligations, subject to substantial credit risk. Speculative obligations, subject to high credit risk. Speculative or poor standing obligations, subject to a very high credit risk. Highly speculative obligations, near to default with some potential to recover the principal or interest. Long-term credit rating 1 2 3 4 Lowest rated obligations, typically in default, with little expectations to recover the principal or interest. Rating description Prime In default Extremely speculative Substantial risks The issuer have a superior ability to pay back their short-term obligations. The issuer have a strong ability to pay back their short-term obligations. The issuer have an acceptable ability to pay back their short-term obligations.However, the credit ratings are influenced by more factors than just the excess equity, therefore I include several control variables.
3.3.2
Defaulted to Total Exposure Ratio
The credit risk mitigation (CRM) methodology is a technique used to determine the risk associated with exposure that the credit institutions hold (Dohnal, 2008). The two approaches of CRM are standardized (SA) and fundamental (F-IRB) or advanced (A-IRB) Internal Ratings-Based approach. According to the EU directive, only those institutions which are using either of those approaches are allowed to conceive CRM for the determination of the risk-weighted assets (Dohnal, 2008). The capital requirements are calculated differently depending on whether the IRB or the standardized approach are used. Dierick, Pires, Scheicher, & Spitzer (2005) consider the standardized approach as the closest to the current capital rules. On other hand, the IRB approach uses a combination of additional internal components for the calculation of the risk weights such as the probability of default (PD), loss given default (LGD) and exposure at default (EAD) (Dohnal, 2008).
The EBA stress tests states not only the total bank exposure used for determining the risk weights of the credit risk but also distinguishes the defaulted and non-defaulted assets. When a default of an obligor is sighted, then exposures of the defaulted obligor are taken into account and listed as EAD. The defaulted exposures are expressed as percentage of the total exposure. According to the EBA the total exposures are the total EAD based on which banks compute their RWA. The bank’s total exposure is classified into set of asset classes such as sovereign, bank, corporate, retail residential property, commercial real estate and other assets exposures and to each of them is allocated a risk weight, relative to the reflecting degree of credit risk (Dierick, et al., 2005). Higher ratio means that the banks has increased number of defaulted exposures, hence it maintains a low quality credit protection on a pool of exposures.
𝐷𝑒𝑓𝑎𝑢𝑙𝑡𝑒𝑑 𝑡𝑜 𝑇𝑜𝑡𝑎𝑙 𝐸𝑥𝑝𝑜𝑠𝑢𝑟𝑒𝑠 = 𝐷𝑒𝑓𝑎𝑢𝑙𝑡𝑒𝑑 𝐸𝑥𝑝𝑜𝑠𝑢𝑟𝑒𝑠 𝑇𝑜𝑡𝑎𝑙 𝐸𝑥𝑝𝑜𝑠𝑢𝑟𝑒𝑠
3.3.3
Leverage ratio
The equity to balance sheet, called also leverage ratio, is an investment ratio indicating the amount of bank’s assets invested solely by shareholders relative to its total equity. The leverage ratios compare the debt or equity of a company to its total assets, measuring the proportion of assets owned by creditors compared to those owned by shareholders.
𝐿𝑒𝑣𝑒𝑟𝑎𝑔𝑒 𝑟𝑎𝑡𝑖𝑜 =
𝑇𝑜𝑡𝑎𝑙 𝐸𝑞𝑢𝑖𝑡𝑦
𝑇𝑜𝑡𝑎𝑙 𝐴𝑠𝑠𝑒𝑡𝑠
The leverage ratio is a good indicator of what is the banks solvency after all liabilities are paid off, showing the remaining balance left to the investors.
3.3.4
Balance Sheet Amount
The stress test is examination of the banks’ balance sheets, hence, the total asset amount is used as a control variable for further calculation. Both the stress tests for 2011 and 2014 are conducted based on the static balance sheet assumption. The EBA decision is examining a time horizon of two years, as a longer period might question the reliability of the assumptions (EBF, 2013). According to Biondi and Zambon (2013) the static approach reflects the ability of the banks to meet its timely obligation by assessing its net asset positions. Moreover, this approach is used to compare the forecasted with those from the base period.
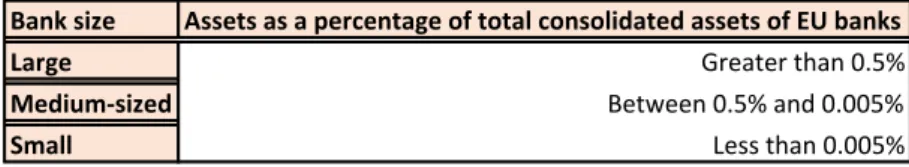
The bank size is usually measured in terms of the total assets, therefore the banks in this study are grouped in three size categories. According to the ECB banks are classified in three groups
according to their total assets as a percentage of the total consolidated assets of all EU banks. Small banks have 0.005% of the total banks of the EU banks, medium banks – between 0.005% and 0.5% and big banks have above 0.5%. I have created dummy variables for each group, however, in my sample size there are no small banks in 2014 and only 1 small bank in 2011. Small banks might have been cut off since I reduced the initial sample size due to information unavailability on credit rating assessments. In 2011, the small, medium and big banks rated with long-term rating are 0, 37 and 19, respectively and those which received short-term ratings are 1, 3 and 13, respectively. In 2014, the small, medium and big banks rated with long-term credit ratings are 0, 4 and 67, respectively, whereas those which received short-term ratings are only big banks and their number is 24.
Table 3 Bank size groups according to the ECB
3.3.5
Equity Ratio
The equity ratio is measured as the ratio between the Common equity and the RWA.
𝐸𝑞𝑢𝑖𝑡𝑦 𝑟𝑎𝑡𝑖𝑜 =
𝐶𝑜𝑚𝑚𝑜𝑛 𝐸𝑞𝑢𝑖𝑡𝑦
𝑅𝑊𝐴
This ratio is taken into consideration by the credit rating agencies when determining the credit ratings, therefore it is a valuable control variable for this study. The ratio defines how much capital the bank needs to hold in order to cover the risk of unexpected loss.
3.3.6
Ordinal regression
In order to determine what is the relationship between the dependent variable credit ratings and the independent variable excess equity to balance sheet, given several control variables, I have applied ordinal regression analysis.
The ordinal regression analysis is performed when the dependent variable is ordinal given one or more independent variables. Having ordinal variables means grouping the data into two or more categories which can be ordered or ranked. The dependent variable is the credit ratings ranked from 1 to 21 for the long-term ratings and 1 to 4 for short-term ratings. The independent variable is the excess equity to balance sheet, given in ratio terms. The control variables in the regression model are equity ratio, defaulted to total exposures, and the balance sheet amount grouped according to the banks size.
For the ordinal regression to be executed four assumptions should be met. Firstly, the dependent variable must be ordinal in nature and ranked in categories. Secondly, one or more of the independent variables should be either continuous or categorical, but they cannot be treated as ordinal. Third, there should be no multicollinearity between the dependent and the independent variables. Forth, there should be proportional odds, meaning each independent variable has equal effect on the each cumulative split of the ordinal dependent variables.
Since the information for the credit ratings is provides both in terms of long and short-term ratings and the stress test covers different sample of banks for 2011 and 2014, the ordinal regression is carried out four times. The general multivariate ordinal regression is specified as follows: CRt = α + β0ExEq + φKit + εit Bank size Assets as a percentage of total consolidated assets of EU banks Large Greater than 0.5% Medium-sized Between 0.5% and 0.005% Small Less than 0.005%
Where,
CR = Credit rating
ExEq = Excess equity to Balance sheet
Kit = Set of control variables, including the Equity ratio, the Defaulted to total exposures and
dummy variables indicating banks size based on balance sheet amount. The four different multivariate ordinal regressions are as follows:
LTCR2011 = α + β0ExEq + φK3,2011 + εi2011
STCR2011 = α + β0ExEq + φK3,2011 + εi2011
LTCR2014 = α + β0ExEq + φK3,2014 + εi2014
STCR2014 = α + β0ExEq + φK3,2014 + εi2014
Where, STCR and LTCR refers to as short and long-term credit ratings.
3.4 Research Quality
3.4.1
Research validity and replicability
By definition the research reliability refers to the possibility that the research can be performed again and essentially lead to the same results (Johnson & Christensen, Larry, 2012). The research validity indicates whether the conclusions of the performed study are correct and true (Johnson & Christensen, Larry, 2012).
I regard the data used for the current research as reliable since information on the credit rating assessment is gathered from Moody’s official database, and information on the capital adequacy of the European banks is obtained from the EBA official website. Furthermore, I believe this study is designed very objectively, based on a very comprehensive list of references, with high rate of citation and referral according to Google Scholar statistics. The data is tested in SPSS, so the risk of mistakes is limited. Moreover, due to the comprehensive statistics performed, I can assure the results are highly credible and reliable.
The information necessary for the paper is downloaded from publicly accessible free sources, hence, I consider this study to have high possibility for replication, hence, further research on the topic can be carried out.
4
Empirical findings
This chapter begins with an overall descriptive statistics of the excess equity to balance sheet ratio, followed by a comprehensive description of the multivariate ordinal regression results for short- and long- term credit ratings for 2011 and 2014.
4.1 Excess equity to balance sheet
Based on the formula provided in section 3.4.1, the excess equity to balance sheet is calculated by first estimating the minimum equity amount banks must hold according to the minimum CET1 given their RWA, and then subtracting this amount from their current equity. Then the ratio is the received amount divided by the balance sheet amount.
Given the 3.5% minimum CET1 ratio for 2011 there are three banks, namely Öesterreichische Volksbank AG (ÖVAG) in Austria, Agricultural Bank of Greece S.A (ATEbank) and Allied Irish Banks PLC in Ireland, which keep less equity than the minimum requirements and hence report a negative excess equity to balance sheet ratio.
For those particular banks I took a closer look at the outcome of the stress test for 2011 in order to see whether they pass the baseline and adverse scenarios.
ÖVAG reports a CT1 ratio of 6.4% in 2010 and 4.5% under the adverse scenario in 2012, which does not reach the 5% CT1 benchmark. Hence, the banks need additional EUR 160 million. Expectable the Agricultural Bank of Greece S.A (ATEbank) also requires additional capital. The bank reports CT1 capital of 6.3% as of December 2010. However, it fails to meet the CT1 benchmarks under the adverse scenario for both 2011 and 2012, reporting results of 4.5% and -6.0% respectively. This indicated that additional capital of EUR 713 million is needed in order to be able to reach the requirement of 5% CT1 ratio.
The Allied Irish Banks PLC also fails to meet the 5% CT1 threshold. The December 31st 2010
results report only 3.7% CT1 ratio. Under the adverse scenario, the CT1 capital ratio is 1.2% and -1.5% for 2011 and 2012 respectively indicating that the bank needs additional capital. However, the Irish bank increased its total substantial regulatory capital after receiving about EUR 13412 millions of government support, raising capital and implementing restructuring plans. Those remedial measures increased the total CT1 ratio up to 14.6% in 2011 and 10.0% in 2012 under the adverse scenario. However, in 2010 for the actual results indicate the need of additional capital of EUR 1269 million.
Under the 4.5% minimum CET1 ratio for 2014, the number of banks that have less equity than the minimum equity requirements decreased to 2, namely Öesterreichische Volksbank AG (ÖVAG) in Austria and the Italian banks Banca Carige S.P.A – Cassa di Risparmio di Genova e Imperia.
The stress test for 2014 reveals that the Austrian bank has a CET1 ratio of 10.3% for 2011. The CET1 ratio of 2.1% under the adverse scenario, however, does not meet the threshold of 8%. Also, the stress test shows a capital shortfall of EUR 865 million, therefore the EBA proposes some restructuring measures to be undertaken. However, press reviews from both the banks side and the Austrian Financial Market Authority (FMA) confirm that currently ÖVAG meets all regulatory requirements and has been working and implementing successfully restructuring plans.
Banca Carige S.P.A also report a CET 1 capital ratio of -2.4% under adverse scenario and 2.3% under the baseline scenario. The bank needs about EUR 814 million in order to fulfil the gap and meet the minimum capital requirements.
4.2 Assumption checking - Multivariate ordinal regression
Before performing the multivariate ordinal regression, I need to check whether the four assumptions are met.
The first assumption states that the dependent variable must be ordinal in nature and ranked in categories. The credit ratings are ordinal in nature ranked in categories in ascending way from 1 to 21, where 1 represents the highest Aaa rating and 21 is the lowest C.
The second assumption that one or more of the interdepend variables have to be continuous or categorical is also observed.
The third and fourth assumptions tests for multicollinearity and for proportional odds.
4.2.1
Multicollinearity diagnostic checking – Assumption 3
The existence of interdependency relationship between the explanatory variables in regression analysis is referred to as multicollinearity problem (Farrar & Glauber, 1967). The presence of multicollinearity will hamper the correct estimation of the structural relationship between the variables in the regression.
Table 4 and 5 summarize the output after running a collinearity diagnostics test in a linear regression for long- and short-term credit ratings in 2011 and 2014, respectively. The dependent variables of each regression are the credit ratings, whereas the independent variables, also called predictors, are the control variables excess equity to balance sheet ratio (ExEqBS ratio), the defaulted to total exposures ratio (DTE), the leverage ratio (LR), the equity ratio (Capital) and the banks size (Size).
The Variance Inflation Function (VIF) and the tolerance measure the degree of multicollinearity between the variables. A VIF of 10 or higher indicates that there is definitely a presence of multicollinearity. A VIF of 4 or above requires further investigation. A VIF of around 1 implies no multicollinearity problem in the model.
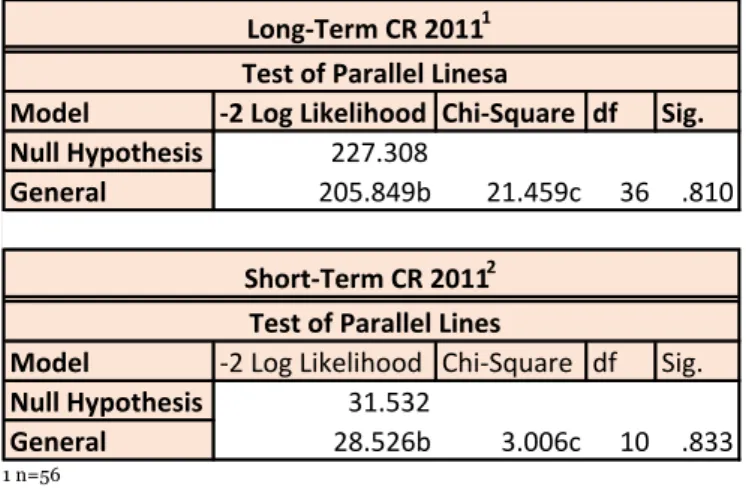
Table 4 reports the regression analysis between long- and short-term credit ratings and the other control variables for 2011.
In long run, the VIF for the predictors excess equity to balance sheet ratio, the leverage ratio and capital are inflated by a factor of 172.755, 110.690 and 15.686 indicating that those variables are correlated with at least one of the other predictors in the model.
In short run, the VIF for the predictors excess equity to balance sheet ratio, the leverage ratio and the capital are inflated by a factor of 580.840, 429.831 and 32.098 indicating that those variables are correlated with at least one of the other predictors in the model.
1 n=56 2 n=17
Table 4 Multicollinearity tests for Long- and Short-Term credit ratings for 2011
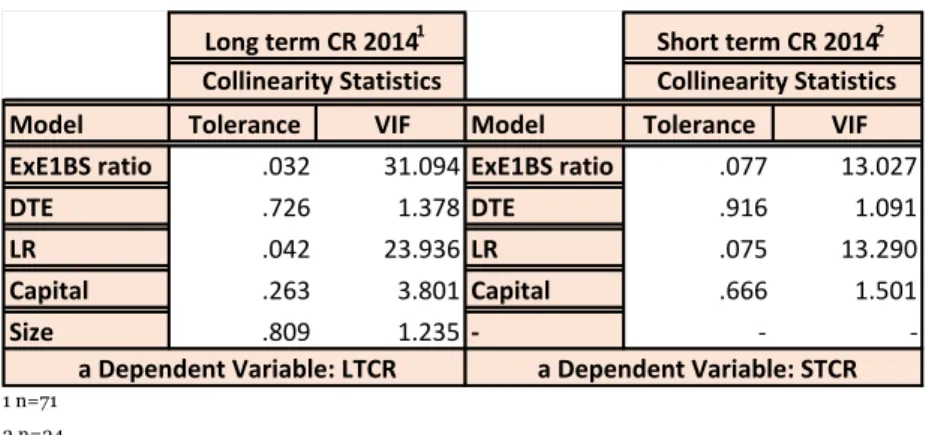
Table 5 reports the regression analysis between the long- and short-term credit ratings and the other control variables for 2014.
In long run, the VIF for the predictors excess equity to balance sheet ratio and the leverage ratio are inflated by a factor 31.094 and 23.936 indicating that those variables are correlated with at least one of the other predictors in the model.
In short run, the VIF for the predictors excess equity to balance sheet ratio and the leverage ratio are inflated by a factor of 13.027 and 13.290, indicating that those variables are correlated with at least one of the other predictors in the model.
Model Tolerance VIF Model Tolerance VIF ExE1BS ratio .006 172.755 ExE1BS ratio .002 580.840 DTE .529 1.889 DTE .690 1.448 LR .009 110.690 LR .002 429.831 Capital .064 15.686 Capital .031 32.098 Size .572 1.747 Size .755 1.325 Short term CR 20112 Collinearity Statistics Collinearity Statistics a Dependent Variable: LTCR a Dependent Variable: STCR Long term CR 20111