V¨
aster˚
as, Sweden
Thesis for the Degree of Master of Science in Engineering - Robotics
30.0 credits
DESIGN OF A DYNAMIC BOOM
SUSPENSION SYSTEM IN A HYBRID
WHEEL LOADER
Ayoub Ayoub
Carl Martin Berg
aab13001@student.mdh.se
cbg13002@student.mdh.se
Examiner: Ning Xiong
M¨
alardalen University, V¨
aster˚
as, Sweden
Supervisor: Alessandro Papadopoulos
M¨
alardalen University, V¨
aster˚
as, Sweden
Company supervisor: Patrik Stener,
Abstract
Wheel loaders are under the influence of low frequency vibrations that may be harmful for the health of the operator, and for the productivity of the machine. The strong vibrations can sig-nificantly impact the operation of the machine since they are not equipped with wheel suspension systems and due to their work environment in rough terrains with uneven surfaces. The risk of spilling or dropping the load is also increased and they can introduce higher mechanical stress that can wear out parts faster. The focus of this thesis work is to develop an approach for damp-ing these vibrations dynamically by improvdamp-ing the functionality of the electrohydraulic system in Volvo’s prototype wheel loader LX1. The dynamic damping system controls the cylinder of the lift framework to make it behave as a damper. The system utilizes the lift cylinder pressure and piston position as feedback to adjust the oil flow in the cylinder using the proposed control system. Results indicate that the proposed technique is capable of attenuation that is comparable with the existing boom suspension system based on accumulators through simulations and experimental tests. Keywords - Wheel loaders, passive damming, active damping, dynamic damping, PID con-trollers, vibrations, hydraulics.
Table of Contents
1 Introduction 4 1.1 Thesis Goal . . . 4 1.2 Thesis Outline . . . 5 2 Background 6 2.1 Introduction to Hydraulics . . . 62.2 Conventional Wheel Loaders . . . 7
2.3 Prototype Wheel Loader - LX1 . . . 7
3 Problem Formulation 10 3.1 Research Questions . . . 10
3.2 Scope and Limitations . . . 10
4 Method 11 5 Related Work 12 5.1 Passive Systems . . . 12
5.2 Wheel Suspension Damping . . . 13
5.3 Active Valve Controlled Systems . . . 13
5.4 Active Displacement Controlled Systems . . . 13
5.5 Vibrations Damping . . . 14
6 Simulation Environment 16 6.1 Lift Cylinder Model Design . . . 16
6.2 Volvo Simulation Model . . . 17
7 System Design for Dynamic Damping 19 7.1 PI+P . . . 19
7.2 Filters . . . 20
8 Results 23 8.1 Lift Cylinder Simulation Model . . . 23
8.1.1 Damping Without Load . . . 23
8.1.2 Damping With Load . . . 25
8.2 Volvo Simulation Model . . . 28
8.2.1 Damping Without Load . . . 28
8.2.2 Damping With Load . . . 29
8.3 Experimental Tests . . . 31
8.3.1 Damping Without Load . . . 32
8.3.2 Damping With Load . . . 33
8.3.3 Uneven Terrain with Load and High Speed . . . 35
9 Discussion 38
10 Conclusions and Future Work 39
11 Acknowledgment 40
Glossary
ANC Active Noise Cancellation. 14,15
AVC Active Vibration Cancelling. 15
BSS Boom Suspension System. 4,7,9,16,23,31–39
DBSS Dynamic Boom Suspension System. 4, 5,9,20–39
FFT Fast Fourier Transform. 21,23,24,26
LCM Lift Cylinder Model. 16–20,28,38,39
LQR Linear-Quadratic Regulator. 13, 14
PI+P Proportional, Integral + Proportional. 19,20, 39
PID Proportional, Integral and Derivative. 10,11,19,38
STD Standard Deviation. 25,28
UIO Unknown Input Observer. 13
VCE Volvo Construction Equipment. 4, 8,16,21,39
1
Introduction
Wheel loaders are complex machines that are mostly used in the construction field such as earth-moving works and urban engineering projects. They can be used to perform many tasks and excels in their versatility. Their most common tasks are loading, unloading, transporting, moving differ-ent materials such as dirt, raw minerals, gravel, snow, recycled material, etc. They can also be equipped with different tools depending on their task. Most wheel loaders have hydraulic systems to control the lift framework. The hydraulic energy is controlled by motors, pumps and valves that can control the boom by lifting, tilting, grabbing, etc., depending on the tool.
Figure 1: Volvo prototype, hybrid wheel loader LX1.
This thesis work has been done in cooperation with Volvo Construction Equipment (VCE) and the work was performed on the Volvo prototype hybrid wheel loader LX1, see figure1. More details about the wheel loader will be provided inProblem Formulation.
1.1
Thesis Goal
The Wheel loaders are subjected to vibrations due to their work environment that mostly is in rough terrains with uneven surfaces and since they are not equipped with wheel suspension they must have solid ground during loading or unloading. This master thesis work proposes a develop-ment of a Dynamic Boom Suspension System (DBSS). The goal of the thesis is to attenuate the vibrations by introducing movement between the boom and the machine body. This can be done by utilizing the hydraulic system, by measuring the lift cylinder pressure and piston position, to adjust the oil flow in the lift cylinder using feedback control.
The vibrations can cause different problems such as the non-ergonomic workplace for the operator, decreasing productivity by spilling the load and extra mechanical stress that could cause damages to wheel loader’s parts. Therefore, it is necessary to improve the stability of the machine.
A Boom Suspension System (BSS) such as the passive damping system is a conventional so-lution to increase stability in wheel loaders by adding hydro-mechanical components such as ac-cumulators, which are integrated in the lifting framework hydraulics, to absorb the shocks. The drawbacks of this solution are the kinetic energy dissipation and the lack of damping of a wider range of vibration frequencies [1], specially while driving the machine at different velocities with different loads.
pressure data to control the electrohydraulic system of the Volvo LX1.
1.2
Thesis Outline
The content of this paper is divided into sequenced sections. It starts withBackgroundto introduce hydraulic systems and wheel loader functionalities, specifically about the Volvo LX1. Then the thesis main problems are explained in more detail inProblem Formulation. The scientific method behind this work is explained in the section Method, then Related Work explains the existing damping techniques within the field.
Simulation environments were used to develop the DBSSand they are introduced in Simulation Environment. The approach and design of dynamic damping is discussed in System Design for Dynamic Damping before presenting theResults.
2
Background
This section describes the basics of hydraulics and how it works in wheel loaders. It also explains how damping systems are applicable today, with a brief introduction about hydro-pneumatic accu-mulators, then the hybrid prototype wheel loader Volvo LX1 is introduced and how it is different from conventional wheel loaders.
2.1
Introduction to Hydraulics
A brief introduction to hydraulics and hydraulic systems will be presented before going into de-tails about hydraulic functionalities in a wheel loader. Hydraulics can be divided into two groups; hydrodynamics and hydrostatics [2, Ch. 1]. The first group involves the science of moving fluids acting on solid bodies such as the oil in a torque converter. The second group is for fluids under pressure such as a pressurized hydraulic cylinder where the fluid must be trapped inside a closed system that might have different physical forms depending on the application. The displacement of the piston occurs when applying a pressing force (pressure) on the fluid. The hydraulic pressure is created when there is a resistance to the fluid flow, and therefore hydraulics is a combination of pressure and flow over time.
The hydraulic circuits can be constructed in two different ways; in series and in parallel [2, Ch. 2]. They work similarly to electrical circuits, specially the resistance characteristics. When the circuit of fluid is in series, then it must flow through all the components in sequence and the total resistance is the sum of each components resistance, while in parallel circuit the fluid flows proportion to each components resistance. The higher the resistance of the component, the lower is the priority for the fluid to flow through. When there is no fluid flow in a hydraulic system, there will be no difference in pressure, given that external forces acting on the hydraulic system are constants.
Most hydraulic systems are driven by oil because it lubricates the system, prevents rusting and is hard to compress, freeze or boil and relatively easy to contain in the system without leakages.
There is a need of a mechanical source to generate hydraulic energy and later take advantage of the hydraulic energy to actuate mechanical tools. The first component is the pump, which is driven by mechanical energy (motor). This generates a transformation of energy from mechanical to potential (pressure/hydraulic) energy caused by the fluid power. At the end, the potential energy reaches the hydraulic actuator, to work as mechanical parts.
The most important factors [2, Ch. 2] for using fluids to generate mechanical power are: • Liquids are shapeless and therefore they fit in any physical container.
• Liquids have very low compressibility, thus they keep most of their volume.
• Liquids distribute pressure in all directions, and therefore the pressure is equal at any point in a hydraulic cylinder.
• The forces produced by the fluid power can be controlled easily by changing the fluid direction. • The hydraulic power in a wheel loader helps to keep the mechanical parts relatively still
because of the compressibility of fluid.
• The speed of the boom and the tilting bucket are controlled separately from each other and the rest of the system.
Hydraulics is very common in construction machines because of its compatibility and all the advantages mentioned above. Therefore, most wheel loaders are equipped with hydraulic system to control the lifting framework.
2.2
Conventional Wheel Loaders
There are many similarities between different hydraulic systems in wheel loaders. They all have a motor as mechanical energy source that is driven by electricity or fuel. There is also a hydraulic pump driven by the motor to generate hydraulic energy. The pump controls the flow rate and direction of fluid. Valves are also fundamental parts in a hydraulic system, usually exist to control the path of fluid, from different sources to different destinations, such as pumps, reservoirs or hydraulic cylinders. They can also open or lock fluid paths, which helps the hydraulic motors to rest, for example by locking the hydraulic circuit, the oil will be held and therefore, the cylinder will not move, this can give the motor some rest moments.
The hydraulic energy drives the hydraulic actuators, such as cylinders to apply movements that produces mechanical energy in linear or rotary directions [3].
Figure 2: A hydro-pneumatic accumulator.
Some more advanced conventional hydraulic systems in wheel loaders have (BSS) with accu-mulators [4, Ch. 2, Ch. 9]. There are many types of accumulators and the most common type is called hydro-pneumatic accumulators, see figure2. It has two chambers, one for gas and one for fluid. The size of each chamber varies depending on the hydraulic pressure. They also can store different pre-charged pressures, and at the same time work as a fluid reservoir. The component is connected to the lift cylinder, and when a force is applied to the cylinder, the piston is moved and oil gets pressed from the piston chamber of the cylinder into the accumulator fluid chamber. Then the gas in the accumulator gets compressed by the added fluid and this behaviour acts as a damping technique.
2.3
Prototype Wheel Loader - LX1
The machine is part of the Volvo Concept Lab and is able to deliver up to 50% improvement in fuel efficiency with significant reduction in emissions and noise pollution compared with the con-ventional wheel loaders [5]. It has electrically driven motors mounted at the wheels and has also an electrically driven hydraulics system.
Figure 3: A Double-acting hydraulic cylinder with a rod on one side. The figure shows cylinder extension.
Figure 4: Double-acting hydraulic cylinder with a rod one side. This figures shows cylinder retrac-tion.
The LX1 has a linear actuator for boom lifting, which is a double-acting hydraulic cylinder with a rod on one side. The cylinder converts hydraulic energy to mechanical energy. When the hydraulic pressure is acting on the piston side, and it is greater than the external pressure (caused by a load), the cylinder will be forced to extend, see figure3. This will result in oil reduction for the rod side by letting the oil flow to the reservoir and vice versa when the cylinder retract, see figure4. The volume difference between piston chamber and rod chamber can be ignored, because it is compensated by a system built byVCE.
Figure 5: Fixed-displacement pump
The source that converts mechanical energy to hydraulic energy is the pump. LX1 has a fixed-displacement pump driven by an electric motor. The pump is an axial piston pump with a number
against the swash-plate surface. In the center of the barrel, there is shaft connected outwards to the electric motor, which rotates the barrel, see figure 5. The swash-plate angle is fixed and therefore, it has the name fixed-displacement pump [4, Ch. 4].
When the pump rotates it creates a vacuum at the inlet, this creates pressure that forces the oil into the pump. The oil will be pushed even further to the cylinder through the pump outlet. A fixed-displacement pump has a fixed flow rate, this means that every revolution of the pump output has the same amount of fluid.
The prototype wheel loader LX1 have accumulators which are the main parts of theBSSand they get activated when the system is turned on. The system makes sure that the accumulators have the right amount of pressure before they get connected to the lift cylinder to avoid undesirable pressure gaps that can be caused unwanted vibrations, which might cause a sudden boom fall or boom rise.
There is a noticeable difference in absorbing shocks while theBSSis activated. The wheel loader is more stable, especially while carrying heavy loads because the accumulators provide a shock absorbing mechanism by balancing the pressure. This technique is based on passive damping since it depends on the mechanical functionality of the accumulators.
The wheel loader is equipped with advanced sensors and real-time communication systems to help measure and display the hydrodynamics and physical components status such as pressure and piston position. These are the main requirement of building theDBSSand therefore, there is no need of adding any extra physical component to the wheel loader, such as new sensors or communication tools.
3
Problem Formulation
Since the wheel loaders are not equipped with wheel suspension system they face a lack of stability while driving on uneven and rough surfaces. These surfaces introduce vibrations that can increase the risk of dropping or spilling the load and they can significantly impact on the comfort of the operator. The vibrations can also generate mechanical stress that can shorten the life of some parts due to faster wear. The load affect the entity of the vibrations: the heavier the load, the higher the vibrations. Therefore there is a need to update the system for better shock absorption to achieve a smoother ride, more comfort for the operator, minimize the risk of dropping or spilling the load. A smoother ride with less mechanical stress gives longer life for the wheel loader.
3.1
Research Questions
The set of research questions was formulated in the beginning of the thesis work and is structured to answer the thesis main problems and to clarify the scope of this master thesis.
1. How can we extend and improve the existing system code to design a dynamic damping system?
2. What technique for dynamic damping can be implemented in the available embedded system on board of the wheel loader?
3. How can the technique for dynamic damping be tested to determine if damping is achieved?
3.2
Scope and Limitations
A limitation that was experienced during the work was that the amount of memory in the machine was limited. A moving average filter was constructed in Simulink using a memory block that saves a number of samples to be shifted each iteration. This was noticed when the code was to be built so a different filter had to be created without the memory block. Another thing that was experienced was the old versions of Matlab and Simulink, they do not have the same amount of functionality as later versions that offer things like adaptive Proportional Integral Derivative (PIDs), moving average filter or adaptive model control.
The design of the system is aimed at damping while the wheel loader is driving with or without load. The system is deactivated while lifting or lowering the boom but further implementation has to be made to switch of the system also when filling up the bucket e.g. from a pile of gravel, the current implementation does not take that into account since the control system is activated when the joystick is being released and this is not wanted during loading.
The design and implementation is limited to damping of machines using a hydraulic boom cylinder with lift cylinder pressure and position feedback, which was the primarily scope of this thesis.
4
Method
The work began with studies of both the current system that is implemented and a literature study of previous work within the area. Then the method of quantitative research was used to answer the research questions. Quantitative research typically uses numbers as a basis to make generalizations [6]. This thesis presents data expressed as tables, graphs and figures which provide the investigation and results with characteristics of the quantitative method. A version of thePID
control system has been implemented since it is based on feedback. The feedback is in form of data from sensors where the system is based on pressure values from the piston chamber of the lift cylinder and position values of the piston from the same cylinder. The implemented algorithm is based on research performed by the authors throughout the thesis work and the approach can be divided into following:
1. Detailed study of the current hydro-mechanical system
2. Literature study of previous work with active damping systems 3. Produce a model in Matlab Simulink
• Find the values for each Simulink component that correspond to the machine specifica-tions
• Collect data from the real machine and use as an input to drive the simulation
• Change parameters and compare to the real data, start over until the data is close enough to verify the model
• Add control system, tune it and compare damping results to the real data • Integrate the control system to Volvo’s simulation environment
4. Evaluate the system in Volvo’s simulation environment • Find a suitable location to place the control system • Identify inputs and outputs between different subsystems • Connect inputs and output to and from the control system • Use the collected data as input to drive the simulation
• Adjust the simulation environment to fit with the control system and collected data • Verify simulation model by comparing simulation output with collected data • Simulate and start over to change parameters if predicted output did not succeed • Simulate with control system and verify damping, implement on real wheel loader 5. Implement the model on the wheel loader when good simulation results are obtained
• Set variables in the Simulink blocks to be able to change them while running the code on the machine
• Generate code, get it built and loaded to the wheel loader
• Test the implementation with different test cases with the machine
Figure 6: The figure describes the stepping that can be made during the process steps of creating a model, evaluating it and implementing it to the physical wheel loader.
Points 3, 4 and 5 will be iterated through by starting at the Produce Model state and then for each step that is not satisfied, go back to the previous state according to figure6 until a satisfied result is achieved.
5
Related Work
Vibration damping is commonly achieved by two techniques, either by passive damping or by active damping. Different passive vibration damping systems that are used, utilizes hydro-pneumatic accumulators where the accumulators are connected to the boom lift cylinders, one or more in parallel, to damp at different pressure frequencies. The use of accumulators does not require any additional energy to the system but energy dissipation exists. Additional components are also needed to connect and disconnect the accumulators while the cylinders are working to equalize the pressure between hydraulic actuators and accumulators before system activation [7]. Otherwise, the boom might fall to the ground. The biggest drawback with the passive system is that it only works for certain vibration frequencies and is ineffective over the vehicle speed spectrum [8], while active damping systems are good at damping different frequencies. The active damping are mostly achieved by controlling the already existing hydraulic system. Different methods have been proposed such as valve controlled systems [9][10], displacement controlled system and active damping for off-road vehicles [11][12] and then a comparison between energetic behaviour between a valve controlled and a valveless controlled system [13].
5.1
Passive Systems
An example of a passive system that utilizes hydro-pneumatic suspension contains three parts, a hydraulic cylinder, a hydro-pneumatic accumulator and the hydraulic fluid [14]. When the cylinder is connected with the accumulator and the amount of hydraulic oil has been adjusted by adding or releasing oil to the system to set the hydraulic pressure at the required level, the system provides suspension functionality. As the piston is being displaced, the fluid volume in the accumulator is changed by the hydraulic fluid that is being pressed into the accumulator and thereby the pressure in it is increased, see figure7.
Figure 7: The figure describes the basic example of a suspension system where P1 is the pressure created by the force F, P2 is the pressure created by the increased force F* at a later time step and ∆s is the distance that the piston has travelled between the two time steps .
As the external force F increases to F*, the position of the piston is changed because of the added amount of oil that enters the accumulator. The spring rate of the suspension system is defined by the difference between the two forces, when they are in balance with the forces that result from pressures applied to the piston, divided by the distance that the piston travelled during the increase of the force until the system is balanced. Additional damping can be achieved by using a flow resistor that is placed between the cylinder and the accumulator. The resistor lets part of the hydraulic fluids kinetic energy convert into heat by viscous friction. Even though the major part of the spring rate is constituted by the compressible gas contained in the accumulator there are two more participants that affect the system spring rate, namely the widening of the fluid lines and fittings and compression of the hydraulic fluid. This is similar to vehicles with a suspension system that has strut assembly, where an accumulator works similarly to a strut coil and the resistor as strut damper.
5.2
Wheel Suspension Damping
This solution is designed to separate the wheel loader frame from the wheel axes by adding wheel suspension (strut assembly). But this solution increases the pitch angle motion while loading the bucket. Therefore, it is not a traditional way of constructing wheel loaders.
These machines already have a structure that can provide stability thanks to its short wheelbase and small distances between left and right tyres. This gives higher stability and less vibrations. These short distances in the wheel loader’s chassis are for stabilization and the big tyres for shock absorbing. Therefore, there is no need to add spring suspension. [15].
To solve the problem of pitch angle motion with wheel suspension, an approach was introduced in 2003 by locking the wheel suspension system whenever the bucket was operating [16]. The drawbacks of this solution is its complex design and extra expenses, therefore it does not exist on the market yet.
5.3
Active Valve Controlled Systems
Another available solution to achieve active damping is to control the linear actuators, such as hydraulic cylinder with the help of an electrohydraulic valve. This solution relies on multiple factors depending on the approach, for instance, cylinder position, force, pressure or wheel loader accelerations. Most approaches utilize the cylinder position and cylinder pressure data, because position and pressure sensors exist in most machines and they are not as expensive as having a force sensor [11]. This technique considers the machine structure and the load as damper mass and the hydraulic cylinders as adjustable damping parts. Therefore it has to control the wheel loader to damp the unwanted vibrations.
A work has been done using pressure and position sensor to derive an electrohydraulic lifting control valve [17]. The system has an updatable pressure threshold levels as a reference to the current change in pressure. When the values deviate too much, the system adjusts itself to return at the threshold value. The drawbacks of this solution is the extra energy consumption, because the electrohydraulic valve is energy insufficient. It consumes energy in all motion, and hence, this approach is not desirable.
5.4
Active Displacement Controlled Systems
An active displacement controlled system utilizes the hydraulic pump to control the actuators (hydraulic cylinders). The pumps could be of two types, variable displacement pump or fixed displacement pump. Therefore, there is no need of any direction control valves as were described in subsection5.3. Because these types of pumps could be controlled to operate on different dis-placement capacity, usually measure as volume per revolution. The pump could be driven by a combustion engine or an electric motor, and their task is to actuate the hydraulic cylinders by adjusting the oil flow.
An investigation about oscillations of a wheel loader bucket and the vehicle itself is presented in [18]. The main goal of the project was to increase comfort for the operator and reduce oscillations of the bucket. Since this thesis will only cover comfort of the driver, the focus is aimed at that when examining this paper as well. First the kinematic expressions were derived and with these a dynamic model was created. Only the lift cylinders were being taken into account and only the relevant parts of the wheel loader dynamics were modelled. The measurement that was desired was the pressure of the piston chamber and the flow to the chamber was the one that was being con-trolled. Different techniques such as P-controller, Linear-Quadratic Regulator (LQR) + observer,
LQR+ Unknown Input Observer(UIO) and H∞have been tried out in a simulation test scenario
where the wheel loader was driving on uneven terrain. Throughout the testing a comparison has been made that shows that none of the controllers resulted in improvements except for theLQR+
UIOwhich improved the driver comfort but needed two additional measurements apart from the pressure in the hydraulic cylinder.
In [7], an active damping system with acceleration feedback is presented together with a sim-pler algorithm that only uses pressure and position as measurements. A four degree of freedom
vehicle dynamic model was constructed from a skid-steer loader without mechanical suspension. Dynamics for the hydraulic pump and actuator was also modelled as well as the tires.
The control law of the active damping based on acceleration is based on the skyhook damper principle where the control input force is proportional to the velocity of the body with respect to a stationary inertial reference. Cascaded feedback loops are utilized in the control structure for feedback of pump displacement and pressure to be able to create the force. The acceleration was measured with a tri-axial accelerometer at the side of the loader and pitch acceleration was estimated from measurement of vertical acceleration of another sensor at the chassis front. To check the accuracy, simulation results were compared to measured data from the developed model. The experimental tests were performed by measuring acceleration while driving over ob-stacles on a test course. Low (9 km/h) and high (18 km/h) drive speeds were used with low and high bucket weights of 340 kg and 770 kg respectively. Four different tests were carried out with these conditions, namely: baseline condition without extra damping, passive damping with accumulators, active damping with pressure regulation, called virtual accumulator, and active multi-DOF regulation damping, a skyhook damper. The measurements indicated on a total vibra-tion reducvibra-tion of 34% with the skyhook damper and a reducvibra-tion of 23% for the virtual accumulator which had about the same numbers as the passive system with accumulators.
A vibration damping using existing working actuators with forklift function for displacement controlled systems is presented in [8]. The paper is divided into two parts throughout the paper where one part is about active vibration damping and the second about the forklift function on a skid-steer loader. Since this thesis is about active damping the focus will be on this part of the paper. In order to achieve the goals the authors developed a hydraulic and a mechanical system model in Matlab-Simulink. The mechanical and hydraulic models were then integrated to form a nonlinear model of the loader on who the control strategies will be simulated. A linear model for control strategies was developed where parameters were obtained to be applied in the nonlinear model to simulate the system behaviour. The authors further describe validation of the simulation model where parameters were tuned until required accuracy was fulfilled. The vibration damping control algorithm aboutLQRin simulation is discussed in the next section, the algorithm is a way for finding an appropriate state-feedback controller where the controller finds settings that reduces undesired deviations with help of penalties and weighting factors. The simulation results are then brought up before the experimental measurements. The results of the experimental measurements showed that the controller performed very well with a 29% reduction in pitch vibrations at low speed and 19% reduction in bounce. At high speed it also performed with 25% in pitch and 25% in bounce.
5.5
Vibrations Damping
Active Noise Cancellation (ANC) is a technology developed for headphones, to help cancel out the unpleasant noise penetrating the ear cup from outside [19]. Most headphones are incapable of damping low frequency noises, which leads to inferior listening experience. Therefore, high quality headphones are equipped withANCto reduce undesirable noises.
Figure 8: The noise source is the ambience noise, while the anti-noise comes from the speakers of the headphones to diminish the ambience noise.
Noises are a physical waves with certain frequencies, therefore, this technology operates by introducing anti-noise waves with the inverted frequencies inside the speaker to cancel out the noises penetrating the ear cup from outside, this is demonstrated in figure 8. Microphones are implemented to know what frequencies the noises have.
These headphones work better at cancelling continues noises, because it is easier to produce similar anti-noises continuously rather than vary the anti-noise frequencies.
Active Vibration Cancelling (AVC) is a technique used to help increase passenger comfort, by reducing vibrations transmitted to the passenger seat [20]. The vibration reduction is achieved with the help of a Vibration Generator (VG), which is a permanent magnet linear actuator. The vibrations attenuation inAVC has similar work principle to noise cancellation in ANC systems. The VG generate anti-vibrations to cancel out the unwanted operators seat vibrations. These generated vibrations have equal force and magnitude as the unwanted vibrations with inverted frequencies sign. The placement of the VG depends on the vehicle structure and the vibration sources of the vehicle.
Bose Corporations is a company known for producing audio equipment. In 2004 Bose revealed a prototype of a vehicle seat suspension [21]. The seat has four linear electric motors, placed in each corner to adjust the seat quickly, and independently from the road condition. They have two three-axis accelerometers and one seat-position sensor. It is essential for the system to react super quickly, therefore the sensors processing 2000 times per second.
The algorithm needs to compensate the road disturbance immediately. According to Bose it can damp the vibrations up to 90% which includes low and high frequencies.
A new generation of Bose Ride was introduced in 2015, Bose Ride System II, which has new features and more functionalities. Bose developed better ergonomics and new functionalities to receive feedback for better interaction with the driver [22]. Therefore, three new settings are introduced; Soft, Middle and Firm. The Soft is the smoothest, the Middle is as good as the Bose Ride I and the Firm is similar to the air suspension seats. These seats became available as an option in Volvo trucks.
6
Simulation Environment
This section is divided into two subsections, the fist subsection6.1will present a simulation model that has been developed and verified during this thesis work. The model simulates the lift cylin-der for the Volvo LX1 wheel loacylin-der. The second subsection6.2 will present an already existing simulation model that has been built byVCE.
6.1
Lift Cylinder Model Design
A simplified Lift Cylinder Model (LCM) using Matlab-Simulink was built by the authors to simu-late the boom hydraulics and to gain a better understanding of hydrodynamic systems behaviour and work principle of the prototype wheel loader LX1. Each component in the model is chosen according to the LX1 specifications. The hydraulic cylinder of type double-acting was included to the model and it is actuated by a fixed displacement pump that is driven by an ideal angular velocity source. The velocity source represents the electric motor in the real machine with the same revolution per minute limits. The pump and cylinder also have the same specifications as the corresponding components in the LX1 considering pump displacement (m3/rev), pressure (Bar), angular velocity (rad/s), cylinder volume (m3), cylinder stroke (mm), piston area (m2), etc. A set of sensors were attached to the hydraulic cylinder to measure the response of the hydrody-namic system. Those were hydraulic pressure sensors for both chambers of the cylinder, hydraulic flow rate sensors to measure the flow of the oil that is being pumped to/from the cylinder and an ideal translation motion sensor to measure the piston position.
Figure 9: A visual description of the simplified model verification steps.
To verify the model a force source was added to simulate the load acting on the boom cylinder and real data from the LX1 was needed to confirm the verification of the simulation model. Log data was therefore collected from the wheel loader during different physical test scenarios, with load, without load and withBSSand withoutBSS, while driving over piles of gravel. The force data that was needed as an input to theLCMwas calculated from the pressure log data by Equation1:
F = P ∗ A (1)
where F is the calculated force, P is cylinder pressure and A is the piston area. The force was then used as input to theLCM with the initial piston position set according to the log data, see figure9. The log data that was used was without load and without BSS, which means that the piston was standing still (except for small changes because of fluid compression).
By testing and adjusting the model, such as adding cylinder friction, hydraulic fluid type, oil density, oil viscosity, amount of trapped air, system temperature and mechanical references, it could later be seen as a verification that the model was constructed in a proper way as the measurements became very similar to the measured log data, hence the force applied to the simplified model resulted in a very similar pressure measurement as in the real wheel loader.
To make the model as close as possible to reality, delay blocks have been added to simulate the delay of the signals as they are passing different systems in the wheel loader. Rate transition blocks were also added to mimic the behaviour of the data transitions between CAN nodes.
simple P-controller. The P-controller is used for the damping of frequencies while the PI-controller is used to keep the piston position according to a reference without getting the position to slip away while damping. The P-controller was based on measurements of pressure from the piston chamber as a feedback input to the controller and the output was connected to control the pump. To get a reference signal to the P-controller a moving average filter was then added which uses a sliding window that takes the average of the N last samples to produce a mean value that acts as damping reference. A low pass filter was used to filter out the high frequencies of the original signal. This signal was then compared to the moving average filtered signal to get the difference between them used as input to the P-controller. The controller was then tuned in Simulink to get a stable system. The system was compared by using the P-controller and without the P-controller and a slightly damped signal was obtained. Then another P-controller was implemented for measurements based on the piston position. The pressure based P-controller was disconnected to test the position based P-controller separatly. After extending the position based P-controller to a PI-controller the position was held around the reference constant. The output of the controllers were then added together for representing a combination of damping and position control. The results showed that the position was kept over time while the vibrations were damped avoiding the position to slide away.
6.2
Volvo Simulation Model
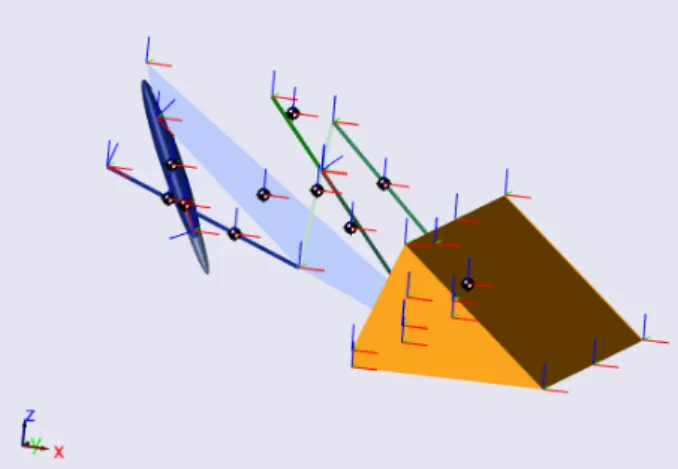
The control system was then integrated into the Volvo simulation model. This is a more complex model with a number of subsystems and blocks for control of different parts of the system that together represent the simulation of the boom and bucket. The boom with bucket were simulated separately by being virtually connected to the wheel loader with mechanical reference points. A graphical representation is obtained by running the model and can be seen in Figure10.
Figure 10: The figure describes the graphical representation of the simulation
Gravel forces in x, y and z-directions can be applied to the bucket to represent the load. This is where the collected log data were used to test the system. Since the big simulation is more complex than theLCM the behaviour is also differing. To get the corresponding forces compared to the collected log data a first simulation test was made. By inputting a linear rising force the pressure from the piston side of the cylinder was collected. The force and the pressure were then used as a lookup table to translate the log data pressure into forces that correspond to the new system. The same procedure was performed as with theLCMwhere the forces were applied to the model to see if the output of the pressure corresponds to the log data pressure. A difference between the models does not only regard the complexity but also the point of where the forces are applied to in the models. In the case ofLCMthe forces are applied directly on the cylinder while in the Volvo model the forces are applied to the bucket, hence the translation of forces with help of the created lookup table. For testing with the PI+P controller a reset function was needed. This is needed since the piston position had to be manually moved in the simulation to the position that was used when collecting the logdata to get the same condition as when the logdata was recorded.
While the position is moved in the beginning of the simulation the integral part is working in the PI block and a possible wind-up might be created. To avoid this the reset is needed when the PI+P-controller is activated. This was also an important factor to count with when the code was tested in the wheel loader. After extensive tuning with autotuned PI and P blocks from theLCM
with finetuning and manual tuning by trial and error there were problems to reach a damping behaviour. It was later found out that the pressure proportional gain needed to be variable since a constant value did not cover the wide range of pressure changes. A low difference in pressure needs a low gain while a high difference need a bigger gain to be able to adjust the piston movement with wider proportions.
7
System Design for Dynamic Damping
Before the integration to Volvo’s simulation environment it had to be found a suitable place to put theLCMsubsystem block. By taking the important consideration into account that it had to be before the execution of an antirollback block a place was decided where it also had the joystick command, pressure and piston position signals nearby. A system overview can be seen in Figure
11.
Figure 11: The figure shows the proposed control system
The Switch Control determines when the control system is active and when it is deactivated which depends on the value of the operator command. If the value is zero the system is active, otherwise the operator is moving the joystick to actuate the boom which is a case where the system should rest. The Switch Control block also takes into consideration the Sample and Hold block and sends a control signal to it when the operator has released the joystick. This makes the Sample and Hold hold the last piston position to be used as the new reference value for the PI controller. The PI+P system and the filters will be further explained in the nextcoming subsections.
7.1
PI+P
A Proportional Integral + Proportional (PI+P) regulator has been developed during this thesis work. It belongs to the PID control family which is a control loop feedback mechanism that is widely used in industry to regulate process variables such as temperature, pressure and flow. It looks at a setpoint (reference) and compares it with the measured process variable [23]. The difference between them is the error that thePIDgives a correction action for. Each term contribute with characteristics to the controller [24]; P calculates the error value between setpoint and process variable which is multiplied with a gain, Kp. For a small error a bigger gain is needed but a too big
gain can in the meantime cause oscillations. The term I can reduce the error further by integrating the difference and multiplying with the gain Ki. The last term D, which is the derivative gain,
should be kept low to avoid oscillations, meaning that the controller will be less sensitive to changes of the setpoint or process variable. By using D with the gain Kd it is possible to react faster on
changes.
The controller output is a calculated summation and correction based on the proportional, integral and derivative terms. A mathematical equation for thePIDcan be seen below:
u(t) = Kpe(t) + Ki Z t 0 e(τ )dτ + Kd de dt (2)
which can be rewritten as
u(t) = Kp(e(t) + 1 Ti Z t 0 e(τ )dτ + Td de(t) dt ) (3)
where u(t) is the controller output, Kp is the proportional gain, e(t) is the error value between
desired setpoint and process variable, Ti is the integral time and Td the derivative time.
The PI+P regulator developed is a multiple input single output controller that takes sensor measurements of the lift cylinders piston position and pressure of the piston chamber as inputs. The output is a command signal to control the piston speed in mm/s. As a relation to the PID the equation for thePI+Pregulator yields:
u(t) = Kp(e1(t) + 1 Ti Z t 0 e(τ )dτ ) + Kpvare2(t) (4)
The proportional and integral of the PI part is utilized to keep the piston position along a setpoint value over time. The system is able to adjust the setpoint automatically based on where the position is measured when the joystick is being released. The release of the joystick means that an active movement from the operator (through the joystick) has taken place to higher or lower the boom. When the piston position now is changed, the new piston position is the desired setpoint that needs to be kept over time. The actual damping comes from the proportional Kpvare2(t) of
the P part. Pressure acts as the input and the setpoint in this case changes depending on the pressure received in the cylinder by external forces. Kpvar is a variable gain that is controlled
adaptively through gain scheduling depending on the size of e2(t). A linear equation, y = Kx,
has been implemented for this purpose where the input x is the error and the output y is the gain Kpvar. The variable K determines the slope of the line which affects the proportion of the
damping. The linear function has to go through origin since no gain is desired when there is zero error. The pressure signal input is filtered by a moving average filter with short window size, acting like a lowpass filter, to remove the high frequency components and smooth out the pressure curves. The filtered signal is then compared with the setpoint, which is the original input pressure signal filtered with a moving average filter with a longer window size. This makes up for an error input to the P-controller that strives to alter the piston depending on the pressure and at the same time send smooth command signals for pump control to avoid a vibrating behaviour and stress of the components. The output from the P part is then added with the output of the PI part to combine damping with position keeping. The combination of the two acts as the control signal for steering the velocity of the piston.
7.2
Filters
In the literature, several works identified that the frequencies responsible for causing major vibra-tions in wheel loaders are between 1-3Hz [11]. It was also mentioned that these vibrations could be measured from the lift cylinder pressure data. This information is essential for designing a system that can detect the unwanted frequencies and attenuate them. This information also had to be confirmed using theLCMand the log data from Volvo LX1 before starting the design of theDBSS. The system relies on the piston pressure signal to measure the vibrations. The vibrations affect the piston pressure more than the rod pressure because the weight of the boom and the weight of the load are mostly carried by the lift cylinder piston’s side. Also the wheel loader is equipped with a pressure sensor that can collect data in real-time.
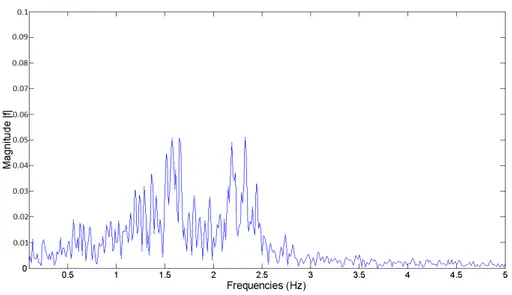
Figure 12: Applying theFFTto the piston pressure signal reveals its frequency content in frequency domain.
The method of finding the frequencies has been the Fast Fourier transform (FFT) [25] [26]. It is a reliable method to decompose a signal in time domain and show its frequency content in frequency domain with the magnitude of each frequency. It has an algorithm that samples the signal over a period of time and computes its discrete Fourier transform.The result in figure12
shows that pressure frequencies are in the interval of 1-5Hz, but has peaks around 1.6Hz and 2.4Hz. This result agrees indeed with literature works and complies with what is already know withinVCE.
The design of theDBSSstarted by creating a filtered pressure signal that does not contain the unwanted frequencies and should be as stable as possible, hence pressure stability gives less vibra-tions, the higher the pressure oscillations are, the higher the vibrations are in the wheel loader. The purpose is to use the filtered pressure as a reference signal in the P-controller. The system should strive for a reduction of the unwanted vibrations and set a goal for the piston pressure to imitate the filtered pressure reference signal.
By taking a look at figure12, it shows that most unwanted frequencies are around 1.6Hz and 2.4Hz. Therefore, the reference signal should contain as little as possible of these frequencies. An optimal behaviour should have as stable pressure signal as possible. Therefore, the reference signal should not only attenuate undesired frequencies but also have a smooth representation of the pressure signal.
Therefore, a low pass filter with cutoff frequency under 1.6Hz is a good solution for producing the reference signal in the P-controller. The filter must be of discrete type because the code will run on a engine control unit with discrete communication bus. Furthermore, there is a limited small memory available on the wheel loader embedded computer, which is an important factor to consider.
Matlab Simulink low pass filters were used at first but they did not give a satisfying result for a good reference signal. After many attempts with different cutoff frequency values, the filters always showed some offsets and were not able to give a steady signal. Therefore, a new approach had to be considered.
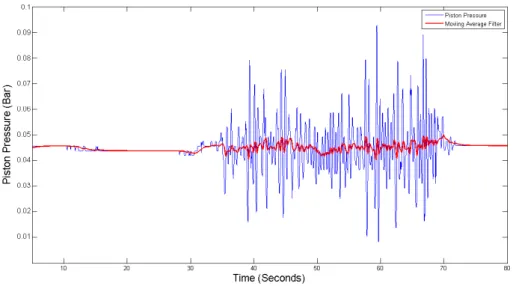
Figure 13: The blue plot represents the pressure signal unfiltered, while the red plot represents the same signal filtered.
A moving average filter was used instead. It showed a much better result by giving a much smoother signal whilst reducing the unwanted frequencies. It also has a better offset and phase shift. The figure 13 shows the comparison between the original pressure signal and the filtered signal (reference signal).
The moving average creates a series of previous mean data n. When a new data arrives, it calculates a new average and add it to previous averages.
Figure 14: The frequency content of the filtered signal with a moving average filter.
The frequency content of the filtered signal can be seen in figure 14. There is a noticeable attenuation of frequencies around 1.6Hz and 2.4Hz. Therefore, it proves that the moving average filter is able to generate a pressure reference signal to be included in theDBSS.
8
Results
This section will describe the results of different tests, which include comparisons between no damping and dynamic dampingDBSS. The passive dampingBSSis also included in the compari-son during the experimental tests in the Volvo LX1 wheel loader.
8.1
Lift Cylinder Simulation Model
The Lift Cylinder model was ready to validate damping results with theDBSSafter verifying it as described in section 6.1. TheDBSS has been validated with two types of tests; one without applying any load, and the second is while applying a load, this results in different pressure values, thereby different controller parameters are required. The load data are real log data taken form the Volvo LX1 while driving over gravel heaps and it has been used earlier to verify the Lift Cylinder simulation model. The piston position is simulated as constant. The simulation ran two rounds, the first round is while theDBSSinactive, and the second round is while theDBSSis active. Then a comparison between the two round is presented in the subsections below.
The results shown below came from adjusting the gains of theDBSS’s controllers manually until they reached an adequate good damping.
8.1.1 Damping Without Load
This subsection is for showing the results of damping without applying the load, where only the bucket and the boom weight are considered.
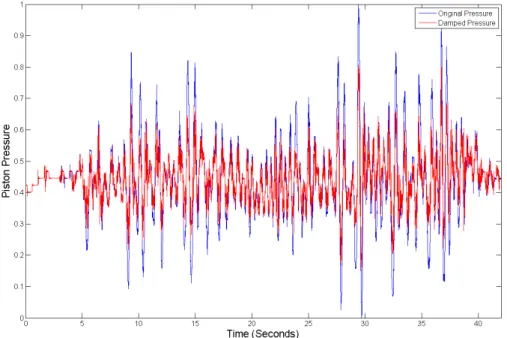
Figure 15: The piston pressure signal without the load. The blue plot is without theDBSSand the red plot is with theDBSS. This shows how the pressure signal became compressed.
The figure15shows the difference in pressure with and without the DBSS. The pressure now has lower spikes in both directions, up and down. It is a good indication of possible damping, but theFFT should be plotted to confirm the result.
Figure 16: The Fourier transform of the piston pressure. This shows what frequencies have been damped by theDBSS.
The next step is to compare the frequency domain of the original pressure and the damped pressure using theFFT. The results are shown in figure16. Since the magnitude of frequencies between 1-3Hz has been attenuated. This indicates damping of the unwanted vibrations, and the
DBSSis working successfully.
Figure 17: The histogram in the figure indicates the increased stability of the piston pressure, hence it is less spread and has an increased number of elements in the middle.
As mentioned earlier, that ideal damping would have as stable pressure as possible, closer to constant, therefore it is reasonable to plot a histogram of the pressure data to show the distribu-tion of the pressure in the original and damped case. Figure17 shows that the variance of the distribution is smaller than in the original case, thus providing more stable results.
Figure 18: The plot shows how the piston behaves when theDBSSis activated. The piston position is almost constant without theDBSS, while it is constantly moving with theDBSS.
As it is described earlier that theDBSScontrols the piston position to achieve damping. There-fore the figure18 is included to demonstrate the movement of the piston position and how it is related to the pressure spikes (see figure15). The higher the pressure spikes are, the higher the displacement of the piston. However, it keeps the movement of the piston in a restricted interval, which is taken care of by the PI-controller.
Condition STD Pressure Max Pressure Min
Without DBSS 0.1280 1 0
With DBSS 0.0744 0.8074 0.1506 Table 1: Comparison table
The table 1 above shows the differences in pressure and STD measurements. The damped pressure has lessSTDand smaller min and max pressure values, hence it is damped.
Conclusion can be drawn based on the results above that the DBSSgave good damping results without having a load.
8.1.2 Damping With Load
Now the same results are demonstrated in this subsection but with the load applied, where the bucket and the boom weight are also considered.
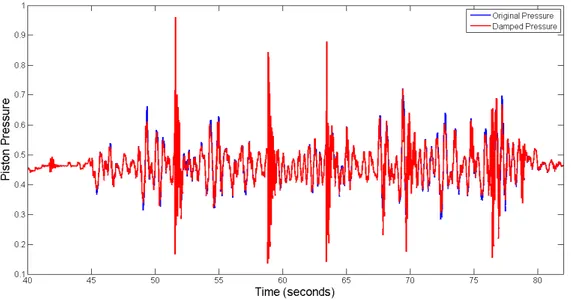
Figure 19: The piston pressure signal with the load. The blue plot is the original pressure and the red plot is with theDBSS.
The figure 19 shows the difference in piston pressure with and without the DBSS, while the load is applied. The pressure now has lower spikes in some areas, in both directions, up and down. It is a good indication of possible damping, but theFFT should be plotted to confirm the result.
Figure 20: The Fourier transform of the pressure data. This shows what frequencies have been damped by theDBSS, while the load is applied.
Taking a look at the frequency domain of the original pressure and the damped pressure using the FFT is shown in figure 20. Since the magnitude of frequencies between 1-3Hz has been
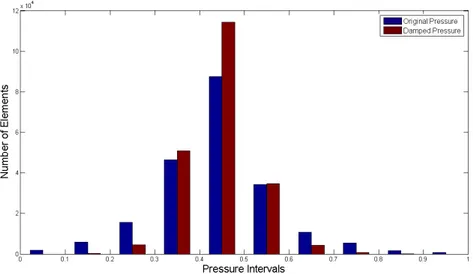
Figure 21: This histogram shows the number of pressure elements in different pressure intervals. The elements are more centred, since the pressure is more stable. This indicates increased stability in pressure.
The histogram in figure21compares the distribution of the pressure in the original and damped case with the DBSS. The damped pressure data shows that the variance of the distribution is smaller than in the original case, thus providing more stable results.
Figure 22: The plot shows how the piston behaves when theDBSS is activated while the load is applied. The original piston position is almost constant, while it is constantly moving with the
DBSS.
The figure 22 demonstrate how the piston is constantly moving dependently on the pressure (see figure19). The higher the pressure reaches are, the higher the bigger the piston movements are. However, it keeps the movement of the piston in a restricted interval, which is taken care of by the PI-controller. The piston movements takes larger steps when there is a load applied (higher pressure), because it has to work harder to achieve damping.
Condition STD Pressure Max Pressure Min
Without DBSS 0.1082 1 0
With DBSS 0.0818 0.9355 0.1175 Table 2: Comparison table
The table above 2 shows the difference in pressure and STD measurements. The damped pressure has lessSTD, which indicates a more stable signal. Also it has smaller smaller min and max pressure values, thereby it is damped.
Conclusion can be drawn based on the results above that the DBSSgave good damping results while applying a load.
8.2
Volvo Simulation Model
The control system that has been integrated from theLCMto the Volvo simulation has been tested and the results can be shown below in this subsection. The model has primarily been constructed to be used for energy analysis which made the dynamics less prioritized. The simulation works well but it has to be taken into account that some of the components are ideal which affects the damping behaviour of the simulation. Friction is such a part that differs between simulation and the actual machine.
8.2.1 Damping Without Load
It can be seen in Figure23that small amounts of pressure reduction has been achieved. There is also some undesired oscillations and spikes that reaches high pressure values, those are a probable cause of the ideal components and a better damping result was expected in the machine.
Figure 23: The figure describes the pressure with and withoutDBSS, without load. The damping behaviour can be analyzed with frequency analysis provided in Figure24. It is of interest to reduce the frequencies between 1-3Hz and for this wheel loader the natural frequency lies around 1.6Hz. There are frequency components around 1.6 and 2.2Hz that need to be reduced for better driving comfort and it can be seen in the figure that some of those frequencies are reduced.
Figure 24: The figure describes the frequencies with and withoutDBSS, without load. The piston position can be seen in Figure25as it moves depending on the pressure withDBSS
in red and without any damping system in blue color.
Figure 25: The figure describes the piston position with and without DBSS, without load. 8.2.2 Damping With Load
The pressure graph with load is described in Figure 26. Similarly as in Figure 23it can be seen that a small reduction of pressure has taken place.
Figure 26: The figure describes the pressure with and withoutDBSS, with load.
By taking a look at the frequency domain in Figure 27, the peaks at around 1.2Hz are the ones that are desired to be damped. It can also be seen that the high peaks are lying on different frequencies compared to Figure 24 which is because of the load, the heavier weight contributes more to lower frequencies.
Figure 27: The figure describes the frequency domain with and without DBSS, with load. The piston position shown in red color in Figure28is moved according to the gain scheduling while the blue color represents the system without any damping algorithm. The long peaks pointing downwards can be compared with Figure26, at the corresponding time, where the piston travels a longer distance because of the high pressure changes.
Figure 28: The figure describes the piston position with and without DBSS, with load.
8.3
Experimental Tests
Two test drives have been performed with the machine. The first one turned out to be more of an experiment because software fixes was revealed and had to be fixed so the results in this section are based on the second day of testing. The code with the control system that has been constructed was generated, built and then installed in the machine. A test track was built on the test field with a number of piles of gravel. Three different test cases were considered:
• withoutBSSand withoutDBSS
• withBSSonly • withDBSSonly
Of all three test cases each of them are considered one test drive with empty bucket and another drive with filled bucket, see figure29. The speed is 5km/h and the boom angle tried to be kept about the same during all test cases.
8.3.1 Damping Without Load
The test cases in this category can be seen in Table3. Eight trials were run with the new system and according to the results a suitable slope for these driving conditions is indicated to be between 0.08-0.24. The graphs shown below in this subsubsection belong to trial 6.
Trial Condition Slope STD
Reference run Without (D)BSS – 9.1488
Reference run BSS – 4.7630 1 DBSS 0.04 7.0768 2 DBSS 0.08 6.4697 3 DBSS 0.12 6.1088 4 DBSS 0.16 6.2787 5 DBSS 0.20 7.1637 6 DBSS 0.24 6.1291 7 DBSS 0.28 7.3772 8 DBSS 0.32 7.5468
Table 3: The table describes the results of all test drives in the category.
In Figure 30 a pressure graph is shown with the original pressure signal without damping systems utilized, a damped signal usingBSSand the authors systemDBSS. TheDBSShas reduced the pressure, as can be seen by the amplitude differences, but is far off compared to the reduction with theDBSS.
Figure 30: The figure describes the pressure with original pressure,DBSSand withBSS, without load.
By comparing the signals in frequency domain, in Figure 31, it can be stated that the DBSS
has cut off the high peaks of frequency in the important interval but is not as effective as theBSS, which has reduced most of the frequencies.
Figure 31: The figure describes the frequency domain with original frequencies, DBSSand with
BSS, without load.
By analyzing the piston position on the other hand in Figure 32 conclusions can be drawn about the behaviour. TheDBSSkeeps the position over time which theBSSdoes not. As theBSS
also should keep the position over time this test drive might not be a well suited reference for the
DBSSsince theBSSpressure and frequencies in Figure 30and Figure31respectively depend on the piston position.
Figure 32: The figure describes the piston position with original signal, DBSS and with BSS, without load.
8.3.2 Damping With Load
The test cases in this category can be seen in Table4. Five trials were run with the DBSSand according to the STD trial 5 was the most damped one with a lower STD than theBSS. The first three trials were run with a longer window size of the moving average filter while the two last trials were run with a shorter size. The graphs shown below in this subsubsection belong to trial 5.
Trial Condition Slope STD Reference run Without (D)BSS – 16.7287
Reference run BSS – 11.8005 1 DBSS 0.08 14.1571 2 DBSS 0.16 17.0610 3 DBSS 0.20 13.5744 4 DBSS 0.16 13.5327 5 DBSS 0.20 11.5864
Table 4: The table describes the results of all test drives in the category. The pressure graph can be seen for one of the test cases with load in Figure33.
Figure 33: The figure describes the pressure with original pressure, DBSS and with BSS, with load.
The frequency graph in Figure 34shows a similar reduction of frequencies between BSS and
Figure 34: The figure describes the frequency domain with original frequencies, DBSSand with
BSS, with load.
In Figure 35it can be seen that the position of the reference drive without damping systems lies above the other two drives, meaning that the angle of the boom was bigger. TheDBSSkeeps the position over time well and theBSS keeps it fairly well too but is lowered a little bit.
Figure 35: The figure describes the piston position with original signal,DBSSand withBSS, with load.
8.3.3 Uneven Terrain with Load and High Speed
These test drives were performed a bit differently than the previous drives. The piles of gravel were not used, instead the wheel loader was driven on the test field on uneven terrain in a speed of approximately 20km/h. The driving distance for each test was longer and a load of gravel was carried during the tests. The results can be seen below in Table5.
Trial Condition Slope STD Reference run Without (D)BSS – 21.3229
Reference run BSS – 10.9014
1 DBSS 0.08 12.9587
2 DBSS 0.12 16.3390
3 DBSS 0.16 22.0656
Table 5: The table describes the results of all test drives in the category.
Three trials were run during this test case and here it can be interpreted that a lower slope is needed with the combination of high velocity and load. The graphs shown below in this subsub-section belong to trial 1.
The reduction of pressure is visible in Figure36. TheDBSSshows a similar behaviour as the
BSSbut theBSSseems to be more damped.
Figure 36: The figure describes the pressure with original pressure,DBSSand withBSS, with load and high speed.
Frequency domain in Figure 37 reveals the similar behaviour. The BSS has reduced more frequencies around 2Hz while theDBSS reduced more around 1.3Hz but the difference is in the favor of theBSS.
Figure 37: The figure describes the frequency domain with original frequencies, DBSSand with
BSS, with load and high speed.
The positions in Figure38also have many similarities between the damping systems and it can be seen that the ?? has in general lower amplitude of the piston travel.
Figure 38: The figure describes the piston position with original signal,DBSSand withBSS, with load and high speed.
9
Discussion
Simulations and experimental tests have shown results indicating a damping behaviour that can be improved to compete with the existingBSS. The results revealed a damping that in some cases were close to the BSS, which can be seen in Table 5 for trial 1. During one test run the DBSS
even beat the existing suspension system by small margins, presented in Table4, with respect to standard deviation. Several parts of the system can be improved and optimized to achieve better results.
When analyzing and evaluating the results several aspects have to be considered. This thesis uses standard deviation together with frequency, pressure and piston position analysis as the most important metrics to evaluate the damping behaviour. Another metric that could be useful and to facilitate comparisons with papers in the same field would be the use of acceleration sensors that can measure accelerations in the cab to get better understanding for the operator’s condition or between the cab and the boom for damping analysis.
The control system has been tested under different circumstances, with load and without load. It has also been implemented in two simulation environments; in the LCM, which is built and verified by the authors, and Volvo’s own simulation model.
There are two controllers used in theDBSS, one PI-controller for regulating the cylinder position over time, and a P-controller for regulating piston pressure.
At the beginning the gain parameter of the pressure related P-controller was a constant and the
DBSSdid not achieve good damping results even though the regulator was stable in simulation. Extensive manual tuning was performed and an attempt to tune the controllers with Ziegler-Nichols method [27] resulted in no improvements with only small insignificant amounts of damping, other tuning methods could be used for tuning the controllers, see for example [28]. After investigating the problem and trying different combinations of gain parameters, it became clear that low pressure errors required low gain parameters, and high pressure errors required higher gain parameters. A constant pressure gain could not be utilized during a whole simulation run and the system’s pressure related P-controller was changed to be adaptive. This helps the gain to adapt according to the error, and it was solved using a linear function that generates gain parameters depending on the error. The proportional and integral gains of the PI-controller were first automatically tuned by the SimulinkPIDblock in theLCMand then finetuned manually in the Volvo simulation by test and trial. As can be seen from a simulation run in Figure 25 the PI controller can be further refined to keep the position over time even though it managed to accomplish the task for most of the experimental test cases, for instance during the high speed test in Figure38. The pressure based P-controller was tuned by increasing the slope of the linear equation in both simulations. Since this tuning only has one parameter that controls the gain output it could be easily tested during the experimental tests by starting with a low slope and increasing for each test run as can be seen in Table3,4 and5.
10
Conclusions and Future Work
A proposedPI+P control system has been developed based on existing working actuators for a fixed displacement controlled wheel loader prototype with dynamic vibration damping as the tar-get. A simulation model, LCM, has been developed to test the algorithm. Real log data was inputted to the system to drive the simulation and to verify it. The control system of the LCM
was then integrated to a simulation environment provided byVCE to test it further where the same log data was used for input and verification. When damping was achieved experimental tests were performed with the real machine that provided results for different test cases. The outcome of the tests has been analyzed by frequency analysis and by examining the standard deviation. The frequencies have been reduced in the target interval between 1-3 Hz. A general capability of attenuating vibrations was achieved from the tests. However, the test cases would need to be run a number of times to be able to determine a more reliable level of damping. In Figure32for instance, it is difficult to know how theBSSwould attenuate if the position would be kept over time. The results achieved during simulations and experimental tests can be further improved by investigating the gain scheduling in detail. During the tests performed a linear equation was used with different slopes. Different configurations can be evaluated to see if there are more effective equations to be used. The results showed that different slopes were needed for different situations to achieve adequate damping. This is a point of improvement for the future work where the system should be able to adaptively choose a suitable gain for the corresponding circumstances. An optimization algorithm might be desired here. The wheel loader may also be mathematically modelled to analyze the behaviour for investigating which control parameters are the most suitable to use.
It has also been concluded that constant gains are not suitable for this kind of application. The error will vary to the degree that the gain needs to be variable for the pressure controller. The PI controller was kept with constant manual tuned values and can remain the same during a whole test run. It might be that the PI controller is better suited with variable gains as well depending on the environment and conditions.
ThePI+Pregulator can be extended with a derivative part to cut down on the response time and attenuate oscillations faster, making it a PI+PD regulator, to investigate if better damping is possible.
A future work could be to study the possibility of regenerating energy by utilizing the DBSS. This depends on the system layout, including what type of components the hydraulic system have. The Volvo LX1 has an electric hydraulic motor that can work as a generator when it rotates in the opposite direction. This property can be an advantage for theDBSS, since the piston movements can return oil through the pump while lowering the boom, thereby the returning oil can rotate the motor in the opposite direction which makes electric energy regeneration possible.
11
Acknowledgment
We would like to express our gratitude towards our supervisors Patrik Stener at Volvo and Alessan-dro Papadopoulos at IDT for providing us with knowledge about hydraulic systems, wheel loaders, control systems and many other scientific aspects.