MASTER THESIS WITHIN: Business Administration NUMBER OF CREDITS:
15
PROGRAMM OF STUDY:
International Financial Analysis
AUTHORS: Efe Akinci, Jing LiADVISOR: Professor Agostino Manduchi DEPUTY ADVISOR: Toni Duras JÖNKÖPING May 2018
Bitcoin and Stock
Market Indexes
Master
Thesis in International Financial Analysis
Title: Bitcoin and Stock Market Indexes Causality Authors: Efe Akinci and Jing Li
Tutor: Professor Agostino Manduchi Date: 2015-05-21
Key Terms: Bitcoin, Stock Markets, Augmented Dickey-Fuller, Lagrange Multiplier, Autocorrelation, Cointegration, Granger Causality
Acknowledgments
We thank our supervisor, Professor Agostino Manduchi for giving recommendations, advice. Secondly, we thank our deputy advisor, Toni Duras, for helping to interpret our results in deeply. We appreciated to Pär Sjölander, Andreas Stephan, Aleksandar Petreski for teaching analytical methods, portfolio management, and investment-financial analysis respectively. Finally, we thank the members in our seminar sessions for their contribution, criticizing questions and discussions.
Sincerely,
Abstract
This paper studies Granger Causality relations between Bitcoin and 5 stock market indexes which are Japan, Russia, South Korea, Sweden and the United States. The time-period examined is from 2013 to 2017 and all the tests are conducted based on daily data. We analyze this in three different periods, last 5 years (2013-2017), in 2017 and last 3 months of 2017.
To estimate the relationship, we use unit root test and Augmented Dickey-Fuller, Lagrange Multiplier, Johansen Cointegration Test and finally Granger Causality Test. After the tests, countries have a same integrated order that exhibits a long-run relationship. In causality, except for Russia, each country has affected the Bitcoin prices and being affected in a different period, especially in the last 3 months of 2017, the impact and popularity of Bitcoin affect too much the stock market in the short-run.
As a result, the causation between Bitcoin and stock market indexes shows impact statistically significant in the 2017 year. The importance of cryptocurrency and popularity not as much as hype like late 2017 in 2018, but we think that cryptocurrencies are one of the major currencies that affect economical world very deeply.
Contents
1. Introduction ... 1
1.1. Background ... 1
1.2. Problem and Purpose ... 3
1.3. Research Question ... 4
2. Literature Study ... 4
2.1. Cryptocurrencies and Bitcoin ... 4
2.2. Stock Exchanges ... 10 2.2.1. Japan... 10 2.2.2. Russia ... 11 2.2.3. South Korea ... 11 2.2.4. Sweden ... 12 2.2.5. USA ... 13
3. Data and Methodology ... 14
3.1. Data Collection ... 14
3.2. Augmented Dickey-Fuller Test ... 16
3.3. Lagrange Multiplier-Autocorrelation Test ... 16
3.4. Johansen Cointegration Test ... 17
3.5. Granger Causality Test ... 18
4. Empirical Results ... 19
4.1. Unit Root Test Results ... 20
4.2. Serial Correlation LM Test Result ... 21
4.3. Johansen Cointegration Test Results ... 21
4.4. Granger Causality Results ... 24
5. Conclusion and Discussion ... 26
6. References ... 29
List of Tables
Table 1: Stock Market Indices in 5 Different Countries ... 14
Table 2: Descriptive Statistics ... 15
Table 3: Correlation of Stocks and Bitcoin ... 15
Table 4: Abbreviations ... 19
Table 5: Unit Root Test Results at level ... 20
Table 6: Unit Root Test Results at 1st Difference... 20
Table 7: Results of LM-Autocorrelation Test ... 21
Table 8: Johansen Cointegration Test of Japan ... 21
Table 9: Johansen Cointegration Test of Russia ... 22
Table 10: Johansen Cointegration Test of South Korea ... 22
Table 11: Johansen Cointegration Test of Sweden ... 23
Table 12: Johansen Cointegration Test of United States ... 23
Table 13: Granger-Causality Result of Japan ... 24
Table 14: Granger-Causality Result of Russia ... 24
Table 15: Granger-Causality Result of South Korea ... 25
Table 16: Granger-Causality Result of Sweden ... 25
List of Figures
Figure 1: VIX-Bitcoin relationship ... 7
Figure 2: Correlation between S&P 500 and Bitcoin Prices ... 9
Figure 3: Google Trending when writing the word “Bitcoin” ... 9
List of Appendices
Appendix 1: Unit Root Results (ADF Test) ... 33
Appendix 2: Determination of the optimal lag length ... 37
Appendix 3: Diagnostic check for residuals, Serial Correlation LM Tests ... 40
Appendix 4: Johansen Test result ... 41
Appendix 5: AR Roots Graph ... 45
1. Introduction
1.1. Background
Bitcoin is a digital worldwide payment system that has decentralized, partially anonymous currency functions and there is no any support from government or institutions. (Grinberg, 2011) founded by Satoshi Nakamoto (Nakamoto, 2008). This technological innovation increased the potential of digital currencies and become mainstream for consumers and customers. After 2013, authorities and banks look the development of the cryptocurrencies and digital currencies that these will make a huge impact in country’s economies and financial markets in a large-scale (Engert and Fung, 2017).
However, the rise of cryptocurrencies could have a significant impact on monetary systems of countries as they are privately issued currencies, thus not regulated by central banks. As of Bitcoin is in the news and going into a global trend, governments are curious about what will the future of finance world that it creates some plans about to adapt cryptocurrencies in their economies (Chen, 2017). Many people have digital currencies or use it in transactions mostly in bitcoins. Kamada (2017) mentioned that in many transactions individuals choose digital currency rather than paper currency and there is a shifting trend preference to use digital currency. Moreover, the usage of digital currencies getting stronger in many countries such as Japan, USA, and South Korea. Digital currencies are not a big threat to financial stability at that moment, but improvements do not disclaim, and it is conceivable in near future that these free-floating digital currencies have a potential to be an asset price that takes attention in financial stability (Ali, Barrdear, Clews, and Southgate 2014).
An economic and financial consultancy company Datatrek’s analysts divided into three holding periods which they are 10 days, 30 days, and 90 days for looking the relationship of bitcoin and S&P 500 since January 2016. In the analysis, there is a strong connection between two variables. For 10 days the percentage is 79%. It is gradually decreasing in 30 and 90-day period and the correlation ratios are 52% and 33% respectively. According to the analysts, the financers and brokers are responsible for the rising popularity of bitcoin to extend its trend for the correlation. Analysts mention that “Since investors have only one brain to process risk, they will make similar decisions about cryptocurrencies and stocks when they see price volatility in the latter,” they wrote (Sharma, 2018).
ECB (2012) mentions that one of the virtual currencies function is pretending like a medium of exchange and a unit of account in virtual currency world. Investors are looking the rise of bitcoin prices and willing to trade exchange currencies more than in previous days. However, the thing is that there are lots of misleading information about the price of Bitcoin and this conflict creates a panic in the financial world and make bubbles in many times. In contrast, Winklevoss twins earned over a $1 billion on bitcoin since 2011 and became the first billionaire of this currency (Morris, 2017). Some people do not believe of the reality of Bitcoin in early stages, but one thing is clear that if a person put money on Bitcoin just say $100 dollars, it is not a waste investment for sure.
The maturity of this new virtual currency brings gain more than most trustable stocks, even many people do not believe about this idea. The macroeconomic variables are affected by the maturity of bitcoin and the connection is getting stronger (Baek and Elbeck, 2014). The logical explanation for this situation is maturity engaging in the economic performance of S&P 500 and Bitcoin may reflect in some macro levels to shape the economy of United States.
There are many links between bitcoins and stock exchange indexes. A stock exchange index is a measure of the dynamics of the value of the stock exchange in its whole or of a specific industrial or services sector (Alexandru, 2012). In finance system, Peter Fortune who the Director of Research at Boston FED mentioned that there is a comparison between stock market indices and bitcoin. He examines the correlations between the returns on each of the stock price indices. In related to Fortune (1998), there are findings suggest that many indices have similar relations with bitcoin. On the other hand, there is a different segment of the market that not related to each other. Investors have looked up stock exchange indices that provided by lots of high standards and concentrated interaction flows during the day. By monitoring the evolution of the value of a stock exchange index, it is possible to identify the overall tendency of a stock exchange or of one of its sectors for bitcoin, represented by the direction of the general movement of the prices of securities, usually shares, in the respective market or in the analyzed sector (Alexandru, 2012).
Granger causality is used for determining whether one-time series is useful in forecasting another to see a relation (Granger, 1969). One of them is in Akben-Selcuk (2016) paper, most of the researchers conducted in the field of stock markets analysis has focused on the increased integration, international dependencies, and efficiency of the
markets. The These assets have been extensively analyzed by Granger causality testing. We think that it is the best way to relate stock markets indexes with bitcoin by using this method. The remainder of this paper is constructed as follows. Section 2 reviews literature study in two different subjects that cryptocurrencies - bitcoin and stock exchanges. Section 3 describes data and methodology that we applied in this research which they are Augmented Dickey-Fuller, Lagrange Multiplier, Johansen Cointegration and Granger Causality. Section 4 mentions about empirical results of our methodology showing Augmented Dickey-Fuller stationaries, Lagrange multiplier which we can see if there is an autocorrelation or not in between stock exchanges and bitcoin, cointegration tests of stock market indexes, the Granger causality between stock market indexes and bitcoin. Section 5 gives conclusion and suggestion for upcoming papers.
1.2. Problem and Purpose
At the end of 2017, cryptocurrencies have never been more popular, and people want to demand it for their own. The transferring of money and purchasing exchange currencies have some costs and fees. In many cases, using exchange currencies for buying and selling of cryptocurrencies are not profitable and inefficient in investing. On the other hand, there is no any involvement of government or intermediary institutions of the third party that costs of bitcoin transactions are lower than exchange currencies transactions.
The transaction speed between parties is so quick in cryptocurrencies because there is no any third party to regulate all the operations and eliminate classical transaction procedure by banks and intermediaries. For this reason, lots of investors attract the bitcoin investment because it gains an incredibly high benefit returns to their portfolios. One of the causes is that not so much correlations with financial assets. (Brière, Oosterlinck and Szafarz 2015).
Bitcoins are generally used in regularly payment system with cards and this option triggers the existing payment system by selling Bitcoins. Like with many online payment systems, if an investor wants to pay with Bitcoin, s/he has just needed an internet connection. Withdraw2Card is one of them. If customers want to sell their Bitcoins on one of the major exchange platforms on the internet sites and they will receive a redeemable coupon. In other words, purchasers do not need to go a bank or any exchange office to buy or sell of any bitcoin. Another advantage is that for these transactions those internet sites do not want any personal information, this gives a huge interest in bitcoin transactions and these coins involve more in stock markets by investors.
As a result, the purpose of this paper is to analyze bitcoin’s causality relationship with stock market indexes, to see countries stock market of applying or researching methods to implement in their economy and how was the connection between these variables starting from releasing of bitcoin.
1.3. Research Question
Q.1: Does Bitcoin have any causality relationship with 5 stock market indexes (Japan, Russia, South Korea, Sweden, and the USA) in the last 5 years, 1 year and 3 months respectively?
2. Literature Study
This chapter provides a review of bitcoin. Bitcoin is a very fresh word in finance word and in each day and we are getting more information about it, for this reason, there are restricted literature studies in the academical articles and there are many financial websites examination about Bitcoin’s situation in the financial world. Moreover, this chapter will analyze on theoretical subjects which these academical papers and financial sites based on, defining cryptocurrencies and looking relation with other assets, defining bitcoin and analyzing relationship with stock markets and looking stock market indices and its movements according to bitcoin volatility changes.
2.1. Cryptocurrencies and Bitcoin
In Grinberg’s article (2011), he mentions that there are many reasons for many people think about bitcoin is a deception. One of them is unexpected changes in the inflation rate can be imposed by software developers that can change the prices for their own will. This will cause a crisis in many government economies and exchange of currencies can be useless. Moreover, there are technical problems like the anonymity of the system is compromised, if money is lost or stolen, or if hackers or governments can prevent any new transactions from settling. As of many reasons, Bitcoin can be understood so well that if one-day bitcoin is used in the transactions, bitcoin will give confidence about these problems will not happen in the future. There is no doubt that bitcoin has a huge potential to be an important asset in the payment system in the world market. In addition, it is also an alternative currency for gold to hold the currencies in the bank accounts.
However, one currency named called Iraqi Swiss Dinar has the same features with bitcoin by not-backed government supporting. Saddam Hussein’s government did not manage to use their old currency in the war years which was 1990 Gulf War and created a new currency. This new currency used in the north of the Iraqi region and used in trading as well. The government printed in large quantities of this new currency that cause a hyperinflation in Iraq. After the U.S. invasion of Iraq in 2003, U.S. authority intervenes in the economy and change their hyperinflated currency to a newly Iraqi new Dinars. If we make a conclusion for this situation, if a government gives direction to its currency by printing more, it causes a big damage to the country and another conclusion is that without any government backed or institutional center, the Iraqi Swiss Dinar can sustain in economy world.
In Dwyer’s paper (2015), with the developing of technology, people reach their accounts by their smartphones instead of going to the bank and make transaction easily in each day. In these devices, there is no dramatic difference between dollar or bitcoin. If counting one difference, bitcoin is not controlled or regulated by a bank or another institution such as intermediaries or banks. This advantage gives bitcoin to use more in using transactions more and some people choose to invest bitcoin instead of stocks in economic markets. So, the demand of bitcoin provides an entrance financial system that can affect and cause the relationship with stock market indexes. The author suggests that bitcoin and these similar digital currencies are in under control of government’s ability for influencing the change of inflation. In these days, Bitcoin may not have an impact on the economic transaction, but in a couple of years, the relation with bitcoin and economic variables have related each other such as inflation, stocks, stock market indexes. When we looked all these information’s, the author warns the countries for the effects of bitcoin and similar digital currencies in their economic stability.
Brière, Oosterlinck, and Szafarz (2015) analyze bitcoin investment from the perspective of a U.S. investor with a diversified portfolio including both traditional assets which they are worldwide stocks, bonds, currencies and alternative investments that these are commodities, hedge funds, real estate using weekly data between 2010 and 2013. Over this period under the circumstances, bitcoin brings a high return and volatility due to the prominent features of its algorithm. On the other hand, bitcoin has low correlation with other assets such as gold, oil, and hedge funds. When looking from an investor’s frame, Bitcoins have decisive tools that make it a matchless asset against another economical asset such as gold. In a short run, Bitcoin affects the risk-return trade-off of well-diversified portfolio dramatically and a small
change in bitcoin price is enough to improve these portfolios. There is no indication of tests that it is applicable in the medium or long-run. At the end of the paper, authors emphasize that virtual currencies which in online banking transactions are beneficial for countries economy. People are already using bitcoin in transactions and trade on online sites and this new currency has impacted the exchange currency system very strongly day by day. In conclusion, authors message is these internet-based currencies must be taken very seriously by finance world especially by investors and see its behaviors very carefully against tangible assets. This paper presented by Bores and Hlaciuc (2016) shows the background of newly decentralized digital currency Bitcoin in other words development of cryptocurrencies. One of the function is the payment system that may be in a couple of years, Bitcoin serves as another alternative to the traditional using mechanism. However, many investors called bitcoin is an experiment for transaction functions and it has not enough ability to achieve these payment challenges. In a short term, it is useful, but it might be not a solution for long-term in currency payment. At the end of the paper, authors think that decentralized currencies are important in the next years. These currencies have no threat the financial market for now. On the other hand, cryptocurrencies especially bitcoin behaves like gold in different circumstances and this similarity to act for buying this newly currency asset. Investors want to buy bitcoin for their investment to save against instability actions in economic changes such as inflation and with this movement bitcoin enter the world market by purchasers.
Danezis and Meiklejohn (2016) state that despite their success, existing cryptocurrencies suffer from several limitations. The most important problem is the scalability which is the capability of a system, network, or process to handle a growing amount of work, or its potential to be enlarged to accommodate that growth (Bondi, 2000). Exclusively Bitcoin has at most 7 transactions in a second and struggle with significant challenges that increasing this number. While PayPal makes 100 transactions and Visa handles around 5,000 transactions per second. They notice the second problem which is not controlling the monetary system very well that it is hard to keep macroeconomic policy functions in stable economical standards and cause a volatility in the currencies between countries.
Dyhrberg (2016) investigates the capability of hedging the bitcoin against two stocks. These are Financial Times Stock Exchange Index (FTSE) on the London Stock Exchange in Great Britain and the American dollar. In general, bitcoin can be used as a hedging capability against FTSE index. With another economic asset gold, bitcoin reduce and even eliminate the main market risks. On the other hand, when compared with the American dollar, it is unclear
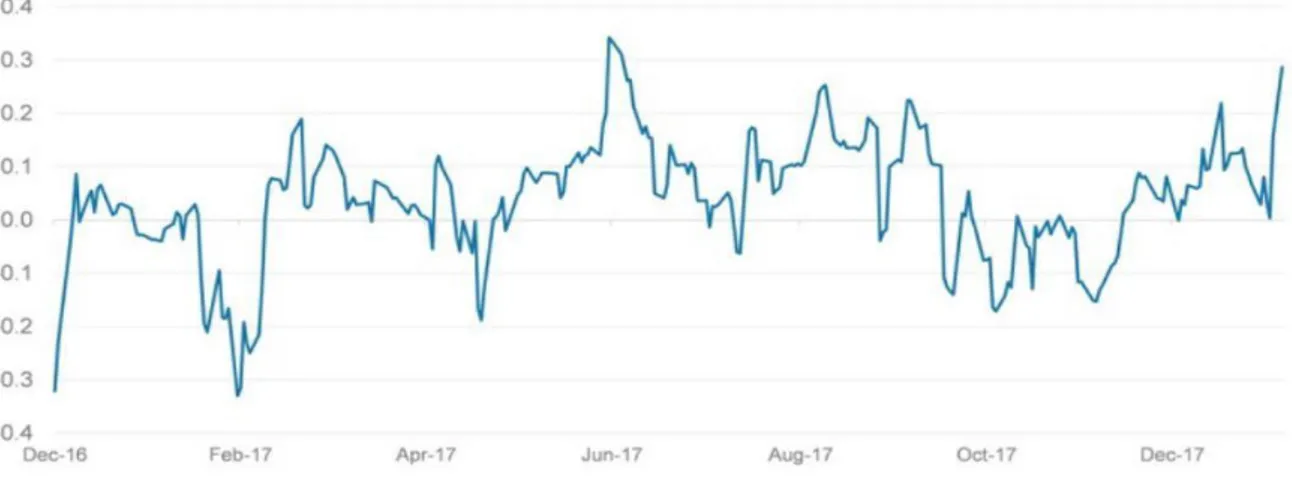
that correlation is not exactly found and there are low correlation values towards to bitcoin values. In the short-run dollar has positive signs in hedging capability against bitcoin. Moreover, the use of bitcoin trading too much that enable appropriate conditions for hedging. However, there are no experiments for hedging capability in the medium and the long run. In the end, Dyhrberg (2016) seems bitcoin can find a place in portfolio analysis and risk management and as indicated, Bitcoin can be used as a hedge against the FTSE Index and the American dollar. By author, bitcoin can be added to the list of instruments alongside gold and other assets to minimize risks. When we looked to other assets, Bitcoin has an advantage in a transaction that no third party involved which makes it more attractive and with this advantage, Bitcoin is one of the prominent tools to use in hedging by investors and analysts. At the below graph, Rhoads (2017) mentioned that there is a volatility calculation for both bitcoin and VIX from the period January 2nd to 8th November 2017. When we talked about the volatility, one of the indexes is VIX that measures of the stock market's expectation of volatility implied by S&P 500 index options, calculated and published by the Chicago Board Options Exchange (CBOE). As seen, their moves are a counterpart, when bitcoin volatility is increased, VIX’s volatility is decreased and same for we changed the variables.
Figure 1: VIX-Bitcoin relationship
Schut (2017) studied from an investor’s view how the increased maturity of Bitcoin as an asset can affect the characteristics of an investment tool. When looking market uncertainty and Bitcoin trade volume, there is a relationship between the increased maturity of Bitcoin. This result leads to S&P 500 has a significant relationship with Bitcoin prices. It is seen by
forming a regression the relationship between Bitcoin prices and macroeconomic variables. Furthermore, the results with macroeconomic variables show that the S&P500 price has a positive effect on Bitcoin prices. Lastly, the efficient frontier clears that when we want to create an investment portfolio, Bitcoin has useful to add this portfolio for making high returns for different diversified portfolios. Investors know Bitcoin very well that this digital currency uses in an asset and gains high returns more than expected. In near future, Bitcoin can develop and can be a serious alternative to invest in different portfolios.
Sovbetov (2018) examines factors that there are many influences on stock prices in today’s world economy and cryptocurrency are one of them. He analyzes the most common cryptocurrency Bitcoin over 2010-2018 using weekly data. Using Autoregressive Distributed Lag (ARDL) technique, there are some dynamics to determine both cryptocurrency prices and stock prices in short and long run. These long and short run ARDL model analyze to find statistically significant impact running from crypto market factors such as total trading volume, volatility, attractiveness and stock market index on Bitcoin in long and short run respectively. Trading volume has an important relationship with Bitcoin in the long-run in %1 significance level in the long-run. A unit increase in weekly trading volume causes 0.14 raises in Bitcoin in long-run. On the other hand, also volatility of cryptocurrency in Bitcoin has statistically significant determinant both in long- and short-runs for Bitcoin. The attractiveness of cryptocurrencies also important statistically significant.
When looking for long-run, there is a significant coefficient for Bitcoin at 1% significance level. In other words, 1 unit increase in attractiveness of Bitcoin, leads 1.27 units increases in their long-run prices respectively. In contrast, for short-run, the estimation is at 10 % significance level that attractiveness is not much strong compared to long-run. As a result, Bitcoin needs to be time for recognition itself and it brings more known in the log period span. When looking from S&P500 index, it has not a strong significant relationship with Bitcoin. Only 10% significant level with Bitcoin. In the short-run Bitcoin is not an important factor to affect S&P 500. However, in the long-run, it has a significant relationship in a positive way. This result shows that USD index has a stronger relationship in near future that it makes more valuable than other fiat currencies.
As shown in below graph, Cheng (2018) writes corner post about Bitcoin. According to Nick Colas, co-founder of DataTrek Research. When analyzing in the last 1-year, the correlation between daily percentage returns and S&P 500 is 33 percent, this is the highest number since cryptocurrency has a media attention at the beginning of 2016.
Figure 2: Correlation between S&P 500 and Bitcoin Prices
Zuckerman (2018) searches the number of ‘Bitcoin’ written in google search machine. Google Trends indicates that when Bitcoin reaches 20k$ in mid-December. There is a huge rising in searching the word ‘Bitcoin’. As shown in the below graph, left graph shows the google trend of ‘Bitcoin’ and the right graph shows the price of Bitcoin. In the same-period year in 2017, the tendencies of lines very resemble each other. We can’t conclude about searching the word ’Bitcoin’ in Google cause the price of Bitcoin. However, Google searching is one of the factors that might be affecting the price of Bitcoin.
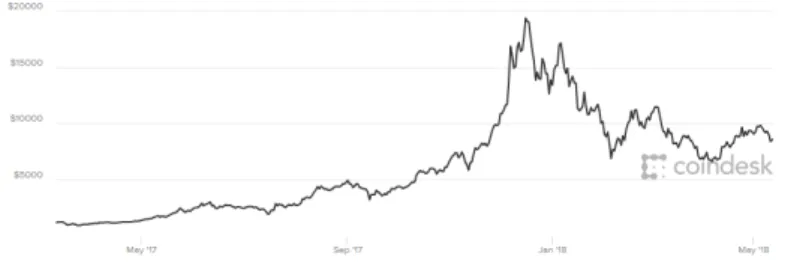
Figure 4: Bitcoin Prices in 2017 (Coindesk,2018)
2.2. Stock Exchanges
In this section, we see 5 countries which they are Japan, Russia, South Korea, Sweden, and the USA. We choose these countries because each country talks about implementing cryptocurrency in their economy or change their current system to cryptocurrency especially in bitcoin. There are some press releases about mention digital currency that some countries explanation can affect the cryptocurrency market and these countries people tend to buy digital currency. This will lead to causation of these economies and cryptocurrency market. We analyze their stock market and economies relation with cryptocurrency and bitcoin. This bitcoin is a new topic that with the beginning of 2017 many people try to understand these digital currency and bitcoin is one of the pioneers. Unfortunately, we can only find articles about this relationship in the economical websites and there is not a much academical article about this new topic. We look their actions about cryptocurrency and bitcoin in this part. 2.2.1. Japan
Kharpal (2017) investigates Japan’s perspective for bitcoin. Japanese banks are looking forward to launching their own digital currency called the J-Coin to decrease the usage of cash. Mizuho Financial Group is the pioneer of this new cryptocurrency movement. At the beginning of 2017, with the popularity of Bitcoin Mizuho tested a trade finance transaction via a blockchain and it is successful.
Adelstein (2018) wrote Japan’s new cryptocurrency called Monacoin and add his impressions about it. Monacoin is become a serious asset in recent years but is it worth to invest? This new Japanese cryptocurrency created in December 2013 from Japanese textbook called “2channel”. It resembles with bitcoin that also it’s creator has a nickname called “Mr.Watanabe”. Mr. Watanabe introduced his new currency as using much more in the video game called “Final Fantasy”. Mr. Watanabe states that his intention is not to create a new cryptocurrency, presents it as a virtual currency. After the dissolution of world’s largest bitcoin exchange site Mt. Gox in 2014 in that time, Monacoin got involved much more in
exchange trading especially in cryptocurrency market and changed its strategic plan as “safest currency that made in Japan.” At that time there are other four major exchange currency exchanges in Japan and Monacoin want to find a place in this exchange market. Monacoin got traded in ZAIF which is the local currency exchange site in Japan and many ATMs has also accepted exchange with this cryptocurrency. There is a huge demand for buying Monacoin because of its first cryptocurrency in Japan. There is an announcement that people are purchasing real estates as using Monacoin on 23 March 2017. JIT Holdings company is the first company to offer its Japanese citizens to buy a house, also there are hoping to extend their offers to abroad. Monacoin is mostly used in Japan and it is not an international cryptocurrency to trade in other countries too much. Most importantly for Japan, an investor can easily to get Monacoin in Japan and use in purchasing a house or in exchange currency. 2.2.2. Russia
Suberg (2018) mentions in his article that Russia’s President Vladimir Putin has signed a document on cryptocurrency mining starting by July 2018. Russian bank VTB stated that “has not seen a lot of interest in Bitcoin” from the country’s consumers. The bank’s CEO Andrey Kostin disagrees with the Putin’s idea of Bitcoin. He mentions that instead of popularity in Bitcoin, actual usage of Bitcoin is low, and at some point, cryptocurrencies damage the economy. It is hard to regulate and can be dangerous.
Chang (2018) mentions in his article that the Russian Ministry of Finance opposes Putin’s cryptocurrency idea. The Ministry plans to introduce a law that if anyone uses any cryptocurrency, s/he will be punished for using that. Elvira Nabiullina, head of the Bank of Russia, said she and the Russian Finance Ministry oppose the use of virtual currencies and her idea about cryptocurrency is "as private money and money surrogates”. Moreover, she adds that Russia’s currency is ruble and the only ruble can be used to pay for goods and services." The Ministry of Finance aims to protect its national currency ruble from any other digital cryptocurrencies for losing value. Also, Nabiullina states that "This is necessary to protect the ruble as the single legal payment in Russia".
2.2.3. South Korea
Guez (2018) speaks about the interest of Bitcoin in South Korea. South Korean authorities plan to preserve in cryptocurrency trading for preparing their economy for Bitcoin. On the other hand, the bitcoin price went down with the beginning of 2018 and South Korea Finance Minister Kim Dong-Yeon said “Shutting down digital currency exchanges was still an option
for the government”. South Korea is the third biggest market for Bitcoin trades, behind from Japan and US respectively and has a couple of exchange cryptocurrencies sites. South Korea use transaction in cryptocurrency trading very actively even though Bitcoin price is too volatile. One of the analytics firms in South Korea WiseApp made a survey that every 1/20 people in South Korea use cryptocurrency trading at least once and there is a huge increase in using these cryptocurrencies up to 2 million users. Government is hesitant about using cryptocurrency in daily life and implementing in their economy. Moreover, investors are careful and think about that it is just a short-term highly return on the investment. They think that people don’t fall in too much in this digital cryptocurrency market that government bring some legislation about trading exchanges and to avoid people from the tax evasion.
Reiff (2018) mentions that South Korean government think this volatility of Bitcoin can damage the economy and people are exaggerating the Bitcoin situation too much. Because of that, the government has thought about to act of threatening all cryptocurrencies used banning in South Korea and shut down some exchanges which ones related with cryptocurrencies. On the other hand, cryptocurrency gains so much reputation that the number of cryptocurrency exchanges app users increases 14 times in three months. In recent years, South Korea economy trend is not so well that there is an increasing number of the rate of unemployment causing a slowing down in the economy. People tend to invest in new assets which cryptocurrency especially Bitcoin is one of them. South Korean investors seem this high intensity on cryptocurrency may affect for allowing the government to take a step that can regulate some obligations of buying cryptocurrency. As a result, if there is a decreasing number of South Korean investment happen, Bitcoin prices can affect, and even other digital currencies prices can change in a negative way.
2.2.4. Sweden
Roden (2018) mentions about Sweden Central Bank, which was the name called Riksbank, published in November 2016 that there is a possibility to Sweden launch its own digital currency name called “e-krona” and Sweden may be the first country to do it. HSBC global economist James Pomeroy guesses can present it the next couple of the years. Sweden has to potential to take a further step for creating its cryptocurrency. One of them is, people do not use cash in daily life when they buy goods and products instead of their choice is always to use credit cards even in financial transactions. “Sweden is one of the pioneer countries that getting used the credit cards more than cash usage that Sweden is ahead of the UK, Europe,
and the USA in this area. Because of how technologically developed it is, you see a lot of new interesting things in economics quite a while before you see it elsewhere," Roden (2018). Pomeroy also told The Local that " Sweden’s cash usage is decreasing dramatically more than other EU countries. In payments, the usage of cash is at around 40 percent in 2010, in a 6-year period, this usage went to 15 percent in 2016. If this trend continues, The Riksbank will publish more interesting information about using cash and credit cards analysis that there will be no cash usage more than 10 percent in 2020." Roden (2018). With the beginning of 2017, there is a huge interest in cryptocurrencies especially in Bitcoin that makes it valuable because of the non-cash transaction between individuals or parties. Sweden can regulate its economic system very quickly because of Swedish people do not need any cash to transfer to their money.
In near future, Sweden will need a new type of currency to replace cash. However, it can lead to an economic crisis if there are no cash accepted places such as by intermediaries and banks. In this case, Riksbank takes step by slowly for the transition to a cashless economy and creating a new cryptocurrency may be good for Sweden. Lastly, James Pomeroy mentions "It's telling how many places in Sweden have stopped accepting cash – that's where the central bank has to step in. The Riksbank states that if that usage of cash in a stop in near future, the function of the central bank in Sweden provides another solution that people accept to pay in another payment style. If cash is no longer an accepted means of payment, the central bank has the task of providing an alternative." Roden (2018).
2.2.5. USA
Cox (2017) mentions in his article that as the price of the cryptocurrency popularity continues to increase, the Federal Reserve has an idea of creating a new cryptocurrency that just likes same coding system with Bitcoin. In New York, William Dudley, who is the CEO of Federal Reserve Bank (FED) William Dudley said that “The Fed is exploring the idea of its own digital currency, according to reports from Dow Jones. It would be very premature to estimate when the Fed would come up with its own offering.” Cox (2017).
Acheson (2018) searches for which companies use Bitcoins. Accepting Bitcoin in stores increase from the beginning of 2017. However, many stores did not look so well in using Bitcoin because of price volatility and many internet sites got transactions fees. Despite these incidents, you can still buy a wide range of goods and services with Bitcoin. One example is flight and hotel agencies which are Expedia, CheapAir and Surf Air. One of the multinational
technology company Microsoft accepts bitcoin in its app stores that you can download music, movies, games. Some musicians (Bjork, Imogen Heep) will let you download their music in exchange for the cryptocurrency.
3. Data and Methodology
3.1. Data Collection
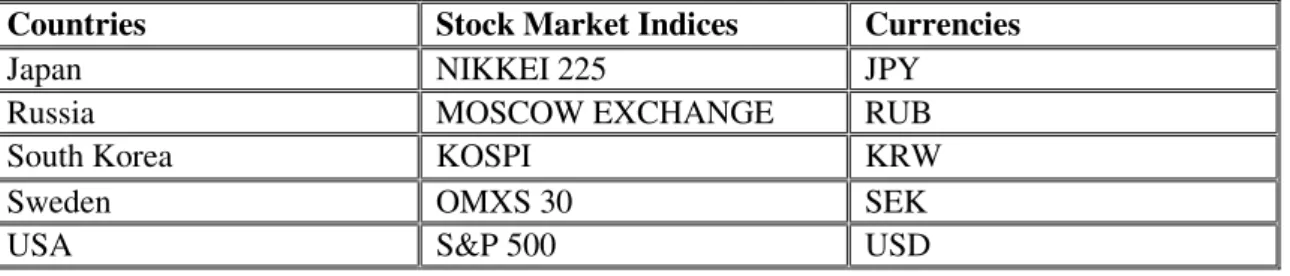
For our analysis we use Augmented-Dickey Fuller, Johansen Cointegration, Lagrange Multiplier (Autocorrelation) and Granger Causal relationships, the daily closing prices for the following indices: In Japan, we choose Nikkei Index (Nikkei 225) which is a stock index for the Tokyo Stock Exchange and the currency in Japanese Yen (JPY). The biggest exchange group in Russia is Moscow Exchange, the currency in Russian Ruble (RUB). The Korea Composite Stock Price Index (KOSPI) is a very typical stock market index in South Korea. It is including all common shares on the Korea Stock Exchange and the currency in South Korea Won (KRW). The OMX Stockholm 30 (OMXS 30) stock market index for Stockholm Stock Exchange is selected to represent Sweden. The last one we choose Standard & Poor´s 500 Index (S&P 500) for the United States and the currency in U.S. dollar.
Countries Stock Market Indices Currencies
Japan NIKKEI 225 JPY
Russia MOSCOW EXCHANGE RUB
South Korea KOSPI KRW
Sweden OMXS 30 SEK
USA S&P 500 USD
Table 1: Stock Market Indices in 5 Different Countries
The analyze time-period cover 5 years from 1st January 2013 to 31st December 2017. The study examines 1304 observations in daily data for all variables which are collected from DataStream. Since the price of bitcoin is U.S. dollar, we change different local currencies with the exchange rate to U.S. dollar for the empirical procedure. In order to reduce the potential effects of heteroscedasticity, we convert data into logarithm form. All the empirical procedure is applying by using Eviews 8.
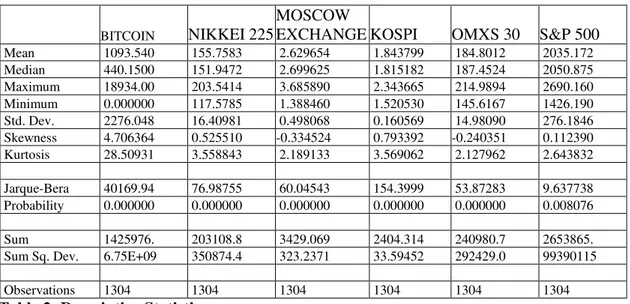
BITCOIN NIKKEI 225
MOSCOW
EXCHANGE KOSPI OMXS 30 S&P 500 Mean 1093.540 155.7583 2.629654 1.843799 184.8012 2035.172 Median 440.1500 151.9472 2.699625 1.815182 187.4524 2050.875 Maximum 18934.00 203.5414 3.685890 2.343665 214.9894 2690.160 Minimum 0.000000 117.5785 1.388460 1.520530 145.6167 1426.190 Std. Dev. 2276.048 16.40981 0.498068 0.160569 14.98090 276.1846 Skewness 4.706364 0.525510 -0.334524 0.793392 -0.240351 0.112390 Kurtosis 28.50931 3.558843 2.189133 3.569062 2.127962 2.643832 Jarque-Bera 40169.94 76.98755 60.04543 154.3999 53.87283 9.637738 Probability 0.000000 0.000000 0.000000 0.000000 0.000000 0.008076 Sum 1425976. 203108.8 3429.069 2404.314 240980.7 2653865. Sum Sq. Dev. 6.75E+09 350874.4 323.2371 33.59452 292429.0 99390115 Observations 1304 1304 1304 1304 1304 1304 Table 2: Descriptive Statistics
At the above graph, there is a summary of descriptive statistics for the selected variables. 1304 daily observations of all the variables have been examined to estimate the following statistics. The mean describes the average value in the series and Std. Deviation measures the dispersion or spread of the series. The maximum and minimum statistics measures upper and lower bounds of the variables under study during our chosen time span.
BITCOIN NIKKEI 225
MOSCOW
EXCHANGE KOSPI OMXS 30 S&P 500 BITCOIN 1.000000 0.689224 0.351988 0.672318 0.160584 0.617101 NIKKEI_225 0.689224 1.000000 0.350171 0.612759 0.024949 0.931165 KOSPI 0.672318 0.612759 0.500337 1.000000 0.575774 0.542687 MOSCOW 0.351988 0.350171 1.000000 0.500337 0.105504 0.267584 OMXS30 0.160584 0.024949 0.105504 0.575774 1.000000 -0.067368 S_P_500 0.617101 0.931165 0.267584 0.542687 -0.067368 1.000000 Table 3: Correlation of Stocks and Bitcoin
In order to avoid spurious regression, we need to make sure variables are stationary during the procedure. Four main econometric models are conducted in this study: Augmented Dickey-Fuller to determine whether a unit root, a feature that can cause issues in statistical inference, is present in an autoregressive model. Secondly, Lagrange Multiplier (LM) test checking autocorrelation. Thirdly, Johansen Cointegration test whether the procedure exists cointegrating vector or not. The last step, Granger Causality test to examine the relationship between individual stock market indices variables and bitcoin.
3.2. Augmented Dickey-Fuller Test
It is important to detect series stationary status when we analyze the relationship between bitcoin and stock market indices. Clearly, non-stationary will have an effect on the process and will result in spurious regression results. When there is an indication of a non-stationary or unit root test, it is necessary to conduct a formal unit root significance test which is an Augmented Dickey-Fuller test. We will perform Augmented Dickey-Fuller test (1979) in the first step for testing unit roots.
H0: δ =0, non-stationary process H1: <0, stationary process ∆ 𝑡=∝ + +δ 𝑡− + ∑ φ∆ 𝑡− 𝑃 = + : = 𝐹𝑖 𝑖 ; = ; = ; = Error term; = 𝑖 𝑖 𝑖 𝑖 𝑖 ; = 𝑖 .
The null hypothesis implies there exist unit roots and series are non-stationary. However, the alternative hypothesis is no unit roots and series are stationary. If δ is equal to zero, then we cannot reject the null hypothesis, we conclude there has a unit root and it is a non-stationary process. This implies to do the Johansen test for the next step. If the coefficient δ is less than zero, then the null hypothesis that y contains a unit root is rejected. Rejection of the null hypothesis denotes stationarity in the series.
3.3. Lagrange Multiplier-Autocorrelation Test
For checking autocorrelation, we use Lagrange Multiplier (LM) test. This test results can be used to check whether the residuals are autocorrelation or not. The null hypothesis is no autocorrelation up to the specified lag, but the alternative hypothesis is existing autocorrelation up to the specified lag. According to Evans and Patterson (1985), based on the requirements, if the p-values of t-statistic are higher than 5 percent critical p-value, we cannot reject the null hypothesis. Hence, there is no autocorrelation between variables.
H0: ρ = 0, there is no autocorrelation H1: ρ ≠ 0, there is autocorrelation
𝑡 = + 𝑡+ ⋯ + 𝑝 𝑝𝑡+ 𝑡 𝑖 ℎ 𝑡 = 𝜌 𝑡− + 𝜌 𝑡− + ⋯ + 𝜌𝑝 𝑡−𝑝+ 𝜖𝑡 ℎ , 𝑡 = + 𝑡+ ⋯ + 𝑝 𝑝𝑡+ 𝜌𝑝 𝑡−𝑝+ 𝜖𝑡 ;
𝑡
̂ = 𝑡− ̂ − ̂ 𝑡− ⋯ − ̂𝑝 𝑝𝑡
Here: 𝑡= time series vector at time t; 𝑡=error term; =estimated coefficients.
3.4. Johansen Cointegration Test
We can’t perform non-stationary data in the regression model because it will cause spurious regression. Whether the variables are stationary or not, this does not imply they are cointegration or not. In the beginning, Engle and Granger (1987) mentioned two-step procedure for the testing cointegrated relationship between variables, Johansen and Juselius (2009) pointed out eigenvalue statistics and trace test later. The VAR model with order: P
𝑡 = + ∅ 𝑡− + ∅ 𝑡− + ⋯ + ∅𝑝 𝑡−𝑝+ 𝑡
Here: 𝑡= time series vector at time t; =vector-valued mean of series; P=lag number; ∅ = coefficient matrices for each lag; 𝑡 = 𝑖 𝑖 ℎ .
The equation can be written in this form:
∆ 𝑡= + +Γ ∆ 𝑡− + ⋯ + Γ𝑝∆ 𝑡−𝑝+ 𝛱 𝑡− + 𝑡
Here:. ∆ 𝑡 = 𝑡− 𝑡− 𝑖 ℎ 𝑖 𝑖 ; 𝛱=the matrices of parameters; =
∅ ∅ … ∅𝑝. 𝛱 𝑡− = 𝑖 .
The Johansen Cointegration test is to estimate the rank of 𝛱 which is the maximum number of independent vectors. Here are three following conditions.
1, if rank (𝛱 =0, there is no cointegration
2, if rank (𝛱 =n (full rank), there are all the variables are stationary.
3, if 0< rank (𝛱 = < less than full rank , there are r independent cointegration relationship.
Therefore, the hypothesizes are assumed to be as follow: H0: there is no cointegrating vector
The null hypothesis is no cointegrating relationship among variables. If the statistic value of Maximum Eigenvalue test and Trace Test is higher than the critical value (at 5 percent), then we can reject the null hypothesis of no cointegration. This implies we can find cointegration relationship and exhibit a long-run relationship between variables. However, If the statistic value of Maximum Eigenvalue test and Trace Test is less than the critical value (at 5 percent), we cannot reject the null hypothesis. During the empirical procedure, cointegration test should be performed by using level data instead of using first difference data. Moreover, if variables have same integrated of order, we will perform Johansen test for examining the cointegrating relationship between variables. If the series are cointegrated, there exhibit a long-run relationship.
3.5. Granger Causality Test
After performing Johansen Cointegration test, the Granger causality test can be used to determining whether one-time series is significant in forecasting another or not (Granger, 1969). Basically, it seeks to question that how variable or variables for example (x1) is determined another variable or variables (x2). If x1 does not cause x1, then x2 does not help to determine x1. Granger causality measures precedence and information content but does not by itself indicate causality in the more common use of the term. The application of Granger causality assumes that the analyzed signals are covariance stationary. Non-stationary data can be treated by using a windowing technique (Hesse et al. 2003) if sufficiently short windows of a non-stationary signal are locally stationary.
We apply Toda and Yamamoto (1995) procedure for Granger Causality Test. Since the method of Toda and Yamamoto Model is works regardless data are cointegrated or not. This means even if variables do not have same integrated of order which is not cointegrated, we can still perform Toda and Yamamoto (1995) method.
The process of applying Toda Yamamoto model is shown in the following steps. To begin with, we need to decide the order of integration for each time series with ADF test. Then, we are required to choose the maximum order of integration for each group, we set up this order as m. In the third step, we need to establish VAR model by using level data instead of using first difference data. Fourthly, the appropriate maximum lag length for the variables need to be determined in the VAR model. To deal with this problem, we followed the information
criteria AIS, SIC and HQ to choose the lag length. After that, if we need to test variables are autocorrelation or not, we can use LM test. Moreover, if time series have the same order of integration, we use Johansen methodology to test if variables are cointegrated. After finishing all above steps, with the help of AR root graphs we can test for dynamic stability by checking if all inverse roots are within the unit circle. Later, we re-estimate the level of VAR by adding extra 1 lag in the equations for each variable. In the end, we need to test Granger Causality for variables.
: = = ⋯ = = 0 or ∅ = ∅ = ⋯ = ∅ = 0, there is no causality : = = ⋯ = ≠ 0 or ∅ = ∅ = ⋯ = ∅ ≠ 0, there is causality EViews runs bivariate regressions of the form:
𝑡 = + ∑ 𝑡− = + ∑ 𝑡− = + 𝑡 𝑡 = + ∑ 𝑡− = + ∑ ∅ 𝑡− = + 𝑡 : 𝑡, 𝑡 = 𝑖 𝑖 𝑖 ; 𝑡, 𝑡 = 𝑖 ; , = .
Here we can set 𝑡 is the log of bitcoin price, and 𝑡 is logs of stock market indices including OMX Stockholm 30 index (LOMXS30), Nikkei 225 index (LNIKKEI225), Moscow Exchange index (LMOSCOW), Standard & Poor´s 500 indexes (LS_P500), Korea Composite Stock Price index (LKOSPI). The null hypothesis for the first equation is bitcoin price does not Granger-Cause stock market indices. Moreover, the null hypothesis for the second equation is stock market indices does not Granger-Cause bitcoin price.
4. Empirical Results
LBIT Logarithm function of Bitcoin
LNIKKEI225 Logarithm function of Nikkei 225 Index LMOSCOW Logarithm function of Moscow Exchange Index LKOSPI Logarithm function of Korea Composite Stock
Index
LOMXS30 Logarithm function of Stockholm 30 Index LS_P500 Logarithm function of Standard & Poor’s Index
4.1. Unit Root Test Results
Variables Null Hypothesis P-Value
Choice (5% significant level)
Results
Bitcoin LBIT contains at least one-unit
root (not stationary) 0.8200 Do not Reject
LBIT is not stationary Japan LNIKKEI 225 contains at least
one-unit root (not stationary) 0.0781 Do not Reject
LNIKKEI 225
is not
stationary
Russia LMOSCOW contains at least
one-unit root (not stationary) 0.3810 Do not Reject
LMOSCOW is not stationary South Korea LKOSPI contains at least
one-unit root (not stationary) 0.5939 Do not Reject
LKOSPI is not stationary Sweden LOMXS30 contains at least
one-unit root (not stationary) 0.1918 Do not Reject
LOMXS30 is not stationary United States LS_P500 contains at least
one-unit root (not stationary) 0.0688 Do not Reject
LS_P500 is not stationary
Table 5: Unit Root Test Results at level
We perform all ADF tests at level by using 5 years data. Here, LBIT, LOMXS30, LNIKKEI225, LMOSCOW, LS_P500, LKOSPI are the logs of bitcoin and OMX Stockholm 30 index, Nikkei 225 index, Moscow Exchange index, Standard & Poor´s 500 indexes and Korea Composite Stock Price index respectively. According to the Augmented Dickey-Fuller test (1979) for testing unit roots, we know that the null hypothesis is existing unit roots in series and the alternative hypothesis is no unit roots in series. By looking at the results, it appears that the p-values for all the included variables in our research are greater than the critical value (5%). So, we cannot reject the null hypothesis and we must, therefore, conclude that all six variables which are growing are non-stationary, meaning that those variables follow a random walk with drift and no time trend. This implies that we need to take the first difference of those variables before they can be run in the regression model.
Variables Null Hypothesis P-Value
Choice (5% significant level)
Results
Bitcoin LBIT contains at least one-unit
root (not stationary) 0.0000 Reject
LBIT is
stationary Japan LNIKKEI 225 contains at least
one-unit root (not stationary) 0.0001 Reject
LNIKKEI 225 is stationary
Russia LMOSCOW contains at least
one-unit root (not stationary) 0.0000 Reject
LMOSCOW is
stationary
Sweden LOMXS30 contains at least
one-unit root (not stationary) 0.0000 Reject
LOMXS30 is
stationary South Korea LKOSPI contains at least
one-unit root (not stationary) 0.0000 Reject
LKOSPI is
stationary United States LS_P500 contains at least
one-unit root (not stationary) 0.0000 Reject
LS_P500 is
stationary
We perform all ADF tests at first difference by using 5 years data. As we can see from the results, all the p-values are smaller than the critical value (5%), we can reject the null hypothesis which is there exist unit roots and series are non-stationary. Therefore, the results of ADF test at first difference implies that all variables are stationary. Since stationary properties are proved by ADF test, Johansen cointegration test can be performed to test if the variables exhibit long-run relationships in their first differences.
4.2. Serial Correlation LM Test Result
Countries Variable Null Hypothesis
P-Value Choice (5% significant level) Results of autocorrelation Japan LNIKKEI225, LBIT No autocorrelation up
to the specified lag 0.3159
Do not
Reject No
Sweden LOMXS30,
LBIT
No autocorrelation up
to the specified lag 0.2423
Do not
Reject No
Russia LMOSCOW,
LBIT
No autocorrelation up
to the specified lag 0.3501
Do not Reject No United States LS_P500, LBIT No autocorrelation up
to the specified lag 0.6900
Do not
Reject No
South
Korea LKOSPI, LBIT
No autocorrelation up
to the specified lag 0.1530
Do not
Reject No
Table 7: Results of LM-Autocorrelation Test
We perform all LM tests by using 5 years data. We use Serial Correlation LM test for diagnostic checking autocorrelation. The null hypothesis is no autocorrelation up to the specified lag for variables, the alternative hypothesis is autocorrelation up to the specified lag for variables. From this results table, all the p-values are higher than the critical value (5%). Based on this situation, we cannot reject the null hypothesis. Therefore, there is no autocorrelation between variables. According to this test results, there is no serial correlation in the error term, we can perform the Johansen cointegration test for the next step.
4.3. Johansen Cointegration Test Results
Count
ries Series Test
Hypothesi zed No. of CE (s) Trace statistic/ Max-Eigen Statistic 5% critical value Prob.* * Cointe gration Japan LBIT LNIKK EI225 Maximum Eigenvalue None 13.78054 11.22480 0.0174 YES At most 1 0.227701 4.129906 0.6910
Trace test None 14.00824 12.32090 0.0258 YES
At most 1 0.227701 4.129906 0.6910 Table 8: Johansen Cointegration Test of Japan
The time span last 5 years is from 1st January 2013 to 31st December 2017. The second time period last 1 year is in 2017 and the last three months is from 1st October 2017 to 31st
December 2017. If the p-values are higher than 0.05 (critical value), the null hypothesis cannot be rejected. Therefore, one variable does not Granger causality another variable need to be accepted.
After checking for autocorrelation, we perform all Johansen Cointegration tests by using 5 years data. The null hypothesis is no cointegration between variables and the alternative hypothesis is existing cointegration between variables. The results are shown on the above table, we can see that the statistic value of both Trace test (14.00) and Maximum eigenvalue test (13.78) are greater than 12.32 and 11.22 (5 percent critical value). We can reject the null hypothesis based on the requirements, so there is existing cointegration between bitcoin and Nikkei 225 index in Japan. This indicates a long-run relationship between these two variables. In addition, Toda Yamamoto model works no matter variables are cointegrated or not, it will not affect the next step.
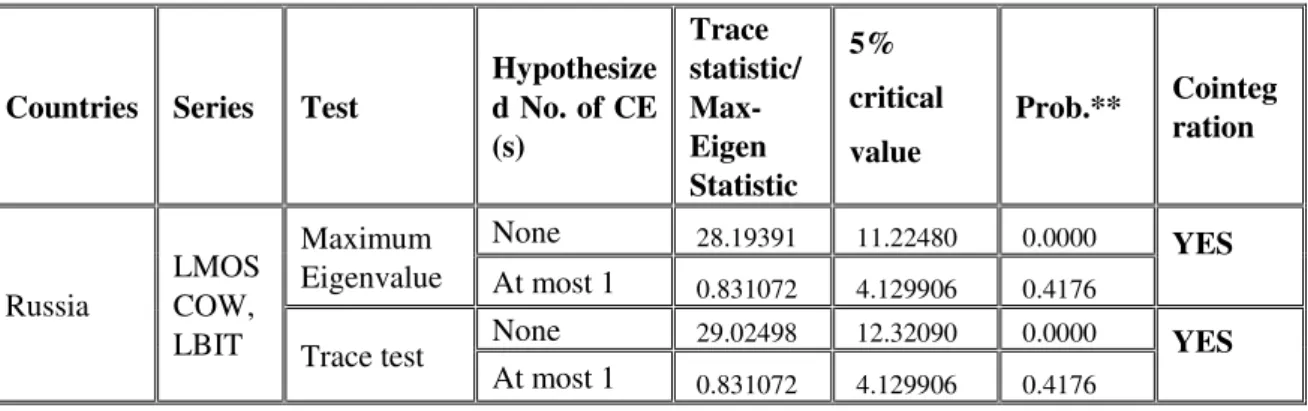
Countries Series Test
Hypothesize d No. of CE (s) Trace statistic/ Max-Eigen Statistic 5% critical value Prob.** Cointeg ration Russia LMOS COW, LBIT Maximum Eigenvalue None 28.19391 11.22480 0.0000 YES At most 1 0.831072 4.129906 0.4176
Trace test None 29.02498 12.32090 0.0000 YES At most 1 0.831072 4.129906 0.4176
Table 9: Johansen Cointegration Test of Russia
In Russia, we find the statistic value of Maximum Eigenvalue test is 28.19 which is higher than 11.22 (5 percent critical value). Moreover, the statistic value of the Trace test is 29.02 that higher than 12.32(5 percent critical value) as well. The null hypothesis of no cointegration can be rejected, there is existing cointegration between bitcoin and Moscow Exchange in Russia. It is worth to mention that Toda Yamamoto model works no matter variables are cointegrated or not. Hence, this will not affect our analysis.
Countries Series Test
Hypothesize d No. of CE (s) Trace statistic/ Max-Eigen Statistic 5% critical value Prob.** Cointeg ration South Korea LBIT, LKOS PI Maximum Eigenvalue None 27.27386 19.38704 0.0029 YES At most 1 1.553887 12.51798 0.9893
Trace test None 28.82775 25.87211 0.0208 YES At most 1 1.553887 12.51798 0.9893
Table 10: Johansen Cointegration Test of South Korea
In this case, all the statistic values of Trace test (28.83) and Maximum Eigenvalue test (27.27) are higher than 25.87 and 19.39 (5 percent critical value) respectively. Hence, we can reject the null hypothesis of no cointegration between variables. We can conclude that there is cointegration between bitcoin price and KOSPI stock index in South Korea. This implies a long-run relationship for bitcoin and KOSPI stock index. As we mentioned before, Toda Yamamoto model works regardless of variables are cointegrated or not.
Countries Series Test
Hypothesi zed No. of CE (s) Trace statistic/ Max-Eigen Statistic 5% critical value Prob.* * Cointeg ration Sweden LOMX S30, LBIT Maximum Eigenvalue None 12.27762 11.22480 0.0325 YES At most 1 0.003567 4.129906 0.9602
Trace test None 12.28118 12.12090 0.0498 YES At most 1 0.003567 4.129906 0.9602
Table 11: Johansen Cointegration Test of Sweden
Based on the results, we find that statistic value of Maximum Eigenvalue test (12.27) is greater than 11.22 (5 percent the critical value), and the statistic value of Trace test (12.28) is higher than 12.12(5 percent the critical value). So, the null hypothesis can be rejected in the case of Sweden, we can find cointegration between bitcoin and OMXS 30 stock index This implies a long-run relationship for bitcoin and OMXS 30 stock index.
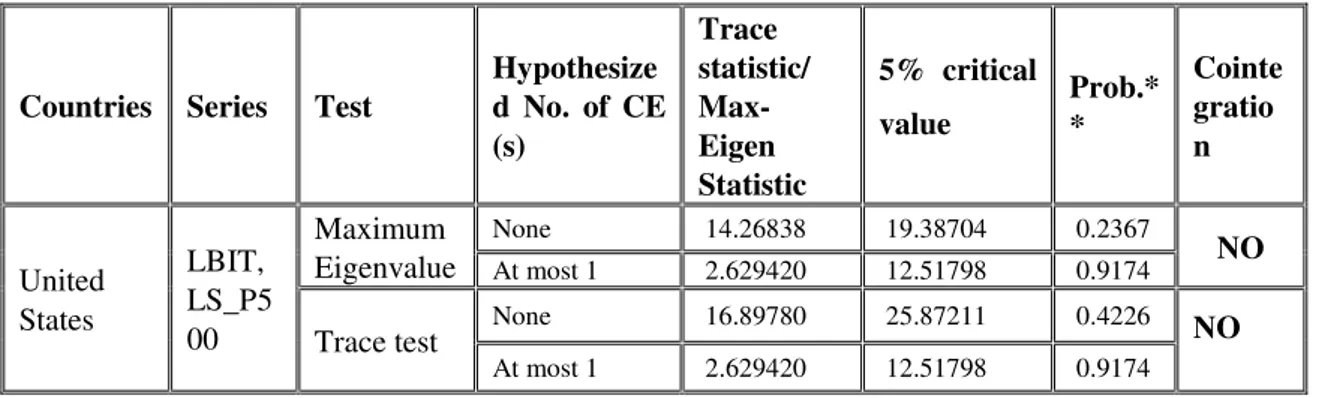
Countries Series Test
Hypothesize d No. of CE (s) Trace statistic/ Max-Eigen Statistic 5% critical value Prob.* * Cointe gratio n United States LBIT, LS_P5 00 Maximum Eigenvalue None 14.26838 19.38704 0.2367 NO At most 1 2.629420 12.51798 0.9174
Trace test None 16.89780 25.87211 0.4226 NO
At most 1 2.629420 12.51798 0.9174 Table 12: Johansen Cointegration Test of United States
The cointegration results of United States imply that no cointegration can be found between bitcoin price and S&P 500 stock index. Due to both statistic values of Maximum Eigenvalue test (14.27) and Trace test (16.90) is less than 25.87 and 19.39 (5 percent the critical value)
respectively. We are failing to reject the null hypothesis of no cointegration, so there is no cointegration between these two variables.
4.4. Granger Causality Results
Time Null hypothesis(H0) Prob.
Choice (5% significant level) Results Direction of Causality Last 5 years
LNIKKEI225 does not
Granger Cause LBIT 0.8080 Accept H0
LNIKKEI225 does not
Granger Cause LBIT No Granger Causality LBIT does not Granger
Cause LNIKKEI225 0.1153 Accept H0
LBIT does not Granger Cause LNIKKEI225
Last 1 Year
LNIKKEI225 does not
Granger Cause LBIT 0.7917 Accept H0
LNIKKEI225 does not Granger Cause LBIT
LBIT LNIKKEI22 5
LBIT does not Granger
Cause LNIKKEI225 0.0361 Reject H0
LBIT does Granger Cause LNIKKEI225
Last 3 Months
LNIKKEI225 does not
Granger Cause LBIT 0.8286 Accept H0
LNIKKEI225 does not
Granger Cause LBIT No Granger Causality LBIT does not Granger
Cause LNIKKEI225 0.0587 Accept H0
LBIT does not Granger Cause LNIKKEI225
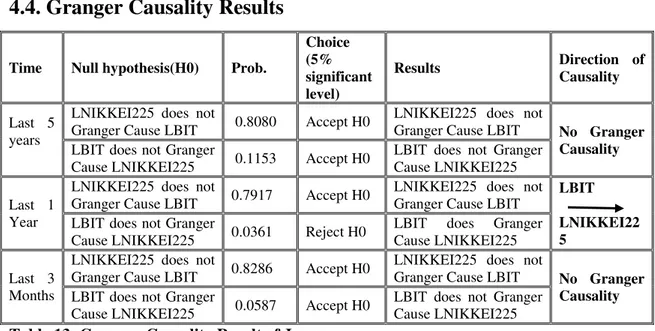
Table 13: Granger-Causality Result of Japan Denotes the unidirectional causality.
According to the requirements, we find that no Granger causality between NIKKEI 225 stock index and bitcoin price for last 5 years and for last 3 months. The reason is p-values are higher than 0.05, we cannot reject the null hypothesis. We find no Granger Causality relationship between these two variables. However, a unidirectional Granger Causality which is bitcoin price Granger-cause NIKKEI 225 stock index but not vice versa for last 1 year.
Time Null hypothesis(H0) Prob.
Choice (5% significant level) Results Direction of Causality Last 5 years
LMOSCOW does not
Granger Cause LBIT 0.0781 Accept H0
LMOSCOW does not
Granger Cause LBIT No Granger
Causality LBIT does not Granger
Cause LMOSCOW 0.7532 Accept H0
LBIT does not Granger Cause LMOSCOW
Last 1 Year
LMOSCOW does not
Granger Cause LBIT 0.1187 Accept H0
LMOSCOW does not
Granger Cause LBIT No Granger
Causality LBIT does not Granger
Cause LMOSCOW 0.8883 Accept H0
LBIT does not Granger Cause LMOSCOW
Last 3 Mont hs
LMOSCOW does not
Granger Cause LBIT 0.3837 Accept H0
LMOSCOW does not
Granger Cause LBIT No Granger
Causality LBIT does not Granger
Cause LMOSCOW 0.6148 Accept H0
LBIT does not Granger Cause LMOSCOW
Denotes the unidirectional causality.
As is shown above, the empirical results find all statistic p-values are higher than 5% (critical value). Therefore, we cannot reject the null hypothesis of no granger causality. We get the conclusion of no Granger Causality between Moscow stock index and bitcoin price for last 5 years, last 1 year and last 3 months in Russia.
Table 15: Granger-Causality Result of South Korea Denotes the unidirectional causality.
South Korea: The empirical results find no Granger causality between KOSPI stock index and bitcoin price for last 5 years and last 1 year. Nevertheless, the results find unidirectional Granger Causality between two of these variables. That is bitcoin price does Granger Cause
KOSPI stock index but not vice versa for last 3 months in 2017. Table 16: Granger-Causality Result of Sweden
Time Null hypothesis(H0) Prob.
Choice (5% significant level) Results Direction of Causality Last 5 years
LKOSPI does not
Granger Cause LBIT 0.4800 Accept H0
LKOSPI does not Granger
Cause LBIT No Granger
Causality LBIT does not Granger
Cause LKOSPI 0.1283 Accept H0
LBIT does not Granger Cause LKOSPI
Last 1 Year
LKOSPI does not
Granger Cause LBIT 0.5047 Accept H0
LKOSPI does not Granger
Cause LBIT No Granger
Causality LBIT does not Granger
Cause LKOSPI 0.3769 Accept H0
LBIT does not Granger Cause LKOSPI
Last 3 Months
LKOSPI does not
Granger Cause LBIT 0.4354 Accept H0
LKOSPI does not Granger
Cause LBIT LBIT
LKOSPI LBIT does not Granger
Cause LKOSPI 0.0435 Reject H0
LBIT does Granger Cause LKOSPI
Time Null hypothesis(H0) Prob.
Choice (5% significant level) Results Direction of Causality Last 5 years
LBIT does not Granger
Cause LOMXS30 0.7368 Accept H0
LBIT does not Granger
Cause LOMXS30 No Granger
Causality LOMXS30 does not
Granger Cause LBIT 0.5087 Accept H0
LOMXS30 does not
Granger Cause LBIT
Last 1 Year
LBIT does not Granger
Cause LOMXS30 0.4998 Accept H0
LBIT does not Granger
Cause LOMXS30 No Granger
Causality LOMXS30 does not
Granger Cause LBIT 0.1692 Accept H0
LOMXS30 does not
Granger Cause LBIT
Last 3 Months
LBIT does not Granger
Cause LOMXS30 0.1438 Accept H0
LBIT does not Granger
Cause LOMXS30 LOMXS30
LBIT LOMXS30 does not
Granger Cause LBIT 0.0099 Reject H0
LOMXS30 does Granger Cause LBIT
Denotes the unidirectional causality.
In the case of Sweden, the empirical results find no Granger causality between OMXS 30 stock index and bitcoin price for last 5 years and for last 1 year. However, the results find a unidirectional Granger causality which is OMXS 30 stock index granger cause bitcoin price but not vice versa for last 3 months.
Time Null hypothesis(H0) Prob.
Choice (5% significant level) Results Direction of Causality Last 5 years LS_P500 does not
Granger Cause LBIT 0.2762 Accept H0
LS_P500 does not Granger
Cause LBIT LBIT
LS_P500 LBIT does not Granger
Cause LS_P500 0.0295 Reject H0
LBIT does Granger Cause LS_P500
Last 1 Year
LS_P500 does not
Granger Cause LBIT 0.5300 Accept H0
LS_P500 does not Granger
Cause LBIT LBIT
LS_P500 LBIT does not Granger
Cause LS_P500 0.0102 Reject H0
LBIT does Granger Cause LS_P500
Last 3 Months
LS_P500 does not
Granger Cause LBIT 0.7522 Accept H0
LS_P500 does not Granger
Cause LBIT LBIT
LS_P500 LBIT does not Granger
Cause LS_P500 0.0043 Reject H0
LBIT does Granger Cause LS_P500
Table 17: Granger-Causality Result of United States Denotes the unidirectional causality.
USA: The empirical results find unidirectional Granger Cause for these two variables. The causality direction is bitcoin price Granger Cause S&P 500 stock index but not vice versa for last 5 years, last 1 year and last 3 months. It means that bitcoin price is leading S&P 500 stock index in the United States for the analysis time-period.
5. Conclusion and Discussion
In our thesis, we analyze the causality relationship between bitcoin and 5 different stock market indexes which are Japan, Russia, South Korea, Sweden and the United States. We apply four tests to see any causality. With the Granger Causality test, we can conclude results and you can see the next paragraph.
From last 5 years, the empirical results find no Granger causality between stock index and bitcoin price in Japan, Sweden, Russia and South Korea, except the United States. For last 1 year, the empirical results find no Granger causality between stock index and bitcoin price in Sweden, Russia and South Korea. Moreover, the results show that unidirectional Granger Cause between two variables in Japan and United States. First causality direction is bitcoin price Granger Cause stock price but not vice versa in Japan. However, the second causality