ISSN 0347-5049
VTIsärtryck
__702 1.985
Amplifier Control Panel Monitor
Vertical
Power Supply
Laser Electronics
Computer Printer
Floppy Disc Drives Pulse Transducer Laser Units
The Laser Road Surface Tester (RST)
Peter W Arnberg
Presented in Washington, D. C. April 22, 7985 at the
Turner-Fairbank Highway Research Center
Veg-och ail/F "
Statens väg och trafikinstitut (VTI) . 581 01 Linköping
ISS/V 0347-6049
VTIsärtryck
102
1985
The Laser Road Surface Tester (RST)
Peter W Arnberg
Presented in Washington, D. C. April 22, 7985 at the Turner
Fairbank Highway Research Center
Vag- 00/1 afllf- Statens väg- och trafikinstitut (VTI) . 581 01 Linköping
1 INTRODUCTION
More than two thousand years ago the Roman Empire was in the process of expanding over the entire known world. In order to be able to conquor new territories as well as to maintain existing ones, a road network was
constructed which served them well. Since that time much has been
learned about the construction of roads. The stone roads built before the time of Christ were of course primitive in comparison with the smooth and paved surfaces of today's roads. One thing has not changed, however,
and this concerns the urgent need for inspecting and maintaining the
road surface. Just as was probably done during the time of the Roman Empire, even today, it is frequently the case that an inspector manually
inspects the road surface in order to investigate areas potentially requiring maintenance (see Figure 1). These inspections are Optimally
standardized to as great an extent as possible in order to avoid subjectivity and, consequently, lack of measurement reliability.
r, .
Nevertheless, the task of manually inspecting the road surface is not one
which is particularly well-suited to man. Man of today is not genetically
unlike man of the stone age. For example, perception in man is well developed with regard to tasks requiring the comparison of aspects of
light movement, important in activities such as hunting in order to be
able to see animals against a background. On the other hand, memory for the comparison of one perception with another, experienced at some other point in time, is poorly developed in man. In other words, man is poorly developed in terms of absolute perceptual judgments although rather well developed in terms of comparative perceptual judgments.
Thus, the abilities of man are best utilized in surveying and controlling
objective systems which are in turn themselves responsible for the
carrying out of the absolute judgments. The subjective assessment of
road parameters will thus always remain difficult, and further develop-ments in this area are likely to only lead to a dead end. It is thus vital
that attention instead be directed toward the development of
instru-ments for the objective evaluation of road surfaces and that this be carried out as soon as possible so that the arduous task of making these instruments as precise and reliable as possible can be begun.
2 THE LASER ROAD SURFACE TESTER
The Laser Road Surface Tester (RST) is an objective system designed for
the measurement of road surfaces. It is also a component in several
larger more comprehensive systems governing road maintenance (see
earlier presentation by Hedman 1985, see also Land et al., 1985). The system has been deveIOped by the author at the Swedish Road and Traffic Research Institute (VTI) and is financed by the Swedish National Road Administration, Swe Road, RST International and various research grants from VTI. The development of the system would not have been possible, however, without the individual efforts of members of the research team who often worked on an entirely voluntary basis.
In general, system development in the road measurement area in the past
has consisted mainly of equipment design. As the equipment developed was often rather unsophisticated, little attention was given to the development of a user interface. Computer technology, however, has made it possible to design and develop highly sophisticated systems, many of which are purposely designed with user needs such as facility of use and information quality in mind. Such systems, like the RST system, are often highly comprehensive, covering the total range of activities
from data registration and initial evaluation to data base management
systems for the decision-maker. In order for such comprehensive systems to function from a technical, human, and social point of view, extensive interdisciplinary cooperation is essential. In addition to traditional desciplines representing the technical area, the team needs to be enhanced with experts on the functioning of the human. It must also include persons skilled in helping to solve problems related to the integration of the system into society, thus including not only techni-cans, researchers, and decision-makers, but also businessmen and lawyers.
2.1 How the Laser RST functions
The Laser RST vehicle is a measurement system based upon the principle of non-contact laser sensing of the road surface (see Figures 2, 3 and 4). Continuous analysis and presentation of data is provided in the car during the measurement process. The measurements can be carried out at a maximum speed of 90 km/h. The measurements are traffic-safe and objective. They are obtained at a low cost due to the high speed at which they are carried out as well as the fact that all variables are measured simultaneously. An additional contributing factor to the low
measure-ment costs is the vehicle's high durability. For example, VTI has had the
car in function for nearly four years, and during this time few of the eleven laser cameras have required any maintenance. The computer has
never been out of order. The few problems occurring have been mainly
related to the electrical system; furthermore, these have occurred
during special measurements which were carried out at unusually low
speeds.
The faser lfghpsp er on the road surfase is mej»
er:-tad on a !;thtusensffive displacement sensor.
Eiactffcai Signals fepfessn:*be varma! position
and flight fatensity of the laser spot are recorded
and computerfpmcessed.
Figure 3 The first Laser RST built at the Swedish Road and Traffic
Research Institute in 1981. Notice the angled out lasers on
the sides of the vehicle which increase the measurement
range without making the car's width greater than that of a
normal truck.
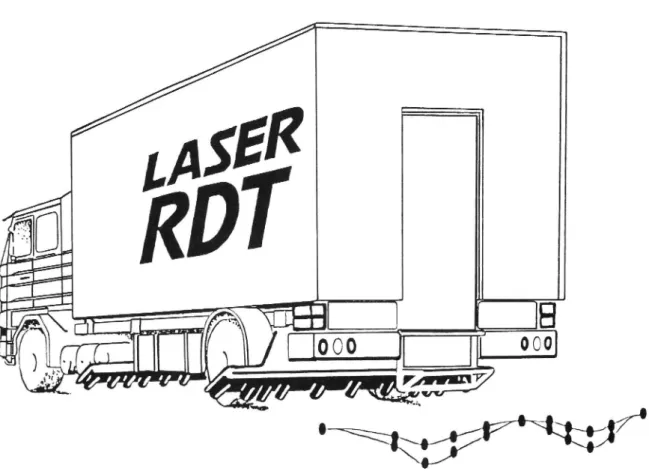
A more recent version of the RST. This car has been used in the United States for nearly two years without any major problems.
2.2 Measurement variables
Originally, the RST measured rut depth, road roughness, distance, as well
as registering three subjective variables. The car has now been expanded
to measure six objective variables. In addition to the variables mentioned above, the RST now measures cracks, rough and fine macrotexture, and
friction (when the skidometer BVll is connected to the vehicle).
The presentation of the measurement variables can be adapted according to measurement purposes and customer needs. As the software is on floppy disks, new programs can easily be added by simply inserting a different program disk. New programs can be sent by mail and used immediately by the operator. Consequently, it is easy to adapt the output to any specific purpose at hand by carrying different programs in the car. This flexibility principle underlies a basic philosophy of the RST system. The hardware has been designed to serve as general a function as possible. The exact purpose which the RST will serve thus depends on the software used. In this way continuous development is of importance to adjust the system to any specific user group, e.g., comfort measurements
might have to be exchanged with quartercar simulation in the U.S.
measurements.
The individual measurement variables are described in greater detail
below.
2.2.1 Rut depth
The most important measurement variable is rut depth. The rut depth values are now (in most programs) determined by the differences
between the values from the cameras in the Cross Profile Sampler (CPS) (see Figure 5). A cross profile is produced for every sample and from this a maximum rut depth is calculated. The mean value of the maximum rut
depth for a road unit is presented as well as the percentage of the
maximum rut depths exceeding a certain value, e.g., 10 and 20 mm (see
Figures 6A and GB). For example, in a 100 meter road unit, 20 samples might be taken. This results in one mean value for all samples as well as
the percentage of the individual sample maximum rut depths exceeding the above mentioned figures.
The lateral position of the lasers relative to the ruts may result in a measurement error if the ruts are not flat at the bottom. Normally this measurement error is very small, but on certain roads where the ruts are
very deep, steeply inclined, and where the rut bottom profile varies, the
measurement error may be of importance.
S7
82
Figure 5 Cross profile measurements for samples. The rut depth is
the largest value of Sl, SZ, S3, etc.
Thus, an even larger concentration of laser units in the ruts may be required. It might be sufficient to statistically compensate for the measurement error from the variance of the mean cross profile, in addition to increasing sampling frequency. Simulation and road tests will be carried out in 1985 in order to further investigate this problem.
It would be advisable in future survey programs to calculate more than the maximum rut depth for each profile. Perhaps the width and
maxi-mum depth of each rut or even the whole profile could be stored.
Programs that save entire profiles are already being used for special
purposes. This would create a completely different opportunity to
monitor road deterioration and assess the need for future maintenance
measures. Whole profile measurements showing the variation between
and within the ruts may indicate what is happening in the road body. This type of variation indicates whether there is a bearing capacity problem or "only" wear from studded tires.
Obiect No: Number of measurement object, automatically counted from I to total number of objects
Measured length: Length of object
Road No: Identification of road where measurement was carried out
From: Intersection or other reference point at which distance measure ment starts - "+115 m" - indicates the length from reference point to start of the actual measurement
Towards: Intersection or other reference point towards which measure-ment is heading
Speed: Average speed at which object is measured
Roughness: Serviceability index on a nine-grade scale where "9"
repre-sents a highly uneven road
>6.5: Percentage of object which has a serviceability index greater than 6.5. This limit can easily be changed
Rut depth: Rut depth as measured (see separate sheet for principle)
> mm, > 20 mm: Percentage of object which has a rut depth exceeding 10
respective 20 mm. These limits can easily be changed
Hang, Crack, Wear: Manually registered parameters preented in terms of percentage of occurrence in an object
Figure 6A The output from an early program used in Sweden with
results analyzed continuously by the RST. This car was not provided with crack or macrotexture cameras, however.
/
Figure 68 Graphic presentation can be provided directly from the
floppy disks in order to get a picture of the road network with certain parameters, e.g., rut depth, overlaid.
10
2.2.2 Road roughness
Road roughness is perhaps the most salient variable in the road users' perceptual judgment of the road, i.e., comfort is a highly important road feature. The comfort value probably also correlates highly with many
vibration effects, e.g., damage to transported goods, wear on cars, and extra energy consumption.
The comfort evaluation used in the RST was derived from comfort ratings provided by the results from experimental studies involving a large number of randomly slected road users. The users subjectively evaluated a variety of different roads while riding as passengers in cars,
buses, and trucks (see VTI reports by Magnusson & Arnberg (1976) and
Arnberg (1982) for a complete discussion of the comfort calculation validation procedure.) The RST comfort value correlates highly with other international measures such as the Chloe. It is speed independent
at speeds between 30 and 90 km/h and relatively speed independent at
speeds between 5 and 30 km/h.
At present, road roughness measurements are carried out in both wheel tracks in all programs. Only one mean value per road unit is presented,
i.e., a comfort value where "l" is equivalent to a smooth road and "9" is equivalent to a rough road. It may be preferable in the future to carry
out between track measurements of road roughness. Instead of only providing a comfort value, the signal could also be divided into different wavelength bands. Such an analysis would facilitate a follow up of the changes in the longitudinal profile of the road over time in a better way
than is being provided in existing programs. Some types of changes in the amplitude at certain wavelengths probably indicate bearing capacity problems. It is speculated that the condition of the road structure near
the surface can be determined by the shorter wavelengths while deeper structural problems are indicated by the longer wavelengths. Further development in this area will be completed in 1985.
11
2.2.3 Macrotexture
Macrotexture influences many aspects of road performance. The measurement of macrotexture may facilitate the control and prediction
of problems related to road, tire, vehicle, and driver performance.
In the Laser RST, the macrotexture is described by two measurement
variables: "rough" and "fine". Both parameters are based on longitudinal
profiles of the road. "Rough" macrotexture covers that part of the profile including wavelengths from 10 to 80 mm. "Fine" macrotexture covers wavelengths under 10 mm and is a measurement of the stone content in the pavement surface.
The RST calculates a root mean square (RMS) value for both of the above variables every l meter. These RMS values are grouped into
different classes so that a distribution (based on the RMS value) can be presented. Mean values and classes can also be provided for any road unit (see Figure 7 for a sample printout with explanations, and Figure 8 for
the results from reliability measurements).
Measurements are made in both wheel tracks. In the future, programs
should be developed in order to double this to four profiles, as macro
12
Macrotexture output from Laser RST:
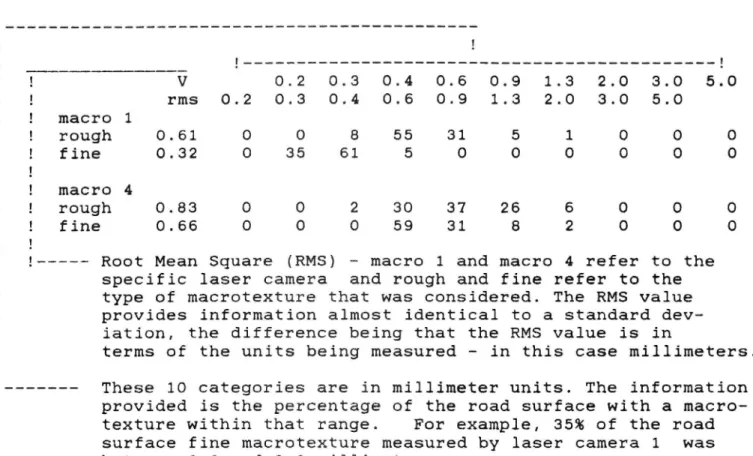
! V 0 2 0.3 0.4 0.6 0.9 1.3 2.0 . ! rms 0.2 0 3 0.4 0.6 0.9 1 3 2.0 3.0 5.0 ! macro 1 ! rough 0.61 0 0 8 55 31 5 1 0 O 0 ! fine 0.32 0 35 61 5 0 0 0 0 O 0 | ! macro 4 ! rough 0.83 0 0 2 30 37 26 6 0 0 0 ! fine 0.66 0 0 O 59 31 8 2 0 0 0 !
! Root Mean Square (RMS) macro 1 and macro 4 refer to the
specific laser camera and rough and fine refer to the
type of macrotexture that was considered. The RMS value provides information almost identical to a standard dev
iation, the difference being that the RMS value is in
terms of the units being measured in this case millimeters.
! These 10 categories are in millimeter units. The information
provided is the percentage of the road surface with a macro
texture within that range. For example, 35% of the road
surface fine macrotexture measured by laser camera 1 was
between 0.2 and 0.3 millimeters.
Figur 7 Sample printout for fine values
Root Mean Square (RMS) - macro 1 and macro 4 refer to the specific laser camera and "rough" and "fine" refer to the type of macrotexture considered. The RMS value provides information which is almost the same as the standard deviation, the difference being that the RMS value is presented in the units being measured, i.e., in millimeters in the present case.
These lO categories are presented in millimeter units. The information provided is the percentage of the road surface with a macrotexture RMS within a specific range. For example, 35% of the road surface fine macrotexture mea-sured by laser camera 1 had an RMS between 0.2 and 0.3 iTnLHnneters.
L o s e r RS I" 2 13
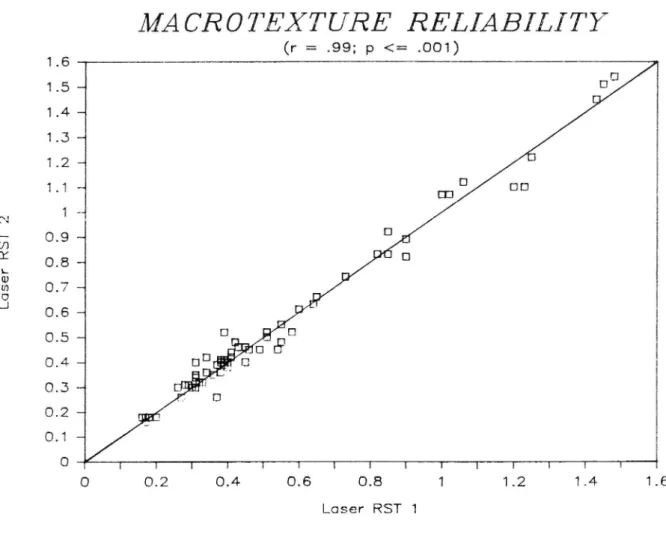
AJA CROTEXTURE RELIABILITY
(r = .99; p <= .001) 1 .6 1 .5 1:11.4
1.3
-1.2
_ 13 1 1 ED DD 1 4 0.9 a D 0.8 1 D 0.7 0.6 ~0.5
U
13 5
D
0.4 -4 DD D0.3 ..
00.2
_
0.1 O T 7 1 1 1 1 T 1 r T 1 r 1 1 0 0.2 0.4 0.6 0.8 1 1.2 1.4 Loser RST 1Figure 8 Results from repeated measurements with the macrotexture
measurement system on actual roads in the United States
(road unit = 100 meters)
2.2.4 Crack measurements
The RST provides information about a sample of the road surface. No attempt is made to count every crack. A procedure that counted every crack would be prohibitively expensive, time-comsuming, and rather
unneccessary.
A sample is representative of the whole road surface and is assumed to have properties similar to that surface. Information gained from the sample should thus be the same as information gained from any other section of the road. The field of statistics is, to some extent, concerned
14
with determining the validity of a sample from an entire unit. The use of samples to obtain information about entire population is the basis of
modern scientific methodology.
The understanding of this point is basic to an understanding of the RST crack measurement. It does not count every crack because it does not sample the entire road surface. It samples only those sections that are beneath the four lasers mounted at the back of the vehicle. These four lasers are mounted at strategic locations (two in the tire tracks and two toward the middle of the road). The operator can specify 3 width and 2 depth categories for the computer to use as crack size limitation areas resulting in six categories of crack size. The cameras are connected in pairs and a crack recorded within a specified distance by both cameras is considered as transversal. Longitudinal cracks cannot be indentified as being longitudinal. Instead, they will be registered as regular cracks. It may be suitable to add additional crack measurement cameras in the future. This will provide a greater sampling of the road surface and increase the statistical validity of the crack sample ( see Figures 9, 10,
11, 12A,12E >).
The RST crack values give an indication of the severity of road cracking. They also give an indication of what size cracks (within the user determined limitations) are most prevalent.
Figure 9
15
Illustration of the four macrotexture and crack measuring lasers on the RST. In the next version of the vehicle a new laser unit has been developed which will measure all variables, including cracks and macrotexture, this being similar in appearance to the front cameras.
The crack count for each of the four cameras
Three width categories (3-6mm, 6-12mm, 12-50mm)
Two depth categories (3mm and 6mm)
Macrotexture compensation factor (for this measure 1.0)
Distance (in mm) within which cracks counted by paired cameras will be considered as the same crack
16
Sample output from the Laser RST
Crack count from Laser RST:
t > 3.0 6.0 V ' > 3.0 6.0 12.0 3.0 6.0 12.0 both MC < ! 6.0 12.0 50.0 6.0 12.0 50.0 100.0 1.0 ->crack 1 40 23 5 1 3 3 2 17 13 5 0 0 O 8 4 97 54 22 1 1 7 3 18 9 3 1 1 1 14 ! I
i
! !!- - The crack count for each of the four cameras
I I | I I ! I I I
' ! Three width categories (3-6mm, 6 12mm, 12 50mm)
I g ! g I
i
! ! ! ! ! . !! Two depth categories (3mm and 6mm) !
I
Macrotexture compensation factor for this measure (1.0)
I -0 -o 0 v c a . 0 o u . u o . . 0 -o o . -n u . 0 l o c .
Area (mm) within which cracks counted by separate cameras will be considered the same crack (counted only once)
Figure 10 Printout from crack measurements. The system is flexible
and easy to use. A system with another type of output, e.g., a crack index scale of 1-9, where "l" is a road without cracks and "9" a road with extensive cracking, is presently under investigation.
CRACK RELIABILITY
(r = .99; p <= .001) 900 800 700 600 _ 500 400 soo ///// o 200 4 Lo se r R S T 2 100 O _ I I I I r 1 O 200 400 600 800 Loser RST 1Figure 11 Results from repeated measurements with four crack
measurement cameras. The conformity with manually
measured cracks and with personal ratings is also high
17
Combination Camera 32 khz
crack wz2mm d:10mm 90 km/h m m m \J ( I I L D ( J -l \ ) ( A m m O) U1 (n (I ! U1 U] (7) U1 PU ! (n (n (n (n f) _) N u 0 (12 OA- CLS 0.8 1 L2 LA 1.6 L8 2 (Thousands) samplesFigure 12A Cracks measured in simulated conditions by the laser
camera. At 90 km/h cracks with a width of less than 1 mm
can be measured.
Combination Camera 32 khz eras-(<2
crack wz2mm dz10mm 90 km/h 68 67 66 65 64 63 62 61 60 59 58 57 56 55 54 53 52 51 50 1.323 1.325 1.327 1.329 1.331 1.333 1.335 1.337 1.339 1.341 (Thousands) sonu es [T IN ]
18
3 THREE DIMENSIONAL PROFILE MEASUREMENT
Work to improve the Laser RST system for longitudinal profile
measure-ments is in progress. A laser plane system (RST-LP) for three
dimen-sional measurements has been developed (see Figure 13). The RST-LP
uses two external, stationary signal transmitters. These transmitters are
placed relative to a known fixed point (the reference point to which all data is related). The RST-LP has two receiving masts that allow the
central computer to continuously determine the exact location of the RST relative to the fixed reference point. This process provides the RST-LP with the necessary information for the accurate calculation of both longitudinal and cross profiles (see Figure 14). This will make it possible to carry out profile measurements with even higher precision and at greater speeds than is presently the case on roads, in addition to on airfields and bridges. The system will also be used in Sweden for the calibration of roughness and rut depth measurement carried out with the normal programs. Of course other simpler calibration systems are also being used for all variables in the Laser RST. It is especially important to do dynamic testing of the lasers, and a portable system for this purpose will be available in 1985.
7 $ 1* HST
The
19
4 HIGH SPEED BEARING CAPACITY MEASUREMENTS BY
MEANS OF LASER TECHNIQUE
The methods so far described concern surface characteristic and surface deterioration measurement. Further developments are aimed toward
locating structural problems when the road is in a critical state but has
not yet deteriorated to the point of breakdown.
Work has been initiated using two sets of eleven laser cameras, one
preceding and uninfluenced by a wheel load and one directly following a rolling wheel load. The differences between the profiles taken before and
after the rolling wheel load will, if handled statistically correctly and with frequent sampling, show the rolling load influence on the road
surface. Current work is being carried out focusing on three-dimensional
simulation of the road body and investigating how various loads, speeds, and temperatures influence the road body. The results will then be used
to construct the Laser Road Deflection Tester.
LASER
20
5 CROSS PROFILE AND CURVE RADIUS
A non-gyro system is at present being tested for measurement of cross profile and curve radius with the Laser RST. The system is easy to handle and resonably inexpensive. It consists of an inclinometer which measures the vehicle's side angle and speed, and the curve radius is used to compensate for side acceleration. Similar systems have been
21
6 CONCLUSIONS
In order to be able to move away from subjective measurements towards
more objective measurements of road surfaces a great emphasis should
be placed on developing measurement systems for roads. The importance of interdisciplinary work in this area is being increasingly recognized. This will not only benefit the road measurement field but society as a
whole.
At one level the RST is a complete system. It is functionally independent and requires no support in order for it to be able to provide its information. This of course does not mean that the quality of the sytem cannot be substantially improved through further developments. This is the goal of the Stockholm survey in September 1985, during which four RST vehicles, as well as other types of equipment from Sweden and Finland, and ten drivers will be involved in assessing 50 road sections.
At another level, however, the RST is part of a larger system. This
larger system requires data from the RST in order to provide information necessary for road maintenance and road use at the societal level. The development of this larger system is still almost in its infancy and an extensive amount of work has yet to be carried out, e.g., experiments and statistical studies of relationships between RST variables and economically important variables such as gasoline consumption, vehicle degradation, etc. Experience and development must be incorporated into this system and it must be integrated with the road and communication systems of other countries.
The major advantage of the RST-system is its extreme flexibility. The user of the system is given the freedom to choose and adapt variables to his specific needs. Presentation and storage of data can also be modified for specific target needs. This approach to system design was selected in order to allow the RST to be easily used on an international basis, thus
allowing the development of a broad research base involving an active
22
LITERATURE
Alm, Lars Olof. Spårbildning i vägbeläggningar. Olägenheter. Kritiska spårdjup och mätmetoder. (Road pavement rutting - hazards, critical
depths and measuring methods.)* VTI Report 129, 1977.
Alm, Lars-Olof. Mätning av vägbeläggningars makrotextur för friktions-bedömning. Principer och mätmetoder. (Measurement of road surface
macrotexture for skid resistance prediction. Principles and measuring methods.)* VTI Report 163, 1979.
Arnberg, P W, Råhs K and Oberholtzer, R. The development potential of
the laser RST system and this sytern's importance to society. To be
published at VTI, 1985.
Arnberg, P W and Åström, G. Vägojämnheters inverkan på bilförares
prestation och trötthet. (The influence or road roughness on drivers'
performance and tiredness. A literature survey and a simulator
experi-ment). VTI Report 181, 1979.
Arnberg, P W and Magnusson G. Jämnhet och spårdjup samt subjektiva bedömningar vid provinventeringen 1979. (Evenness, rut depth and sub
jective ratings at the test survey in 1979). VTI Work Report, 1979.
Arnberg, P W. Inventering med vägytemätbil, Saab RST, 1980.
Invente-rarnas och föInvente-rarnas uppfattning om mätfordonet och
inventeringsmeto-derna. (Road survey carried out in 1980 with the Road Surface Tester (Saab RST). Sub report on the road engineeers and the drivers attitudes to the test equipment and the method utilized). VTI Meddelande 250,
1981.
Arnberg, P W och Sjögren L. Nordiska jämnmhetsmätare. En jämförande studie. (Evenness measuring vehicles used in Scandinavia. A comparative
study). VTI Meddelande 332, 1983.
Arnberg, P W and Sjögren, L.Nordiska friktionsmätbilar. En jämförande studie. (Friction measuring vehicles in Scandinavia. A comparative
study.)* VTI Meddelande 333, 1983.
Arnberg, P W and Sjögren, L. Nordiska spårdjupsmätare. En jämförande studie. (Rut depth measuring vehicles in Scandinavia. A comparative
study.)* VTI Meddelande 334, 1983.
Arnberg, P W. The Laser Road Surface Tester. A new road measuring
system developed by the Swedish Road and Traffic Research Institute. Paper presented in the US and Japan, December 1981.
Arnberg, P W. Litteraturgenomgång och diskussion av vägojämnheters
betydelse för komfort och prestation. (Literature survey and discussion
of the influence of road roughness on comfort and performance.)* VTI
23
Arnberg, P W and Hellström, Å. Betydelsen av "stimulusfelet" för ISO
och VDI komfortnormer vid tillämpning på vägojämnheter. (The import ance of the "stimulus error" to the ISO and VDI comfort standards applied to road roughness.)* University of Stockholm, Psychological Institution, Memorandum, 1973.
Arnberg, P W and Magnusson, G. Mätning och utvärdering av vibrationer
alstrade av vägojämnheter. Föredrag vid specialsymposiet "Helkroppsvib-rationer" 12 november 1980. (Measurement and evaluation of vibrations produced by road roughness.)* Invenjörsvetenskapsakademien, kommittén
för vibrationsfrågor, Arbetsgrupp 8 Vibrationers inverkan på män
niskan. VTI Separate impression.
Arnberg, P W, Carlsson, G and Magnusson, G. Inverkan av vägojämnhe ter. En problemanalys. (The influence of road roughness. Analysis of problems.)* VTI Meddelande 95, 1978.
Arnberg, P W, Magnusson, G and Ohlsson, E.. Mätning vid hög hastighet av olika vägkarakteristika. Problemanalys samt utvärdering av metod för vägojämnhetsmätning. (High speed measurement of different road
sur-face characteristics.)* VTI Meddelande 154, 1979.
Arnberg, P W. The Influence of Road Roughness on Drivers' Performance
and Fatigue. A paper prepared for The Conference "Truck Ride Quality and Highway Safety" by The University of Michigan, Ann Arbor, Mich.,
January 24-26, 1982, VTI Publication (Särtryck) 69, 1982.
Arnberg, P W, Carlsson, G, Djärf, L, Land, P G, Magnusson, G, Schan dersson, R, Simonsson, B, Wiman, L. Underhåll av belagda vägar (Main
tenance of Paved Roads. Current State of Knowledge and Research Needed."), VTI Publication (Meddelande) 406, 1984. English abstract.
Gynnerstedt, G. Road geometric design as a function of level of service and road users cost by traffic simulation. VTI Meddelande 192, 1980. Hammarström, U and Ericsson, E.. Samband mellan fordons kostnader och
väg och trafikmiljö. Litteraturstudier. (Effects of road design and
traffic conditions on vehicle operating costs. A study of the literature.)* VTI Report 154, 1978.
Hammarström, U. Bilars värdeminskning. Värdeminskningens beroende av
miljö, körlängd och tid. (Vehicle depreciation. Effects of road standard, mileage and age.)* VTI Meddelande 182, 1979.
Kihlgren, B. Slitage av bildäck vid körning på äldre ytbehandling och asfaltbetong. (Tyre wear caused by driving on old and used surface
treatment and asphalt concrete.)* VTI Meddelande 236, 1980.
Land, P-G. Pavement management system. Vägverket PP 36, 1985.
English version at the end of 1985.
Lilja, B and Ohlsson, E. Faktorer som medverkar till låg friktion mellan bildäck och vägbana. (Factors contributing to low friction between car
24
Lundkvist, S-O, Helmers, G and Ytterbom, U. Specific luminance
mea-surements of road markings and road surfaces in the field. Comparisons
between instruments. VTI Report 188A, 1980.
Magnusson, G. Inventering av utländska bestämmelser och standardkrav
för vägars jämnhet. (An inventory of foreign regulations and standard
demands regarding road roughness.)* VTI Report 84, 1976.
Magnusson, G and Arnberg, P W. The rating and measuring of road roughness. VTI Report 83A, 1976.
Magnusson, G, Arnberg, P W and Pettersson, H-E. Mätning och bedöm-ning av ojämnheter på grusväg. (The rating and measuring of road
roughness on gravel roads.)* VTI Report 123, 1977.
Magnusson, G and Arnberg, P W. Vägojämnhetens inverkan på broms- och
styrbarhet. (The influence of road roughness on the braking and steering
performance of cars: A literature study.)* VTI Report 134, 1977.
Nordström, O and Ohlsson, E. Description of friction test vehicle No. 5 of the Swedish Road and Traffic Research Institute. VTI Report 2, 1971. Nilsson, A and Ohlsson, E. Aqua planing Tests, 1967 to 1969. Investiga-tion of Braking AcInvestiga-tion Developed by Motor Car Wheels. VTI Meddelande
193,1980.
Ohlsson, E. Friktionsmätvagn BV 11. Handbok. (Friction measuring vehicle BV 11. Manual.)* VTI Meddelande 157, 1979.
Ohlsson, E. Friktionsmätning på rullbanor och vägar. (Friction measure
ment on runways and roads.)* VTI Report 177, 1979.
Olofsson, G. Bränsleförbrukningens beroende av beläggningens typ och
standard. En pilotstudie. (The dependence of fuel consumption on the
type and standard of the road surface.)* VTI Meddelande 152, 1979. Rähs, K. Vägjämnhetssimulatorer en funktionsbeskrivning. (Road rough
ness simulator - a function description.)* VTI Report 184, 1979.
Sandberg, U. Road Surface Characterization with Respect to Tire/Road
Noise Summary of Characterization Methods. STU-report 76-6618/77
6232/785650/79 5618, National Swedish Board for Technical Develop
-ment, 1982.
Schandersson, R. Samband mellan vägbeläggningar och trafikolyckor
1977. (Connection between road surfaces and traffic accidents in 1977.)* VTI Meddelande 242, 1981.
Sinha Brajnandan. Influence of road unevenness on road holding and ride
comfort. VTI Report 28, 1973.
_ _ _=*_c ".v_-_n__u.ADu-_M__m*_A-d.c Mu