J
Ö N K Ö P I N GI
N T E R N A T I O N A LB
U S I N E S SS
C H O O L JÖNKÖPI NG UNIVER SITYB u s i n e s s I n t e l l i g e n c e
The impact on decision support and decision making processes
Bachelor’s thesis in Informatics Author: Daniel Andersson
Hannes Fries Per Johansson Tutor: Jörgen Lindh
Bachelor’s thesis in Informatics
Bachelor’s thesis in Informatics
Bachelor’s thesis in Informatics
Bachelor’s thesis in Informatics
Title: Title: Title:
Title: BBBBusiness Intelligence usiness Intelligence usiness Intelligence usiness Intelligence –––– Impact on decision support and decision making Impact on decision support and decision making Impact on decision support and decision making Impact on decision support and decision making Author:
Author: Author:
Author: Daniel AnderssonDaniel AnderssonDaniel AnderssonDaniel Andersson Hannes FriesHannes FriesHannes FriesHannes Fries Per JohanssonPer JohanssonPer JohanssonPer Johansson Tutor:
Tutor: Tutor:
Tutor: Jörgen LindhJörgen LindhJörgen LindhJörgen Lindh Date Date Date Date: 2008200820082008----010101----1701171717 Subject terms: Subject terms: Subject terms:
Subject terms: Business Intelligence, Decision Support, Decision Making, IBusiness Intelligence, Decision Support, Decision Making, IBusiness Intelligence, Decision Support, Decision Making, IBusiness Intelligence, Decision Support, Decision Making, Innnntuitiontuitiontuition tuition
Abstract
IntroductionHistorically, decision support systems have been used in organizations to facilitate better decisions. Business Intelligence has become important in recent years because the business environment is more complex and changes faster than ever before. Organizations have started to realize the value of existing information in operational, managerial, and strategic decision making. By using analytical methods and data warehousing, decision support can now be used in a flexible way and assist decision makers in decision making processes. Problem
Increasing investments in Business Intelligence indicate that it can bring value to organiza-tions. Benefits such as the ability to access relevant and timely decision support when it is needed can be of tremendous value when the use of existing information has become more a question of survival or bankruptcy for an organization, than profit or loss. Thus, it would be interesting to see how decision support and decision making have changed in organiza-tions after implementing a Business Intelligence system.
Purpose
The purpose of this thesis is to investigate if and how Business Intelligence has changed decision support and decision making processes.
Method
A deductive approach using a qualitative method has been used with semi-structured elite interviews. The thesis aims to investigate the manufacturing industry located in the Jönköping region in Sweden. The interviewed organizations are Husqvarna AB, Fläkt Woods AB, Myresjöhus AB, and Kinnarps AB.
Conclusions
Our analysis shows positive effects of Business Intelligence in organizations with im-provements of decision support due to timeliness, accessibility, quality, and better control of organizational information. As improvements in decision support has occurred, decision making has become better. Complicated problems are now easier to interpret by decision makers. Our research also concludes that intuition still has a major impact in decision mak-ing processes.
Table of Contents
1
Introduction... 1
1.1 Background ...1 1.2 Problem Discussion...2 1.3 Purpose ...2 1.4 Problem Delimitation ...2 1.5 Interested Parties ...2 1.6 Positioning...3 1.7 Definitions...32
Method ... 4
2.1 Categorization of Knowledge...4 2.2 Method Approach ...52.2.1 Qualitative and Quantitative Research ...5
2.3 Data Collection ...6
2.3.1 Literature ...6
2.3.2 Personal Interviews ...7
2.3.2.1 Outlining of Interview Questions ...8
2.3.3 Interpretation of the Empirical Findings ...8
2.4 Selection of Respondents...9
2.5 Method Validation...9
3
Frame of Reference ... 11
3.1 Business Intelligence...12
3.1.1 Data Warehousing Environment...13
3.1.2 Analytical Environment...14
3.1.2.1 Decision Support...14
3.2 Decision Making Processes ...15
3.2.1 Managerial Activity ...16
3.2.2 Management Information Systems...16
3.2.3 Intuition...18
4
Empirical Findings... 20
4.1 Husqvarna AB ...20 4.2 Fläkt Woods AB...21 4.3 Myresjöhus AB ...22 4.4 Kinnarps AB ...234.5 Summary of Empirical Findings ...25
5
Analysis ... 26
5.1 Decision Support ...26
5.2 Decision Making Processes ...28
6
Conclusions ... 30
7
Final Discussion ... 31
7.1 Reflections...31
7.2 Suggestions for Further Studies ...31
7.3 Acknowledgements ...32
Figures
Figure 2.1 - The inductive versus the deductive approach...5
Figure 3.1 - The connection between theories in the frame of reference ...11
Figure 3.2 - The BI environment (Eckerson, 2003) ...13
Figure 3.3 – The decision making model (Simon, 1960) ...16
Figure 3.4 - A Framework for Management Information Systems (Gorry & Scott Morton, 1989) ...18
Figure 5.1 - Analysis model...26
Appendices
Appendix 1 – Interview Questions, English ...351 Introduction
In this chapter we introduce the reader to the phenomena of decisions and parts of the historical evolution of computerized support for decision making. We describe and problematize the phenomena of Business Intel-ligence and thereafter state our research questions and present the purpose of this study. We also delimit the problem, determine major stakeholders, briefly describe some other studies concerning Business Intelligence and some fundamental concepts.
The field of Business Intelligence (BI) has become a popular area in recent years as a new approach to gather and analyze data for business use. We believe there is a lack of research conducted within this field. Since we have an interest in the area of BI and the fact that the phenomena is fairly new, we believe we have a good opportunity to contribute with new knowledge within this topic. Werner (2007) argues that BI is one of the most popular areas for IT management to invest in, which makes BI an even more interesting topic.
1.1 Background
Humans have always been forced to make various decisions in different situations. Deci-sions can be very simple, without major impact and consequences, or be of a very complex nature, with a huge impact on millions of people. In organizations, managers have always been making decisions concerning operational, managerial, and strategic matters and these decisions can have an impact on the organizations’ stakeholders, ranging from the employ-ees to the government. Managers often try to predict and understand the outcome of dif-ferent decisions they make. This could be extremely difficult because speculating in a future context is always a daunting task. However, a successful prediction can be very helpful in order to select the right decision to achieve the desired outcome or best alternative. Already in the 1950s, organizations realized the potential of computers and they began to play an important role. Between the mid 1950s and the early 1970s, the use of computers and information systems (IS) in organizations grew tremendously but few of these systems had an impact on mangers’ decision making. In the 1970s, new systems were developed to support managers in accessing relevant business information needed for decision making (Gorry & Scott Morton, 1989). These systems provided business managers with static, two dimensional reports without any analytical capabilities (Turban, Aronson, Liang & Sharda, 2007b). In the 1980s, the systems evolved and started moving away from static reports. In-stead, focus was shifted to monitoring the organizations’ progress and performance to-wards critical goals (Burkan, 1991). Organizations did not only need information systems to support their ongoing operations, they needed systems that could assist managers with val-ue added information in their decision making processes (Fernandez, Labib, Walmsley & Petty, 2003). McNurlin and Sprague (2004) describe decision support systems (DSS) as a management information system (MIS) in conjunction with analytics. To be able to cope with the huge information flow, DSS have moved towards an attempt to create an intelli-gent DSS. This attempt provides a great promise to improve both individual performance and organizational performance and is designed to support, not replace human decision makers (Dalal & Yadav, 1992). The Gartner Group introduced the term BI in the mid-1990s but the concept has evolved from MIS, used to support reporting in the 1970s (Tur-ban et al., 2007b). Today, the term BI is widely used when discussing support in organiza-tional decision making, instead of tradiorganiza-tional terms like MIS and DSS.
1.2 Problem Discussion
Today, the organizations’ business environment is becoming more complex and changes faster than ever before. This generates pressures on the organizations and forces them to respond quickly. To be able to respond to these pressures in an appropriate manner, or-ganizations have to make quick, operational, managerial, and strategic decisions, which can be of a very complex nature and may require timely and relevant information, data, and knowledge (Turban, Sharda, Aronson & King, 2007a). To be able to improve processes and create additional business value, organizations have started to realize the value of exist-ing information. As a result of the increasexist-ing demand, the number of BI vendors and tools has increased substantially in the past years. Using analytical tools and data warehousing, BI is extracting and analyzing relevant information and making it accessible to the right mem-ber as a support in decision making processes. In this process, data is gathered from differ-ent systems, which leads to large amounts of organizational data. To support decision mak-ers in their decision making process to make more informed decisions this data needs to be analyzed, distributed, and accessed by the right person, at the right time (Turban et al., 2007a). The number of implementations and organizations using BI has increased during the last years (Miller & Reinke, 2007). This might imply they have become more aware of the usefulness of business information. Turban et al. (2007a) argues that providing updated and accurate business information, which we address as decision support throughout this study, is more a question of survival or bankruptcy for an organization than profit or loss. BI’s major benefit is the ability to access relevant decision support when it is needed. Based on this, it would be interesting to see how decision support and decision making have changed in organizations after implementing a BI system.
• How has decision support changed after a BI implementation? • How has BI changed the way organizations make decisions?
1.3 Purpose
We will investigate if and how BI has changed decision support and decision making proc-esses.
1.4 Problem Delimitation
To be able to generalize our study in one business sector, we will focus on one industry; manufacturing. According to Werner (2007) manufacturing organizations are currently one of the most frequent investors in BI. The region of Jönköping has a relatively high number of manufacturing organizations (SCB, 2005), therefore this region is appropriate for this study. This study will only focus on two aspects, decision support and how it is considered to have changed after a BI implementation. The second aspect is how decision making processes have changed after implementing BI. We do not intend to include anything re-garding technical or human-computer interaction (HCI) aspects of BI.
1.5 Interested Parties
Organizations with an interest in implementing a BI system could gain understanding of how decision support and decision making have changed after BI implementations. Or-ganizations that create and market BI systems may have an interest in seeing what the user experiences are and how the systems have affected decision support and decision making.
In the academic world, researchers and students with an interest in BI might find this thesis interesting when searching for new areas of research. Organizational managers could see how decision support has changed and therefore develop an understanding of BI and how it could affect their organization in the daily work and long-term planning.
1.6 Positioning
BI is currently a discussed topic in the Swedish business world (Werner, 2007). Exido (2007), a Swedish research analyst company, predicts a 14 percent increase in BI invest-ments in Sweden for 2007. The global BI market is increasing at a similar rate. Gartner (2007) predicts the BI market in Europe, Middle East, and Africa (EMEA) to increase with 10 percent in 2007. Despite its popularity, Swedish research in this field is lacking. Our study will therefore be based mostly on American literature. We do not believe there are any major differences between BI systems in the US and Sweden and we therefore consider our choice of literature appropriate. However, we have found a few studies conducted in Sweden. Karlberg and Karlsson (2006) discuss BI from two perspectives, the concept and the phenomenon. Similar, Biberic and Hodell (2007) evaluate BI from a rational decision making model to understand how companies use BI. Olsson (2007) discusses the history behind BI and describes current and future BI trends from a business perspective. Dagman and Wigsten (2007) identify causes that constrain organizations to efficiently utilize a BI process and they discuss how to create higher efficiency in a BI process.
1.7 Definitions
Business Intelligence – Using data warehousing and analytical tools, BI is extracting and analyzing relevant information and making it accessible to the right member as a support in decision making processes.
Data Warehouse – Central storage of data to support decision making in organizations. Decision Support – BI generated information supporting decision makers in decision making processes.
Decision Support Systems – Systems used to directly support specific decision making processes.
ETL – Extract, Transform and Load is the process of extracting data from different sources, converting it into an appropriate format and loading the data into a data ware-house.
Key Performance Indicator – A financial or non-financial measure of how well an or-ganization is performing.
Management Information Systems – Information systems used to analyze and solve business problems.
2 Method
The data necessary to perform this study will be gathered through qualitative methods. The empirical find-ings will be collected from primary sources through in-depth interviews with selected organizations. Data from secondary sources will be collected from literature. The choice of methodology for this study will be pre-sented and argued for below.
Goldkuhl (1998) argues a researcher who wants to develop knowledge must plan and de-sign the process of acquiring knowledge. This process can be divided into two phases. The first phase is planning and defining and the second phase is realization of the planned activities. Development of knowledge starts when a researcher is interested in a phenomenon and wants to know more about this specific area. Based on this interest, preliminary research questions are formulated. The researcher thereafter tries to articulate pre-knowledge about the phenomena. This pre-knowledge in conjunction with other knowledge in the area helps the researcher to reformulate and determine the research questions. Thereafter, the re-searcher determines the demanded knowledge - what knowledge to develop. The de-manded knowledge is the determinant of what strategy and what method to use to conduct the study (Goldkuhl, 1998). The major objectives in this research are to understand how decision support and decision making processes have changed after implementing a BI so-lution in an organization. Therefore, the research group needs to understand current litera-ture about human and computer in conjunction in decision making processes. Our research questions are based on discussions in order to fulfill the purpose and give appropriate guid-ance of the thesis. The research questions have been affected, determined, and adjusted based on literature the group has studied.
2.1 Categorization of Knowledge
Determining what type of knowledge to develop is referred to as categorization of knowledge. Goldkuhl (1998) argues a researcher needs to determine what kind of knowledge to de-velop. This is a process to establish the value of the developed knowledge and to determine the appropriate strategy for the study. Goldkuhl (1998) presents different types of knowl-edge which are appropriate in different research situations. Deciding on a strategy is neces-sary to determine what type of knowledge to create and the chosen strategy should follow the categorization of knowledge (Goldkuhl, 1998). In this study explanatory knowledge will be created using an explorative strategy.
• Explanatory knowledge is an approach where the researcher explains why a phenome-non is in a certain manner and mention causes, foundations, reasons or prerequisites for the resulting relations. Often, explanatory knowledge means to test hypothesis but there are other cases as well. One approach within explanatory knowledge is to study effects which originate from a certain event (Goldkuhl, 1998).
• Explorative strategy is a research strategy where the researcher does not test hypothesis but is an attempt to get better knowledge within a specific area. This approach is like-ly to generate hypothesis (Goldkuhl, 1998).
To conduct this study in a suitable manner, the most appropriate type of knowledge is ex-planatory knowledge. One of the approaches within this type of knowledge is to study effects which originate from a certain event (Goldkuhl, 1998), in this case a BI implementation. The explorative strategy aims at generating knowledge within a specific area and since existing literature does not cover the intended research objectives we have to use the explorative strategy.
2.2 Method Approach
Holme and Solvang (1997) argue that explaining a phenomenon or a situation using theo-ries is not always easy. Even though it is a complex task, it is necessary in order to create understanding and develop new theories. There are two approaches researchers use; induc-tive and deducinduc-tive (Holme & Solvang, 1997). The two approaches are illustrated in figure 2.1. Using an inductive approach, the researcher collects empirical material. The empirical data is analyzed and generalized and new theories are generated from the generalizations. The deductive approach is more formalized. Unlike the inductive approach, it starts in theory where the researcher derives a testable hypothesis or a theoretical proposition. Through analysis of the collected empirical data, the hypothesis is accepted or rejected (Bailey, 1996).
Figure 2.1 - The inductive versus the deductive approach
The thesis work will start with a comprehensive literature study, to familiarize ourselves with the concept of BI, systems for decision support, and areas related to decision making processes. From the findings in the literature study, we will develop our research questions and define the purpose of this thesis. The next step in our research process will be to gath-er empirical matgath-erial through intgath-erviews with manufacturing organizations using questions related to existing theories. An analysis of the findings using these theories will follow and the results aim to provide answers to our research questions. Based on this description of planned activities, we argue that we follow the deductive approach.
2.2.1 Qualitative and Quantitative Research
The reality of today’s society is of complex nature and it is impossible to seize the reality of this environment using only one method. There are two different categories of methods, qualitative and quantitative methods. Both methods have their strengths and weaknesses and the selection of which method to use should have its starting point in the purpose. The primary focus of qualitative studies is explanatory and implies less standardization. Creating a deep understanding of the study objects is one important feature of this method. The other important aspect is to describe the whole of the context. One characteristic of this method is to be close to the studied objects. Quantitative methods are characterized by a higher degree of standardization and they imply higher control for the researcher but also pre-determine possible answers. The planning and selection in quantitative methods is cha-racterized by distance to the research objects (Holme & Solvang, 1997).
The qualitative approach generates an overall picture of social processes and contexts. Be-cause of time restrictions and to be able to get an overview of the information, a limited
number of research objects are often selected. The qualitative approach also generates an understanding of the total situation. The strengths of quantitative methods are their ability to result in generalizable outcomes. The outcomes can lead to opportunities for the re-searcher to make statistical statements. There are some characteristics associated with these methods as well. Qualitative methods are flexible and the questions can be revised during the meeting with an object and can be changed during the study. This is both a strength and a weakness, since it can be difficult to compare the outcomes of different interviews. Quantitative methods on the other hand are fixed and cannot be changed during the study, it must be standardized. This gives the researcher control and the ability to generalize (Holme & Solvang, 1997).
To gain deeper understanding in how decision support and decision making have changed after an implementation of BI, a close interaction with the study objects is needed. This in-teraction will take place during personal interviews with a low degree of standardization. The objective is to get an overall picture of BI usage in manufacturing organizations, both how it is utilized and what that impacts are on decision making. Based on this, the qualita-tive approach was found to be the most appropriate for this study since we will focus on qualitative changes which have occurred after a BI implementation.
2.3 Data Collection
There are two different types of data, primary and secondary data. Primary data is informa-tion gather by the researcher using a certain method. Holme and Solvang (1997) argue that primary data is gathered when the researcher is close to the study objects and the inter-viewed object has experienced the situation itself. Secondary data is information gathered by other researchers in earlier studies (Lundahl & Skärvad, 1999; Holme & Solvang, 1997). To gather information using qualitative methods four approaches are typically used. First, the researcher can participate in a setting. Secondly, a researcher can conduct a direct ob-servation. The third and fourth approaches to gather information are personal interviews and analyzing documents and material culture (Marshall & Rossman, 1999). In this study we are going to use literature studies and conduct personal interviews.
2.3.1 Literature
When a researcher describes the context and history of a phenomenon, an important part of research work consists of reviewing documents. This approach can be seen as supple-mentary to other qualitative approaches to gather information. Research journals concern-ing the topic are one example if they are relevant for the study. One obvious drawback us-ing literature in a study is the need for interpretation by the researcher (Marshall & Ross-man, 1999). The sources used in this study have all been processed in a way suggested by Holme and Solvang (1997). They describe four steps to analyze a source; observation, source, interpretation and usefulness. In the first step, observation, the researcher tries to find sources which enlightens the questions determined in the problem discussion and also tries to get an overview of relevant existing literature. In the second phase, source, is im-portant to determine who the author is to establish the source’s trustworthiness. The third step, interpretation, deals with the problems of interpreting what the source describes and try to analyze the information. In the last step, usefulness, the researcher determines how useful the source is to fulfill the purpose (Holme & Solvang, 1997).
Since we will use a deductive approach in this study and have the starting point in literature it is of great importance to asses the sources used. The observation step was conducted
early in the study and the reliability of sources used are high since most of the literature used within the report are written by well-known writers or published in well-known re-search journals. The third and fourth steps are more problematic since we need to interpret what the author meant and determine how useful the information is. Hence, we believe to have understood the context and meaning of the literature and that it is applicable to the study. To fulfill our purpose we intend to use literature regarding BI, decision support, and decision making.
2.3.2 Personal Interviews
Interviews have, like most methods, strengths and weaknesses. Interviews generate large amounts of data quickly and the ability to follow up the result immediately. An interviewer needs participation and cooperation from the interview object, and a problem may be the interview object’s unwillingness of answering all questions. The interviewer can also have problems when it comes to understanding a certain behavior because of differences in cul-tures, languages or the interviewer’s lack of skill. The interview object can also have reasons for not being truthful (Marshall & Rossman, 1999).
One common approach to distinguish between interviews is the degree of standardization. If the questions have a high degree of standardization the questions and the order of the questions is the same for all interviews in the study. If the interview is unstandardized, the outlining of the questions is different from interview to interview but as long as the need for information is covered, this type of interview can be a good alternative. Many inter-views are not either of these types, which can be seen as extremes, but somewhere in be-tween these interviews types. Lundahl and Skärvad (1999) argue these interviews can be addressed as semi-standardized interviews. In semi-standardized interviews, the interviewer asks certain questions to all respondents and then asks attendant questions to get a deeper understanding. Unstandardized interviews are appropriate when the researcher conduct qu-alitative studies where the researcher wants to develop an understanding of a respondent’s situation or its motives and ideas about a certain phenomena. Standardized interviews are appropriate when the researcher needs more quantitative data (Lundahl & Skärvad, 1999). We will use semi-standardized interviews since we want to cover certain question areas. However, we do not want to be tied to asking questions in a certain order and we want to be able to ask attendant questions to get a deeper understanding of BI usage.
In this report we will use what Marshall and Rossman (1999) addresses as elite interviewing. This type of interviewing aims at interviewing individuals with a certain amount of influ-ence in an organization. The interview objects are selected based upon their knowledge or expertise in a certain area. Elite interviewing gives the researcher opportunity to gain valu-able information because of the interview objects’ position in the organization. They can also give an overview of internal and external relations as well as legal and financial aspects. There are problems with this type of approach. Elites can be hard to interview since they have limited time and the interviewer may be forced to adapt the interview based on the el-ites’ wishes. To conduct a successful elite interview puts pressure on the interviewer to de-velop competence in related topics. However, if the interviewer is well-prepared, this type of interview generates quality information (Marshall & Rossman, 1999).
Using a tape recorder is desired to minimize the amount of notes and direct full attention to the respondent (Ritchie & Lewis, 2003). We intend to use a tape recorder during the in-terview since we do not want to miss important information. Bailey (1996) argues the re-searcher needs to explicitly clarify the use of tape recorder for the interview object and ask for its permission. One of the reasons to conduct a face-to-face interview is the possibility
to observe the body language of the respondent. Bailey (1996) claims this is very important. To be able to cope with the difficulties with elite interviewing we have studied a large amount of literature related to BI to be prepared for the interview situation. Time is an im-portant issue and we intend to contact our interview objects early in the research process.
2.3.2.1 Outlining of Interview Questions
Lundahl and Skärvad (1999) argue that personal interviews build on confidence between the respondent and the researcher. Further, interviews should start with questions of less controversial nature. Holme and Solvang (1997) also presents this view on interviews but they also argue that the interview should end with unproblematic questions because this gives the respondent and the researcher time to neutralize tensions which may have oc-curred during the more controversial part of the interview (Holme & Solvang, 1997). The outlining of the questions has been influenced by the authors mentioned above. The starting questions concern the respondent’s background within the organization and what position they have as well as questions regarding the organization. These questions are gen-eral and easy to answer. This will be done to build a confidence between respondent and interviewer and the fact that position can influence the answers. After these opening ques-tions, the interviewer will move on to BI and the questions asked will be based on the theoretical framework. The final questions will be of less controversial nature and we have decided to let the respondent speculate in the future of BI. When the interviews take place, the interviewers will always ask the questions like how and why. This approach was chosen to get a deeper understanding of each organization’s specific view of their own BI system and to get a clearer picture of the respondents’ thoughts about their BI system. We also be-lieve when how and why questions are asked, respondents will give more comprehensive and detailed answers and richer descriptions of each question.
Before the interviews are conducted, we will send the questions to the respondents. This will be done so that the they can familiarize themselves with our research and prepare an-swers to our questions. There are drawbacks using this approach, such as the fact that re-spondents may prepare the answers they think we want to receive and we might not get spontaneous reactions to our questions (Thomas, 2004). We believe the answers will be more valid and more complete if the respondents get the opportunity to prepare.
2.3.3 Interpretation of the Empirical Findings
According to Fischer (2007), researchers often discover two contradicting problems when analyzing research material. The first problem is the law of the missing middle. Researchers who start writing their results right after collecting empirical material often miss out the in-termediate stages of sorting and sifting and miss the line of argument. The second problem is the dilemma of drafting. Researchers never really understand their empirical material until they write it up. It is the process of writing that forces researchers to really understand the material. This implies an iterative process of sorting and sifting followed by writing (Fisch-er, 2007; Starrin & Svensson, 1994). These interpretations and understandings are based on knowledge and experience but also imagination and creativity. According to Starrin and Svensson (1994) this is legitimate when a researcher tries to interpret interview material. To be able to cope with the huge amount of data we will gather during the interviews we have decided to only present and analyze the material which directly relates to the research questions and the theories presented below. After each interview we will listen to the re-corded material once and then listen a second time to get a deeper understanding of the
context and the respondents’ answers. During the second listening notes will be taken. The recording will be stopped and rewind several times to assure nothing important is left out. This to assure that the presented empirical material is correct and presented in the right context. To be able to compile the empirical findings in a sufficient text, where no impor-tant information is left out, we will take notes and divide the answers between our research questions. We have also chosen to present important quotes from the conducted inter-views. We believe this approach will be helpful since we do not want to have too long texts with information not related to our research questions. The information presented in the empirical findings will not follow a chronological order, since we think that the interview questions will probably not always follow the intended outline. This is due to the fact that the respondents may answer questions before they are asked or the respondents might an-swer questions similar to other questions and therefore it will not be necessary to present these answers twice.
2.4 Selection of Respondents
Statistical generalizations are not central purposes within qualitative studies but nonethe-less, the selection of respondents is an important process in the study. Since the purpose of qualitative studies is to create a deeper understanding of a phenomenon, the selection process is not random. The selected respondents must fulfill certain criteria which are theo-retically or strategically determined (Holme & Solvang, 1997). We will base our selection of respondents on convenience sampling. There are drawbacks with this type of sampling. For example, Holme and Solvang (1997) claim conclusions from research based on conven-ience sample may be misleading. We argue we have good reasons for using convenconven-ience sampling since both the distances to the possible respondents and the time constraints will not allow us to conduct personal interviews to the same extent if we randomly select or-ganizations from the entire population. The benefits of using convenience sampling exceed the drawbacks and we therefore argue that this approach is appropriate in this study. To select respondents, the Affärsdata database will be used to search for manufacturing or-ganizations. To limit the number of hits and only show manufacturing organizations, our searches will be filtered using Svensk Näringsgrensindelning (SNI) codes, which follow the General Name for Economic Activities in the European Union (NACE) standard. The appropriate SNI codes will be found using the search criteria “Manufacturing”. We are only interested in manufacturing organizations in the region of Jönköping and therefore the results will be filtered by using Jönköping’s län and Västra Götaland’s län. Furthermore, we are only in-terested in organizations with more than 300 employees since we believe these organiza-tions have been working with BI for a longer time. We also intend to only interview or-ganizations with more than one year experience of using BI. We believe those organiza-tions have matured in their usage and therefore contribute with more interesting aspects of how the organization has changed after the implementation. To be able to generate suffi-cient empirical findings we will interview between four and seven organizations.
2.5 Method Validation
A study should, to be trustworthy, have a high degree reliability and validity. Those two as-pects have a close connection. Reliability is determined by how accurate the researcher has processed the information. Is the information the researcher presents reliable? Often there is no problem to determine in qualitative studies since the respondent can participate and give its opinion on how the researcher has interpreted the things the respondent described during the interview. Validity is dependent on what we will research and measure and if
that is clear in the purpose of the report. To gain valid information is easier in qualitative studies than in quantitative studies because the researcher is closer to the respondents and the respondent gets the opportunity to control its participation. One problem to get valid information is when the researcher does not understand what the respondent describes. It can also be hard for the researcher to determine whether to be active or passive during the interview. In different interviews it can differ in how valid information the researcher gains depending on being active or passive. Another problem can be the relationship between re-searcher and respondent. The respondent believes it should act in a certain way (Holme & Solvang, 1997). To be able to generalize a study is very important since the study should represent the reality and the result should be applicable to the entire population (Lundahl & Skärvad, 1999).
To deal with the problems regarding reliability we will assure we are well-prepared before conducting the interviews. Both the concept of BI and interview techniques will be studied. We believe when we know the concept of BI well, and the respondents realize this, they will give better and more advanced answers to our questions. After the interviews, we will compile the interview material and send it via email to the respondents to assure that the empirical material is correct and interpreted in the right context. We also believe this will solve any translation mistakes that might have occurred, since the interviews will be con-ducted in Swedish. Validity is harder to determine but since the interview questions clearly are adapted to the research questions we believe we have high validity. During the process of developing the interview questions we will have the difficulties concerning validity in mind and try hard to adapt the interview questions to fit the purpose of this study. Also, the selection of respondents will be carefully conducted. We will only interview respon-dents with extensive knowledge and insight in how BI works to increase validity. To be able to generalize our study we intend to conduct interviews until we have reached the point of sufficient knowledge which means very few new statements and thoughts regarding BI are discovered during the interviews. We will not be able to generalize our study for all in-dustries in Sweden, but we believe generalization of the results from this study will be pos-sible in one business sector; the Swedish manufacturing industry. Working with reliability and validity during the entire research process we believe will increase generalization of this thesis.
3 Frame of Reference
In this section we present some relevant theories for our study concerning Business Intelligence. We will also focus on describing what decision support is and different levels and aspects of decision making.
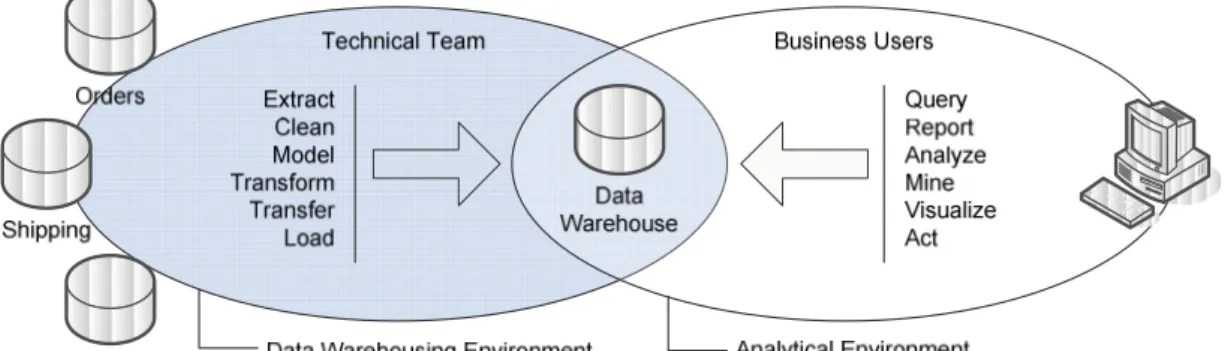
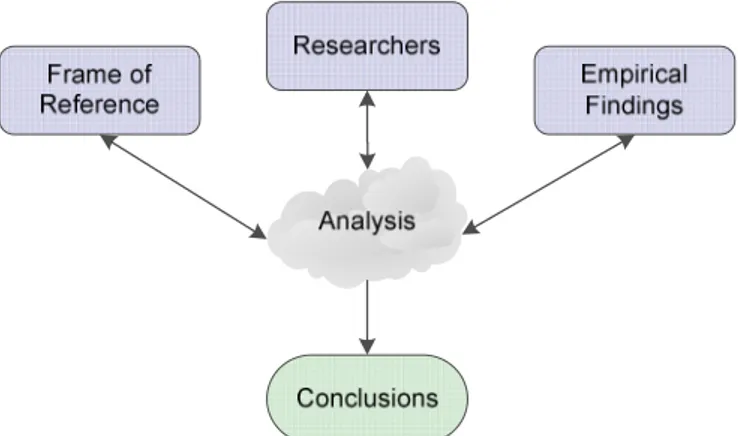
The connections between the theories in the frame of reference are shown in figure 3.1 and aims to clarify different parts in this chapter. It also illustrates different elements and the re-lationship between them. Gorry and Scott Morton’s (1989) well-known framework for management information systems (MIS) , which is widely present in the literature, serves as the core base. Elements that are included to support this framework are; Anthony’s (1965) description of managerial activities and Simon’s (1960) decision making model and deci-sions.These parts are explained more in depth for a better understanding of the framework. Eckerson’s (2003) BI environment is used to give an understanding of BI and its compo-nents. It is divided into two parts, one technical side and one analytical side. The data wa-rehousing environment contains data compiling from different source systems (also re-ferred to as ETL), information quality, and a data warehouse (DW). On the other side, the analytical environment describes decision support which is the outcome of BI systems (Eckerson, 2003). Intuition has also been identified because it has a great impact in deci-sion making processes (Hayashi, 2001). The final decideci-sion, made by a decideci-sion maker, is shown on the right side of the model.
BI is applied on top of Gorry and Scott Morton’s (1989) framework. By doing this, we will analyze if BI has contributed to changes in decision support. We will also examine if BI has had any impact on organizational decision making from an operational, managerial, and strategic point of view.
3.1 Business Intelligence
Today, BI is used as an umbrella term for describing computerized decision support sys-tems. However, BI evolved from DSS, a concept researchers started working on in the 1960s as computerized systems to assist in decision making and planning. As the develop-ment of new types of DSS continued, the scope of the concept expanded and branched to several different categories (Power, 2007). Power (2007) states that data-driven DSS in-volve access and manipulation of organizational, sometimes external and real-time, data. It could be simple files on a local machine or more advanced systems with additional func-tionality, such as a DW. These systems generally enable analytical functionality and analysis of historical data for support in decision making processes. “In general, business intelligence sys-tems are data-driven DSS” (Power, 2007). The Gartner Group introduced the term BI in the mid-1990s (Turban et al., 2007b). However, Watson (2005) states that BI is the result of a continuous evolution. “Just because it has a new name doesn’t mean it is necessary new” (Watson, 2005, p. 4). Davenport and Harris (2007) conclude the entire field of systems for decision support is referred to as BI.
However, Turban et al. (2007b) argue that BI evolved from DSS and their architectures have some similarities, but there are some differences between BI and DSS. First, BI is built with a DW and DSS do not need to include such a feature. BI is therefore better built to support larger organizations but DSS can support any organization. Second, BI is de-signed to support decision makers with timely and accurate information but indirectly while DSS is designed to directly support specific decision making. Third, BI was developed by software companies and DSS methodologies were mainly developed in the academic world. Fourth, BI is constructed to fit the organization and is constructed with commercially available tools while DSS targets unstructured problems and lots of programming is needed to support those complex problems. Fifth, BI focuses more on executive and strategic problems and DSS is constructed to support analysts. However, they are similar and con-sist of similar features such as data mining and predictive analysis. BI software has been changing and more decision support tools are built into the system. At present, BI and DSS are not the same but they have a close connection (Turban et al., 2007b). Based on the dis-cussion above, we agree with Turban et al. (2007b) and consider BI and DSS similar but not completely the same.
The definition of BI is also heavily discussed in the literature. We have found four different definitions of BI. Eckerson (2003, p. 1) defines BI as “BI solutions create learning organizations by enabling companies to follow a virtuous cycle of collecting and analyzing information, devising and acting on plans, and reviewing and refining the results. To support this cycle and gain the insights BI delivers, or-ganizations need to implement a BI system comprised of data warehousing and analytical environments”. In this definition Eckerson (2003) emphasizes collecting and analyzing data as well as using BI in an organization-wide setting. Eckerson (2003) has the only definition that includes data warehousing as the source for the data to be analyzed, which he claims to be crucial to gain the insights BI delivers. Bräutigam, Gerlach, and Miller (2006, p. 2) uses a similar definition but leave out data warehousing, “Business Intelligence is defined as getting the right information to the right people at the right time. The term encompasses all the capabilities required to turn data into intelli-gence that everyone in your organization can trust and use for more effective decision making”. Bräutigam et al. (2003) put emphasis on turning data into intelligence for all users in the organization to assist in more effective decision making. The third definition is from Turban et al. (2007a, p. 9), “BI’s major objective is to enable interactive access to data, enable manipulation of these da-ta, and to provide business managers and analysts the ability to conduct appropriate analysis”, which has a lot in common with Eckerson (2003) and Bräutigam et al. (2003). Turban et al. (2007a) discusses both the analysis of data for different users, on different organizational levels and
the use of the output. Loshin (2003, p. 6) uses a somewhat different definition, “The proc-esses, technologies, and tools needed to turn data into information, information into knowledge, and knowl-edge into plans that drive profitable business action. Business Intelligence encompasses data warehousing, business analytic tools, and content/knowledge management”, leaving out the organizational aspect. Based on the characteristics of these definitions we have developed our own definition of BI:
Using data warehousing and analytical tools, BI is extracting and analyzing relevant information and making it accessible to the right member as a support in decision making processes.A BI systems in-volves four different components: A DW, which contains business data extracted from dif-ferent sources in the organization; business analytics (BA), a collection of methods used to perform mining, manipulation, and data analysis; business performance management (BPM) which involves business monitoring and performance analysis; and finally user interfaces e.g., dashboards and reports (Turban et al., 2007b). Another dimension of the BI environment proposed by Eckerson (2003) illustrated in figure 3.2 show data sources that feed the BI system with appropriate data.
Figure 3.2 - The BI environment (Eckerson, 2003)
3.1.1 Data Warehousing Environment
The data warehousing environment shown in figure 3.2 in the left circle describes the BI environment from a technical point of view. Technical aspects such as retrieving informa-tion from different sources, the extract, transform, and load (ETL) process, and a DW (Eckerson, 2003). There are different sources that are used to retrieve data in order to feed the DW. Most commonly, data is sourced from multiple independent operational systems but also from external providers. It can also be retrieved from online transaction process-ing (OLTP) or an enterprise resource plannprocess-ing system (ERP). In some cases, even web data in the form of web logs is used to provide a DW with data (Turban et al., 2007a).
As a critical component in any BI, information quality plays a superior and important role. English (1999) asserts that there are two significant definitions of information quality, inher-ent and pragmatic. Inherinher-ent information quality is data accuracy and to what degree data represents the real-world objects. In contrast, pragmatic information quality is the useful-ness and value of data used to support processes and enable organizations to accomplish their objectives. Based on the two perspectives, English (1999) defines information quality and describes the phenomena as “consistently meeting knowledge worker and end-customer expecta-tions” (English, 1999, p. 10). In order to understand what information quality is, English (1999) asserts it is important to understand the concepts of data, information, knowledge
and wisdom. Data is basically raw material from which information is derived and it can be viewed as entities, attributes or facts. Information is when one knows the meaning of data and it becomes understandable. However, information quality in itself is useless, but under-stood, it leads to value for users. English (1999) describes that knowledge is when informa-tion becomes assimilated and has a meaning in a certain context. Wisdom is applied knowl-edge and an understanding how the knowlknowl-edge can be applied in different settings (Eng-lish, 1999).
The center of Eckerson’s (2003) data warehousing environment consists of ETL processes, used to prepare the DW with useful and appropriate data. In ETL processes, Extraction concerns gathering information from different databases and systems. Transformation is the process where the extracted data are converted into a form which can be placed into a DW or another database. Load concerns putting the data into a DW (Turban et al., 2007b). The core of BI is ETL since the process brings together and combines data from multiple source systems into a DW. This approach enables all users to work with a single set of data referred to as “a single version of the truth” (Eckerson & White, 2003, p. 4). If the ETL process is well-designed and executed, the organizational information is stored in one central loca-tion and organizaloca-tional members do not need to argue whether the informaloca-tion is correct (Eckerson & White, 2003). Therefore, organizations can use the information to improve key processes and as a competitive weapon. However, any issues regarding data quality need to corrected before loading the information into the DW. Poorly designed ETL proc-esses are difficult and expensive to maintain, change, and update (Turban et al., 2007b). The ETL process must be carefully planned and highlight that this is a critical and impor-tant part since the ETL design and development work consumes approximately 70% per-cent of the time spend in a BI project (Eckerson & White, 2003; Turban et al., 2007b). In the center of Eckerson’s (2003) BI environment, a DW is placed in order to store data for decision support. The DW can appear as a number of smaller data marts consisting of data for a single subject or area. Another repository for data is an operational data store (ODS) with constantly updated data that is aggregated from business operations. One of the most common repositories used is an enterprise data warehouse (EDW) which is a large scale DW that is used for decision support across the entire organization. The main purpose of a DW is providing consistent, integrated, nonvolatile collection of data in sup-porting managers in decision making processes (Turban et al., 2007b).
3.1.2 Analytical Environment
The right side in Eckerson’s (2003) proposed BI environment refers to business user activi-ties with a non-technical approach. The DW is used to support decision-makers with in-formation in different variances depending on types of area and use. Business users can vi-sualize, query, report, mine, analyze, and most importantly act on data in the DW. In some cases, more advanced ad hoc (on-demand) exploration of the DW can be performed by business users (Eckerson, 2003). Business analytics can be based on basic exploration of data or more advanced analytical environments for qualified users (Turban et al., 2007a).
3.1.2.1 Decision Support
Visualization is used to make data more understandable and clear to end users. Decision makers can browse the interface and analyze data in real time and examine organizational performance data (Eckerson, 2003). Spreadsheets are one of the most common end-user tools and it is often supported by three-dimensional visualization tools. Dashboards and scorecards are two important components in business performance management (BPM)
systems, also called corporate performance management (CPM) systems. Both concepts have a broader context in which organizational strategy is included and BI is a part of. A dashboard can consist of key performance indicators (KPI) which are pre-defined meas-ures critical and important to monitor. Scorecards are used to compare actual results with planned results, depending on pre-specified measures (Turban et al., 2007a).
Reporting can be divided into two categories, routine reports and ad hoc reports. Routine or standard reports are generated and distributed to relevant subscribers periodically. Fur-ther exploration of the data presented allows business users to perform analysis with meth-ods such as drill-down in order to find problem areas. However, reports can also be per-formed ad hoc. Meaning that significant, specified, and relevant data can be compiled and retrieved by business users (Turban et al., 2007a).
In the analytical environment, methods for drill-down, data mining, and queries can be supportive for decision makers. Drill-down analysis is a process where the level of granu-larity will result in more detailed data, excluding irrelevant and unnecessary data. Data min-ing is used where reports and queries are inapplicable. The data minmin-ing process is used to discover patterns that are impossible to interpret by humans, that can be of relevance and guide decision making. Queries can be performed with structured query language (SQL) and retrieve specific information determined by business users (Turban et al., 2007a).
3.2 Decision Making Processes
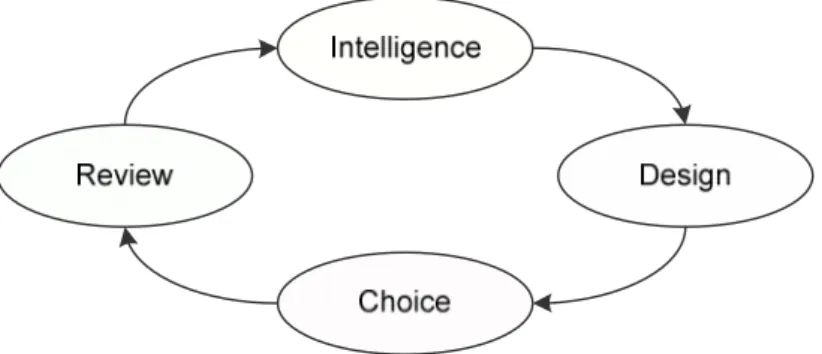
In the wide range of different decision types, Simon (1960) distinguishes two extremes, pro-gramed decisions and non-propro-gramed decisions. The term program is borrowed from, and used in the same way as in the computer world (Simon, 1960). A program is essentially a list of in-structions or strategies executed in a certain order (Schneider, 2003). Thus, programmed decisions are repetitive and routine. They follow definite processes or procedures which are well-known, defined, and do not have to be treated as new every time they occur (Simon, 1960). Examples of programmed decisions are: sending out invoices; reorder supplies; pay-ing a vendor. Non-programmed decisions on the other hand are unstructured and unusu-ally consequential. No best practice for handling the problem exists because the problem has not occurred before, the problem is of such complex nature, or the problem has such high importance that it requires additional attention and handling (Simon, 1960). The deci-sion to move manufacturing abroad or outsource the IT department are typical non-programmed decisions. Simon (1960) points out how decisions exist in every shade of gray in this spectrum and programmed and non-programmed are simply the far extremes. Although the scope and impact of a decision varies greatly from one level in the organiza-tional to another Simon (1960) argues that some generalization is possible. According to Simon (1960), decision making includes four distinct phases. The first phase is finding situ-ations for making a decision, intelligence. The second phase is referred to as design, where dif-ferent courses of action are investigated. In the third phase, one of the available courses of action is chosen. Simon (1960) calls this the choice activity. The fourth phase is a review, in which previous choices are evaluated. These phases are illustrated in figure 3.3 below.
Figure 3.3 – The decision making model (Simon, 1960)
3.2.1 Managerial Activity
Anthony (1965) describes managerial activities in two different divisions, planning and con-trol. The planning involves deciding what direction to take and the control means assuring that desired outcomes are obtained. Based on these two main divisions Anthony (1965) suggests three categories of managerial activities that he claims requires different ap-proaches when developing systems. The first category strategic planning, involves the process of deciding objectives; changes for the objectives; resources needed for the objectives and policies that govern acquisition, use, and disposition of resources. Management control is the process in which managers assure that resources are obtained and used efficiently in order to achieve the organizational objectives. The third category operational control encompasses that specific tasks are carried out efficiently. The main difference between management control and operational control is that management control is concerned with people and operational control with tasks (Anthony, 1965).
3.2.2 Management Information Systems
Gorry and Scott Morton’s (1989) framework for management information systems (MIS) suggest that such system is best used from a decision making perspective. MIS work does not always use a comprehensive approach, excluding organizational aspects that prevent full appreciation. This generates temporarily solutions and inefficient allocation of re-sources. The role of information systems in organizations is now focused on how systems can capture parts in the human decision making process. As a result, organizations have re-alized the potential of information systems, supporting sophisticated unstructured deci-sions (Gorry & Scott Morton, 1989).
The framework is based on managerial activities and should not be used to describe infor-mation systems. It is used only as a way to understand decisions made in organizations, in-formation systems should only exist to support decisions (Gorry & Scott Morton, 1989). The framework (figure 3.4) illustrates Anthony’s (1965) and Simon’s (1960) in combination which provides two perspectives used to examine problems and purposes of information systems activity.
The left side represents Simon’s (1960) programmable and non-programmable decisions. Gorry and Scott Morton (1989) call these two categories structured and unstructured deci-sions. The unstructured decision is where none of the three, intelligence, design or choice in Simon’s (1960) decision making model (figure 3.4) is structured. The complete struc-tured decision is where all three parts are strucstruc-tured and assists satisfactory decisions to be
made. Gorry and Scott Morton (1989) have added another dimension, semi-structured de-cisions that encompasses that one or two of the phases are unstructured. The conclusion is that above the horizontal line, largely structured decisions can be made with MIS. Deci-sions below the horizontal line are largely unstructured and supported by decision support systems (DSS) (Gorry & Scott Morton, 1989).
The top of Gorry and Scott Morton’s (1989) framework (figure 3.4) represents Anthony’s (1965) managerial activities. Strategic planning involves predicting the future of the organi-zation, consisting of a small group of high-level people in a non-routine environment which makes it difficult to assess quality in planning processes. Management control in-volves interpersonal interaction often driven by the strategic planning process. The opera-tional control category consists of execution of tasks, with less judgment and this is what distinct it from management control. It is important to be aware of that the distinction be-tween operational control, management control, and strategic planning is difficult to de-termine (Gorry & Scott Morton, 1989).
Managerial decisions that are below the line have a greater impact on the organization be-cause they normally deal with unstructured decisions. Improvements in understanding de-cisions will move the decision and it can be moved above the middle line and free up man-agers for other tasks. Structured decisions are as Gorry and Scott Morton (1989) describe them “organizational independent” which means they are almost the same in every organi-zation although details may differ. As decisions become semi-structured or unstructured the absence of routine procedures and lack of formalization between the parts in Simon’s (1960) decision making model increase. In order to improve quality of decisions it is impor-tant to have the right information input or change the entire decision process, or both. By improving quality of information input, quality of managerial decision making may in-crease. However, it will not have any major enhancements, since they rather need new un-derstandings or methods, to understand the information that is already available (Gorry & Scott Morton, 1989).
Gorry and Scott Morton’s (1989) implication of their framework suggest three different perspectives, system design differences, different organizational structure, and model dif-ferences considering Anthony’s (1965) managerial categories in mind. The first, system de-sign differences implies that since operational control and strategic planning have different objectives it is unnecessary to connect systems across boundaries since they do not have similar objectives. Secondly, organizational structure involves defining problems and must be dominated by managers involved in that specific area. Managers must also be analytical and reflective rather that procedural and communicative. Third, strategic decisions do not occur frequently and operational occur daily. This prove that models for decisions need to be different and work efficient, have access to current data, be structured, and be easy to change (Gorry & Scott Morton, 1989).
It should be mentioned that the activities within Gorry and Scott Morton’s (1989) frame-work in figure 3.4 are only examples of different activities. The activities do not have any-thing to do with the framework and organizations can apply its own activities as they wish. In this study we will use the original activities as examples to provide an understanding on what the framework could look like, when used in an organization.
Figure 3.4 - A Framework for Management Information Systems (Gorry & Scott Morton, 1989)
3.2.3 Intuition
Decision makers are sometimes excluding any form of logical analysis or rely only on in-formation. Instead, different modes, referred as “intuition”, “inner voice”, “gut instinct”, or “hunches” are used but decision makers have problems explaining the phenomena more in detail. Emotions may be essential and supportive in order to filter various options quick-ly, even if decision makers are not consciously aware of the screening themselves. How-ever, human nature can easily obscure by observing and recognize patterns where none ex-ists (Hayashi, 2001). According to Hayashi (2001), humans use patterns to find a pattern and refers to Herbert A. Simon who proves that experienced people chunk information so they can retrieve and store it easily. This because experienced and experts have the ability to “see patterns that elicit from memory the things they know about such situations” (Hayashi 2001, p. 179). Hayashi (2001, p. 179) further explains the phenomena by quoting AOL’s former president Robert W. Pittman “Staring at data is looking at a jigsaw puzzle. You have to figure out what the picture is. What does it all mean? It is not just a bunch of data. There is a message in there. Every time I get another data point I have added another piece to the jigsaw puzzle, and I am closer to see-ing the answer. And then, one day, the overall picture suddenly comes to me.”
Humans have to review themselves because they have a tendency toward overconfidence. This implies that humans overestimate their ability in just nearly everything. It is therefore important to find out if decisions and judgments were accurate, and the use of feedback
can be very important. Otherwise, we do not know if we made any mistakes and cannot learn or do anything about them. Because of this problem, it is very common that decision-makers use self-checking procedures to ensure that intuitive decisions are successful (Haya-shi, 2001). Another common method for intuitive decision making is cross-indexing. This means that information can be combined from different sources. Hayashi (2001) state that the amount of material used and can be cross-indexed enhances intuitional process. In or-der to clarify Hayashi (2001, p. 181) refers to former CEO Michael Eisner of the Walt Dis-ney Company who explains cross-indexing as “When you see a gas station sign or a certain forma-tion in the clouds” intuiforma-tion tells you something. Further on Eisner explains intuiforma-tion as “You use reams of historical information about yourself that you remember from when you were a child can pop into your mind. Gut instincts are the sum total of those experiences – millions and millions and millions of them. And that sum total enables you to make reasonable decisions.” (Hayashi, 2001, p. 183). Haya-shi (2001) concludes that intuitive feelings guide our decision making to a stage until our conscious mind is able to make good decisions.
4 Empirical Findings
In this part of the study we will present the empirical findings. All information from the in-terviews will not be presented since the introduction questions are not relevant for the study. The main focus in this chapter is to cover the interview questions (Appendix 1) re-lated to our research questions and the purpose of our report. We have conducted four in-terviews. Two interviews were conducted with system owners and the other two were con-ducted with people who work with IT management. Relevant part of the interviews will be presented below. After three of the interviews we got the opportunity to see the systems used and can therefore use this experience in our conclusion and analysis since we consider this as a relevant part of the empirical findings.
4.1 Husqvarna AB
Respondent and Position Lennart Dorthé, CIO
Jan Winblad, Application Manager – BI
Place and Date Huskvarna, 2007-11-22
Husqvarna offers products for consumers and professionals within three main product ar-eas: forestry, lawn and garden, and construction. With a presence in over 100 countries, Husqvarna employs more than 11,400 people world-wide. Their IT department, located in both Sweden and the US, is responsible for Husqvarna’s IT in every operating area throughout the entire organization. IT is divided in application areas with global responsi-bility for that application or concept. Huqvarna uses a “best of breed” strategy and buys the system they think will fit the organization’s needs best.
BI is nothing new in the Husqvarna organization. As one of the first organizations in Swe-den, Husqvarna started working with extraction of operational data from different sources and systems to an environment optimized for analysis, the foundation of BI. The IT de-partment first discovered the BI concept and saw the potential business value. They dem-onstrated it to a group of business users who became interested and wanted it imple-mented. Dorthé explains that they in the early stages focused on improving and streamlin-ing supply chain processes, since these processes use units and quantities which are less complicated to deal with. The next step was to include financial processes in their BI solu-tion, a more complex task with more factors to consider such as exact definitions of finan-cial measures, fluctuating currencies, and bonuses for sales people. “Providing decision makers with incorrect numbers that they use in their analysis and decision making is extremely dangerous” Win-blad explains. Dorthé points out that defining and agreeing on financial measures and KPIs is time-consuming and involves people all across the organization. Today, the most fre-quent users of their BI system are executives and controllers who use BI for strategic deci-sion making. However, BI is also used in different supply chain functions to analyze opti-mal replenishment levels.
Further, Dorthé explains that BI has changed Husqvarna’s business model. Before the BI system was implemented, reports were created throughout the organizations, in the facto-ries and sales companies, a manual process that in some cases took up to three months to complete. Now, this data is refreshed once a day and some data is refreshed as many as seven times daily. Production line managers have even expressed their wishes for expand-ing the solution to show real-time data. Winblad claims that this is not needed in most situ-ations. By analyzing financial information in the DW, top management gets a full picture of