9C-3D SEISMIC INTERPRETATION OF THE BAKKEN FORMATION, BANNER FIELD,
NORTH DAKOTA
by
A thesis submitted to the Faculty and the Board of Trustees of the Colorado School of Mines in partial fulfillment of the requirements for the degree of Master of Science (Geo-physics). Golden, Colorado Date Signed: Lillian R. Comegys Signed: Dr. Tom Davis Thesis Advisor Golden, Colorado Date Signed: Dr. Terry Young Professor and Head Department of Geophysics
ABSTRACT
The Bakken Petroleum System is a multi-reservoir play with estimated total undiscovered resources of 3.649 BBO oil and 1.85 TCF natural gas in the United States portion of the Williston Basin (Pollastro 2008). The presence of natural fractures in all three members of the Bakken Formation have been linked to high initial production (IP) and cumulative production from the Antelope Field and better reservoir potential in the Elm Coulee Field and Sanish Fields (Sturm and Gomez 2009; Honsberger 2012; Theloy 2011). Therefore, the ability of seismic data to determine the presence, orientation, and density of natural fractures is an important achievement for petroleum exploration and exploitation.
The STAMPEDE 9-component seismic survey is located in Mountrail County, North Dakota, in the Banner Field, southeast of the Parshall and Sanish Fields. It is the goal of the Reservoir Characterization Project to analyze the structural influences on reservoir properties in the STAMPEDE survey area using the compressional and pure shear seis-mic volumes supplemented by the public well information available on the North Dakota Industrial Commission website.
Fracturing induced by basement faulting and lithology changes is detectable using mul-ticomponent seismic data in the Stampede seismic survey. Shear wave splitting analysis delineates zones of different fracture orientation and density. These areas correlate to in-terpreted fault intersections and the predicted area of increased fracture frequency based on facies changes in the Middle Bakken Member and its mechanical stratigraphy. Wrench fault mechanics are at work in the study area, creating isolated convergent and divergent stress regimes in the separate fault blocks. Main fault interpretations are based on shear wave isochron mapping, wireline log mapping, seismic panel observations. Fracture inter-pretations were made on the analysis of shear time and amplitude anisotropy maps and the correlation of a P-wave Velocity Variation with Azimuth (VVAZ) map. The corroboration
of the shear time anisotropy with the VVAZ interpretation strengthens the interpretation of fractures present in the study area. Also, this provided an opportunity to contrast the sensitivity of these two methods to azimuthally anisotropic media. The methodology of this study can be used elsewhere to identify areas of increased fracture intensity and the the orientation of these fractures. This information can then be used to plan drilling locations and guide lateral paths.
TABLE OF CONTENTS
ABSTRACT . . . iii
LIST OF FIGURES . . . viii
LIST OF TABLES . . . xv
LIST OF SYMBOLS . . . xvi
LIST OF ABBREVIATIONS . . . xvii
ACKNOWLEDGMENTS . . . xviii
DEDICATION . . . xix
CHAPTER 1 INTRODUCTION . . . 1
1.1 Bakken Formation Exploration and Production . . . 1
1.1.1 Production from the Banner Field . . . 3
1.2 Objectives of Thesis Work . . . 10
1.2.1 Workflow . . . 11
1.3 Data used in Thesis Work . . . 11
1.3.1 Acquisition and Processing of Seismic Data . . . 12
CHAPTER 2 GEOLOGY OF THE BAKKEN FORMATION . . . 19
2.1 Facies of the Middle Bakken Member . . . 20
2.1.1 The Lower Middle Bakken: Facies A, B, and C . . . 24
2.1.2 The Middle Bakken Shoal: Facies D . . . 27
2.1.3 The Upper Middle Bakken: Facies E and F . . . 27
2.2 Faulting and Fracturing of the Bakken Formation identifying “Sweet Spots” . 28
2.2.1 Basement Faulting . . . 29
2.2.1.1 Wrench Faulting . . . 32
2.3 Wrench Faulting in the Bakken Formation . . . 35
2.3.1 Structural Curvature . . . 39
2.3.2 Hydrocarbon Generation . . . 39
2.3.3 Prairie Evaporite Dissolution . . . 42
2.3.4 Lithology of the Middle Bakken Member . . . 45
2.4 Discussion . . . 45
CHAPTER 3 FAULT INTERPRETATION . . . 46
3.1 Previous Research: Faulting in the Study Area . . . 46
3.2 Methodology . . . 47
3.2.1 Wireline Log Mapping . . . 47
3.2.2 Seismic Horizon Picking . . . 53
3.3 Seismic and Wireline Log Mapping Interpretation . . . 55
CHAPTER 4 APPLICATIONS OF MECHANICAL STRATIGRAPHY . . . 62
4.1 Vp/Vs as a Lithology Indicator . . . 63
CHAPTER 5 AZIMUTHAL ANISOTROPY ANALYSIS . . . 73
5.1 Alford Rotation . . . 75
5.2 Compressional vs. Shear wave Sensitivity to Fractures . . . 77
5.3 Previous Research: Seismic response of the Bakken Formation with natural fractures . . . 77
5.5 Sonic Scanner Interpretation . . . 81
5.6 Shear Time Anisotropy . . . 83
5.7 Shear Amplitude Anisotropy . . . 90
5.8 P-wave Velocity Variation with 2 Azimuths . . . 92
CHAPTER 6 CONCLUSIONS AND RECOMMENDATIONS . . . 98
6.1 Recommendations . . . 99
LIST OF FIGURES
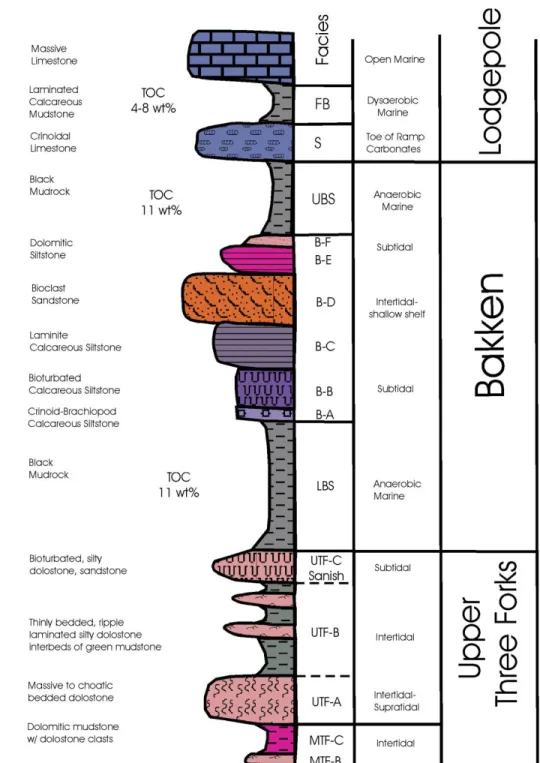
Figure 1.1 Bakken Petroleum System stratigraphy with brief descriptions of
lithology and depositional environment (Sonnenberg et al. 2011). . . 2 Figure 1.2 Normalized EUR data of the Elm Coulee Field, with overlain faults
interpreted using 3D seismic attributes at the Bakken and Winnipeg
Formations. (Honsberger 2013). . . 4 Figure 1.3 Location of the study area in respect to Parshall and Sanish Fields.
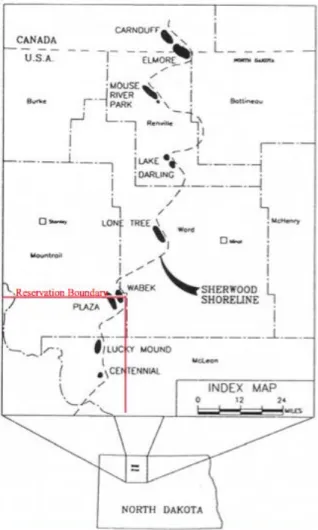
The Banner Field is the purple box and the STAMPEDE survey outline is indicated by the red rectilinear area. Bakken wells are annotated and Mission Canyon wells the white circles. . . 5 Figure 1.4 The Madison Formation Sherwood shoreline that is produced from in
fields adjacent to Banner Field (Reeves et al., 2004, modified from
Sperr et al 1994). . . 6 Figure 1.5 Isopach of the Bluell and Sherwood intervals of the Mission Canyon
Formation, cumulative produced oil and gas annotations. The Vecta-Nordquist, prior known as the Alenco-Nordquist well, was the only successful producer in the Stampede survey area, drilled through the targeted Sherwood shoal. The Orville-Nordquist, directly northeast, was drilled through tight dolomite mudstones. . . 8 Figure 1.6 Trapping mechanisms at play at Parshall Field. A thermal maturity
boundary is associated with the end of a pressure cell. Also the Middle Bakken Member shoal facies is absent within the Parshall Field,
allowing for increased dolomitization down-section and a corresponding increase in reservoir thickness. (Grau et al. 2011) . . . 9 Figure 1.7 Fold at near and far offsets, all azimuths. The red dashed line on each
figure is at the same location, indicating the difference in fold with
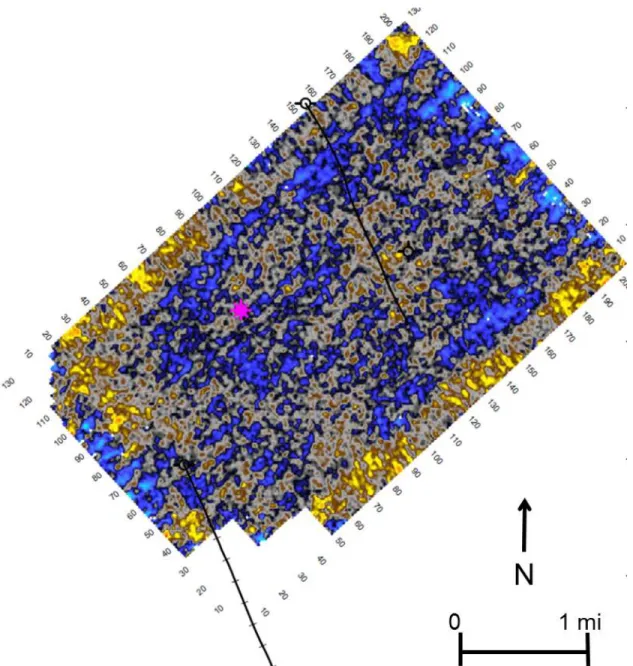
changing offset (Windels 2012). . . 13 Figure 1.8 P-wave amplitude slice on the Bakken horizon. Crossline striping
manifests the acquisition footprint. . . 15 Figure 1.9 Mistie:before (a) and after (b) correction (Windels 2012). . . 17 Figure 2.1 Different crustal provinces that compose the basement of the Williston
Figure 2.2 Areal extent of the Williston Basin with structural controls on basin
development. (Modified from Gerhard et al. 1990) . . . 21 Figure 2.3 Stresses on the Williston Basin from: (a) Rifting during the
Precambrian and (b) left-lateral movement on shear systems and
clockwise-torque response of the Williston Basin (Shepard 1990). . . 22 Figure 2.4 Stratigraphy column of the Williston Basin (Kuhn & Lawrence, 2012). . . 23 Figure 2.5 Paleogeographic map showing the location of the Williston Basin
during the Late Devonian. The Williston Basin (WB) and South
Alberta Basin (SAB) are notated (Blakey 2005). . . 24 Figure 2.6 Belize analog of depositional environment of the Middle Bakken
Member (modified from Grau et al. 2012). . . 25 Figure 2.7 Structural trends of the Williston Basin. (Modified from Gerhard et al.
1990) . . . 30 Figure 2.8 Aeromagnetic map of North Dakota, with the magnetic terranes
outlined. The boundaries of the magnetic terranes are believed to be large sutures, or fault systems. Mountrail County is outlined near the
western edge of the state (reproduced from Cobb 2013). . . 31 Figure 2.9 Lineaments (red) and basement faulting (black) interpreted from
surface expression, 2D seismic data, and lineament frequency based analysis. The location of the Banner Field is indicated by the red star
(modified from Anderson 2011). . . 32 Figure 2.10 (a) Total magnetic intensity and (b) horizontal gradient map of a
moderate resolution aeromagnetic survey maps of the Fort Berthold reservation. (a) is overlain with surface lineaments discerned from LandSat 7 and topography data. The outline of the Fort Berthold reservation is in red surrounding the majority of Lake Sakakawea. Banner Field is located on the northeastern edge, just outside of this
survey limit. (Reeves et al., 2004). . . 33 Figure 2.11 Plan view of a right-lateral strike slip system (Christie-Black and
Biddle 1985). . . 34 Figure 2.12 Wrench fault diagram illustrating the diverging-upwards shape of these
systems as well as the change in movement per fault that can occur from changes in the horizontal principal stresses (Christie-Blick and
Figure 2.13 Fractures associated with wrench faulting, and three orientation with
respect to the main strike-slip fault (Christie-Black and Biddle 1985). . . 37 Figure 2.14 Cross Section across the Nesson Anticline. (Gerhard et al. 1990) . . . 38 Figure 2.15 Map view of the Antelope Anticline with curvature and structural and
dip magnitude cross sections (Nordeng and LeFever 2011). . . 40 Figure 2.16 Bakken P-wave time structure. . . 41 Figure 2.17 Bakken S1-wave time structure, faults A-C overlain to show control on
velocity changes and resulting time structure. . . 41 Figure 2.18 Pore pressure gradient map with the “Line of Death” overlain. The
location of the Banner Field is indicated by the red dot (modified from
Grau et al. 2011). . . 42 Figure 2.19 Prairie salt collapse structure (modified from Hamid et al. 2005). . . 43 Figure 2.20 Isopach map of the Prairie Evaporite with the salt dissolution edge
superimposed. The location of the Stampede Survey area is indicated
with the red dot. (Sonnenberg 2012). . . 44 Figure 3.1 Faulting gathered from previous research. Location of faulting was
determined using gravity, aeromagnetic, seismic, and satellite imagery data. The Sherwood Shoreline Trend and Tmax 426 are also depicted, as indications of basement faulting and large scale “sutures”,
respectively. (Modified from Reeves et al., 2004; Anderson, 2011; Grau
et al., 2011) . . . 48 Figure 3.2 Aeromagnetic map of Mountrail County, North Dakota. Parshall and
Banner Fields are outlined in red; the Stampede survey is outlined in gray. Tmax 426 is indicated, note how this boundary follows the aeromagnetic high (warm colors) that define the border between the Western and Central Magnetic Terranes. Also overlain are the
lineaments interpreted by Reeves et al. (2004) based on aeromagnetic,
gravity, and LandSAT data. . . 49 Figure 3.3 Wireline log of the Bakken Formation at the St-Andes well. The Upper
and Lower Bakken members are identified by strong spikes in the
Figure 3.4 Wireline tops of the Middle Bakken Member: divided into a Lower Middle Bakken, Facies A and B, and an Upper Middle Bakken, Facies E and F. The division of these sections is indicated by the dashed green line. The wireline log of Parshall 2-36H Pilot is analogous to those in the STAMPEDE survey area; the shoal facies marked by the clean
gamma ray is absent (Grau et al. 2011). . . 51
Figure 3.5 Cross section through the STAMPEDE survey area to show the facies architecture of the Bluell and Sherwood shoreline trends within the Mission Canyon Formation of the Madison Group (Devault et al. 2007). . 52
Figure 3.6 P-wave synthetic. The Bakken Formation is indicated by the blue line. The seismic reflector that characterizes the Bakken is a trough that tunes with the lower Lodgepole Formation “False Bakken” and Scallion members, the Middle Bakken Member, and the Lower Bakken shale. . . 53
Figure 3.7 Shear wave synthetic. The Bakken is indicated by the blue marker, just below 3.5 seconds. . . 54
Figure 3.8 Event matching, horizons picked on the p-wave volume were guided by synthetic generation and the interpreted horizons of Sanish Field. The horizons above and including the Three Forks Formation were picked on the shear volume using synthetics, those below were picked by stretching and squeezing the image to correlate to the p-wave volume. . 55
Figure 3.9 Isochron of the Duperow Formation to the Base of Last Salt. The cross section shown in Figure 3.10 is overlain. . . 57
Figure 3.10 Cross section A: (a) PP and (b) SS11 sections. . . 58
Figure 3.11 Cross section A, interpreted using the S1 and isochron from the Duperow to Base of Last Salt. . . 58
Figure 3.12 Isopach of the Base of Last Salt to the Frobisher-Alida interval. . . 59
Figure 3.13 Cross Section B. . . 59
Figure 3.14 Cross Section C. . . 60
Figure 3.15 Time slices of the P-wave volume. . . 61
Figure 4.1 QEMSCAN mineralogical analysis on the cored Middle Bakken Member and Lower Bakken Shale of the Deadwood Canyon Ranch #43-28H well in Mountrail County, North Dakota (Simenson 2010). . . . 63
Figure 4.2 Wireline log and fracture count of the Middle Bakken Member as seen
in the ST-Andes 151-89-2413H-1 core. (Billingsley, 2011). . . 64 Figure 4.3 Isopach of Facies A and B of the Middle Bakken Member. Thickening
trend indicated. . . 65 Figure 4.4 Isopach of Facies E and F of the Middle Bakken Member. Thickening
trend indicated. Faults A and B also are overlain, the change in depositional center from the southern direction indicated in Figure 4.3 to the more northwesterly direction here is interpreted to result from
the uplift on the northeastern edge by these faults. . . 66 Figure 4.5 Vp/Vs map of the Three Forks to Base of Last Salt. . . 69 Figure 4.6 Vp/Vs map of the Duperow to Lodgepole Formation. . . 70 Figure 4.7 Error in intervallic Vp/Vs calculated using P-wave isochrons. The
reflectors directly above and below the Bakken pick averages ˜30 ms
(Meza 2008). . . 71 Figure 4.8 (a) P-impedance of the Sherwood Interval of the Mission Canyon
Formation and a (b) Vp/Vs map of the same interval calculated from the inverted Ip and Is (using the Sh volume). These maps are used to discern the facies architecture of the Sherwood Shoreline. The facies boundaries in (a) were interpreted from wireline mapping. Using the P-impedance alone does not show a difference between the producer
well Vecta Nordquist and the adjacent dry hole to the North. . . 72 Figure 5.1 Diagram of an horizontal transverse isotropic media. (a) Shear waves
split into polarizations parallel and perpendicular to fracture direction, and (b) P-waves are affected by HTI media based on source-receiver
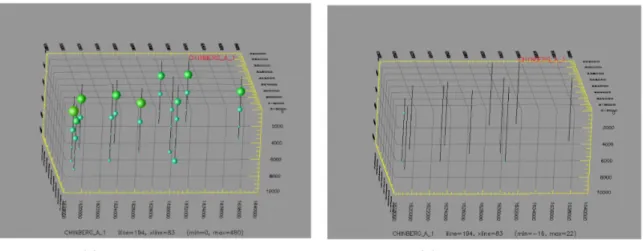
orientation. . . 74 Figure 5.2 The S1-S2 time lag for the Bakken horizon picked by Fairfield Nodal
processor, Rob Windels, over a 100-ms window around this reflector after the SS11 and SS22 data were rotated to N12E and N78W, respectively. The average time lag value for this S1 direction is 12.69
Figure 5.3 Difference plots from an isotropic model of the Bakken Formation, imaging the change in seismic response from an isotropic model when A) the Bakken shales have VTI, and the Middle Bakken Member is isotropic; B) the Middle Bakken Member is an HTI media, and the Bakken shales are isotropic; and C) the Bakken shales are VTI media coupled with HTI of the Middle Bakken Member. In all three cases the sedimentary rocks above and below the Bakken Formation are assumed to be isotropic. . . 80 Figure 5.4 Wedge model changing the thickness of the Three Forks Formation to . . 82 Figure 5.5 Isopach of the False Bakken to the Three Forks Formation. . . 82 Figure 5.6 Shear velocity of the fast (black) and slow (red) shear volumes), the %
anisotropy, and the fast shear azimuth of the sonic scanner associated
with the St. Andes well for the Bakken Petroleum System interval. . . 83 Figure 5.7 The entire section of logged data of the sonic scanner including the
shear velocity (fast=black, slow=red), the % anisotropy, and the fast shear azimuth. The large spike in the % anisotropy and the extremely low velocity values can be used as an indicator of the location of the
Bakken Formation. . . 84 Figure 5.8 Cat scan of the cored Bakken Formation at a depth of 9132 ft. A
fracture is identifiable at 9132’3”; it is indicated by the red arrow
(modified from ST-Andes well file). . . 85 Figure 5.9 Shear time anisotropy map from the (a) Three Forks Formation to the
Base of Last Salt and (b) Duperow to the Lodgepole Formation. Faults A,B,and C, and indicated with black dashed lines. . . 87 Figure 5.10 Gamma calculated using Thomsen’s equation for the interval from the
Top of the Three Forks Formation to the Base of the Last Salt in the
Charles Formation. . . 88 Figure 5.11 Layer-stripped shear time anisotropy maps for (a) the Three Forks
Formation to the Base of the Last Salt and (b) the Duperow to the
Lodgepole Formation. . . 89 Figure 5.12 Shear amplitude anisotropy for a 10-ms centered-gate window around
the Bakken reflector. Values are % Amplitude Anisotropy. . . 91 Figure 5.13 Zoeppritz 2.2 explorer model results showing the SV-SV and SH-SH
reflectivity responses for a non-fractured (S-fast) and fractured (S-slow) interface. . . 93
Figure 5.14 Fold map, P-wave data after acquisition footprint fixed. . . 94 Figure 5.15 Gathers of the P-wave azimuthal sectors. These images show the
different in data quantity per offset for both of the azimuths. . . 95 Figure 5.16 3x3 CDP Super-gather Stacks, Incidence angle 18-22 degrees. The
Bakken petroleum system is boxed in red. . . 96 Figure 5.17 Time (velocity) anisotropy for the N12ºE and N78ºW compressional
stacked volumes, faults overlain. . . 97 Figure 6.1 Diagram showing the interpreted faults, depositional thick of the more
brittle upper facies of the Middle Bakken Member, interpreted fracture clusters and the orientation of such fractures, and the recommended
LIST OF TABLES
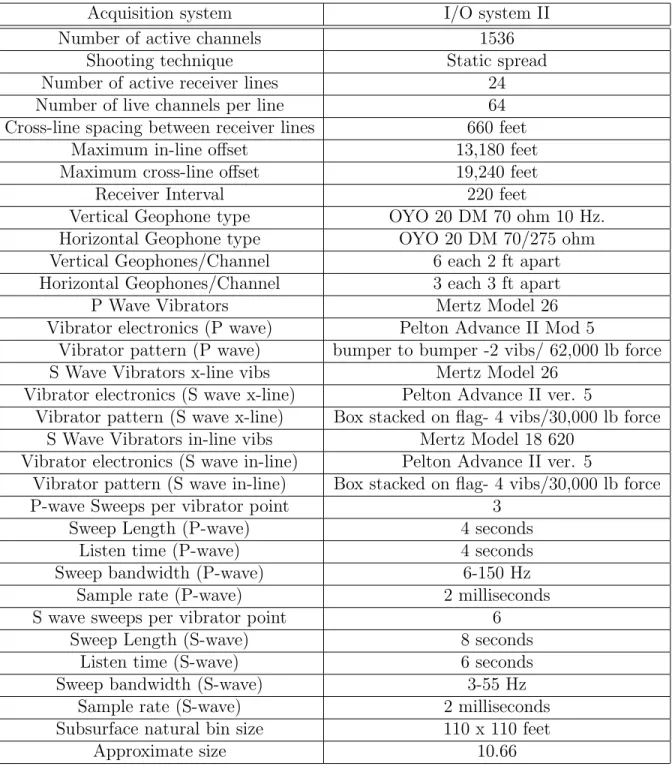
Table 1.1 Acquisition parameters for the Stampede 9C-3D seismic survey. (TRNCO 2009) . . . 14 Table 4.1 List of the elastic properties of the different mineral constituents.
(Tatham & McCormack 1991). . . 67 Table 4.2 Vp/Vs ratios of certain lithologies. These ratios are based off a 90%
confidence (Tatham & McCormack 1991). . . 67 Table 5.1 Parameters used in CREWES Zoeppritz 2.2 explorer program. . . 92
LIST OF SYMBOLS
Thomsen shear wave splitting parameter . . . γ Bulk density . . . ρ Definition of a limit . . . δ
LIST OF ABBREVIATIONS
Middle Bakken Member . . . MBM Velocity Variation with Azimuth . . . VVAZ Amplitude Variation with Offset and Azimuth . . . AVOAZ
ACKNOWLEDGMENTS
I would like to acknowledge my advisor, Dr. Tom Davis, and the other members of my thesis committee, Dr. Steven Sonnenberg and Dr. Walt Lynn. Other professionals that have helped me throughout the course of my research include Dr. Bob Benson (CSM), Rob Windels (FairfieldNodal), David Brumbaugh (Newfield Exploraton), Jeffrey Ross (Whiting Petroleum), and Heloise Lynn. Many people in both industry and at Mines contributed data and opinions with me, for which I am extremely grateful.
The students of the Reservoir Characterization Project and the Bakken Consortium have dedicated much time and advice. I would also like to thank the professors at College of Charleston, for initially inspiring a love for geology in me, and for encouraging me to pursue my interests in this field at graduate school and beyond. And lastly, my friends and family have always been there, whether it was pretending like they understood what I was saying while listening to me practice my consortium meeting presentations or helping me laugh away the stress of graduate school.
CHAPTER 1 INTRODUCTION
The Bakken Formation is a tight-oil shale play in the Williston Basin, consisting of organic-rich marine shales with TOC’s as high as 11 wt.% sandwiching a middle calcareous to dolomitic siltstone. The middle Bakken member is an unconventional reservoir with porosities ranging from 4 to 8%, permeabilities of 0.01-0.001 mD, and pressure gradients as high as 0.73 psi/foot (Billingsley 2011). This member is composed of several facies, deposited in shallow marine settings, that will be discussed more thoroughly in section 2.1. The Bakken Petroleum System, from a source rock perspective, includes the overlying Lower Lodgepole Formation within the Madison Group and the underlying Three Forks Formation in addition to the three members of the Bakken Formation (Figure 1.1).
1.1 Bakken Formation Exploration and Production
The historical success of hydrocarbon production from the Bakken Formation is depen-dent on fracture intensity of the Middle Bakken Member, facies lithology of the Middle Bakken Member, and improved completion design. Currently, the Bakken Petroleum Sys-tem has an estimated total undiscovered resources of 3.6 BBO oil and 1.8 TCF natural gas in the United States portion of the Williston Basin (Pollastro 2008). Recent reports from Continental Resources raised the estimated in-place liquid reserves of the Bakken by 56% to 903 BBOE based on a 4% recovery rate (Tyson 2012). With world class source rocks [TOC’s as high as 11 wt %], the Bakken shales have generated an estimated 400+ billion barrels of hydrocarbons (Grau et al. 2012).
From the onset of Bakken production in 1953, attempts have been made to identify the drivers of enhanced reservoir performance. Initial production was from vertical drilling on anticlinal features (e.g. the Antelope Anticline, the Nesson Anticline, and the Billings Anticline). Horizontal drilling began in 1986, targeting the Upper Bakken shale in the
Figure 1.1: Bakken Petroleum System stratigraphy with brief descriptions of lithology and depositional environment (Sonnenberg et al. 2011).
Billings Nose area, moving to the Elm Coulee Field targeting the middle Bakken from 2000 to present, and most recently to the Ross, Parshall, Sanish Fields, and many other fields. By comparing the production rates from the first 60-90 days of the field developments from 1953 to present day with curvature of the respective fields Nordeng and LeFever (2011) observed that recent increases in production were not the result of natural fracture systems, but of hydraulic fracture treatments of horizontal wells into the Middle Bakken Member. However, to increase the effectiveness of these treatments the current and paleo-directions of maximum horizontal stress and regions of increased fracture intensity should be known. Also, natural fractures as a reservoir performance enhancer should not be discounted.
The presence of natural fractures in all three members of the Bakken Formation have been linked to high IP’s and high cumulative production from the Antelope Field as well as recent production rates in individual wells greater than 2,000 BOPD (Sturm and Gomez 2009; Hayden 1984). In Sanish Field, wells that penetrate the fractured Middle Bakken Member have production rates up to 760% higher than non-fractured Middle Bakken Member wells (Theloy 2011). Increased fracturing in this area also raised permeabilities from an average 0.02-0.05 mD to 4.9 mD. The importance of natural fractures and faulting also plays a role in the Elm Coulee Field, Montana. As of the end of 2011, 115 MMbbls oil and 94 BCF natural gas had been produced from this field. With the use of 3-D seismic and extensive well data it was determined that faulting in the field defined compartments of similar EUR’s and reservoir potential, i.e. Original Oil-in-Place (Figure 1.2) (Honsberger 2013). Therefore, to make predictions on well performance the structural environment of a field is a necessary inquiry.
1.1.1 Production from the Banner Field
The Stampede seismic survey is located in the North Dakota portion of the Williston Basin, southeast of Sanish and Parshall Fields in Mountrail County (Figure 1.3). It surrounds the Banner oil Field. The Banner Field was initially drilled to exploit the Sherwood zone of the Mission Canyon Formation of the Madison Group. The white wells in Figure 1.3 are the
Figure 1.2: Normalized EUR data of the Elm Coulee Field, with overlain faults interpreted using 3D seismic attributes at the Bakken and Winnipeg Formations. (Honsberger 2013).
Mission Canyon wells. The Vecta-Nordquist well, originally named Alenco-Nordquist was originally a Mission Canyon producer and was later reentered with a lateral to exploit the Bakken Formation. The Sherwood shoreline trend as well as the Bluell shoreline trend are prolific reservoirs in the Madison Group. Four other fields in the vicinity of Banner exploit this play: Lucky Mound, Plaza, Prairie Junction, and Wabek (Figure 1.4). Banner Field is located southwest of Wabek Field and directly North of Lucky Mound Field. Wabek Field has produced 5.7 MMBO and 3.9 BCF from 1987 to present day, and Lucky Mound has produced 1.5 MMBO oil and 1.05 BCF from 1990 to present (Reeves et al. 2004).
Figure 1.3: Location of the study area in respect to Parshall and Sanish Fields. The Banner Field is the purple box and the STAMPEDE survey outline is indicated by the red rectilinear area. Bakken wells are annotated and Mission Canyon wells the white circles.
The complex stratigraphic variation of the Sherwood reservoir makes it a difficult explo-ration target. Reservoir-quality shoals are laterally constrained by restricted-shelf limestones
Figure 1.4: The Madison Formation Sherwood shoreline that is produced from in fields adjacent to Banner Field (Reeves et al., 2004, modified from Sperr et al 1994).
and tidal channels. Up-dip of the shoals are dolomitic lagoonal mudstones and sabkha an-hydrites. The targeted shoals are also intermittently cemented within the facies architecture (Devault et al. 2007). The Vecta-Nordquist successfully targeted the Sherwood shoal reser-voir, producing over 60,000 bbls oil and 21,600 MCF gas. Figure 1.5 shows the location of the producing well, the volumes produced annotated in green (oil) and red (natural gas), on an isopach map of both the Bluell and Sherwood Formations. Directly northeast of the Vecta-Nordquist (a.ka. the Alenco-Nordquist) the Orville Nordquist well only produced 261 bbls of oil from the tight dolomitic lagoonal mudstones of the Sherwood Formation. The Agnes S. Hoffman likewise encountered this less-prospective facies. No other well in the study area was successful. The Vecta-Nordquist well was reentered with a lateral deviation into the Bakken Formation and hydraulically fracture stimulated. Water was produced from the Middle Bakken Member.
Bakken Formation exploration in the Banner Field has been unsuccessful. Indeed, Bakken production is delineated by the eastern edge of the Parshall Field, an area where stratigraphic-diagenetic-maturtiy trapping mechanisms are at work (Figure 1.6). Figure 1.6 is a diagram of this trap. This schematic diagram depicts the limit of thermal maturity, a through-going fracture network, and Middle Bakken Member facies change. It has been hypothesized that the fracture trends in the Bakken could be a transfer system of mineral-ized brine that introduces cement to the reservoir, adding to the “trap” (Grau 2012). Katie Kocman, a current graduate student in the geology department at Colorado School of Mines hypothesizes that a calcite cement pore throat trap is on the Eastern edge of Parshall Field. She posits that this may be influenced by faulting. This question will hopefully by answered with the use of XRF, QEM Scan, XRD, and other petrographic analyses. Lineaments to the North and South may also act as fault-seal traps; this has been proven by the pressure differences in wells on either side (Grau et al. 2011).
The fault system on the eastern edge is believed to have significant control on heat flux and the resulting thermal maturity of the Bakken shales (Grau 2012, Cobb 2013). The
Figure 1.5: Isopach of the Bluell and Sherwood intervals of the Mission Canyon Formation, cumulative produced oil and gas annotations. The Vecta-Nordquist, prior known as the Alenco-Nordquist well, was the only successful producer in the Stampede survey area, drilled through the targeted Sherwood shoal. The Orville-Nordquist, directly northeast, was drilled through tight dolomite mudstones.
Figure 1.6: Trapping mechanisms at play at Parshall Field. A thermal maturity boundary is associated with the end of a pressure cell. Also the Middle Bakken Member shoal facies is absent within the Parshall Field, allowing for increased dolomitization down-section and a corresponding increase in reservoir thickness. (Grau et al. 2011)
Tmax 426ºC contour is a thermal maturity value, representing the onset of oil generation. This quantity is defined as “the temperature at which the maximum release of hydrocarbons from cracking of kerogen occurs during pyrolysis” (Grau et al. 2011). As the Bakken shales become immature hydrocarbon generation-induced microfracturing is not present and pressure increases as the strength of the Upper and Lower Members increases. This acts as a lithostatic pressure seal (Grau et al. 2011). Parshall Field is known as the most unique, highest production-per-well play in the Williston Basin. However, knowledge of the structural elements plays an imperative role for well placement, especially on the Eastern border of thermal maturity.
One must keep in mind, that knowledge of this unique diagenetic trap was only with the use of information gained from unsuccessful exploits. The North Dakota landscape is pocket-marked with wells East of the Parshall Field. Williston Basin drilling operations com-pound the difficulties of Bakken Formation exploration. High completion costs coupled with harsh winter-time weather and spring-time road conditions create difficult, slow production programs.
1.2 Objectives of Thesis Work
The objective of this thesis work are to: • Identify faults in the study area
• Determine if these faults were active during or after the deposition of the Bakken Formation.
• Analyze the Middle Bakken Member facies architecture in the study area, and deter-mine the controls on facies deposition.
• Link the facies architecture to areas of enhanced reservoir quality.
• Identify zones of increased fracture density, and denote the orientation of these frac-tures.
• Compare the fracture detectability of shear wave splitting analyses with a p-wave Velocity Variation with Azimuth procedure.
• Prepare a future course of action for the study of the Stampede dataset. 1.2.1 Workflow
Faulting and associated fracturing were identified in the study area with the use of wireline log and seismic data. The study was separated into three parts:
1. Identification of faults with the use of previous research, thickness anomalies using calibrated wireline log mapping, and isochron anomalies in the pure shear seismic data.
2. Prediction of areas of increased fracture susceptibility using the mechanical stratigra-phy of the Middle Bakken Member (Billingsley, 2011) and the facies changes mapped using Petra, and correlating these predictions with Vp/Vs maps.
3. Detection of fracture density and orientation using shear time anisotropy, shear ampli-tude anisotropy, and P-wave VVAZ (Velocity Variation with Azimuth).
1.3 Data used in Thesis Work
The RCP has access to several sources of data that were used in this thesis. The processed seismic data includes a wide-azimuth full-angle compressional stack, a fast pure shear stack, a slow pure shear stack, and two far-angle compressional stacks azimuthally sectored in the fast and slow shear directions. The North Dakota Industrial Commission (NDIC) offers a wealth of well data and wireline logs as well as GIS shapefiles of these wells, the seismic survey and oil field outlines, county boundaries, townships, reservation boundaries, etc. for mapping purposes. Instrumental to the success of this thesis work was the interaction of the author with the member of the Bakken Consortium of the Colorado School of Mines Geology department. SRA analysis was conducted on the shales of the ST-Andes core by
a student of this consortium, and another member provided the gravity and aeromagnetic data evaluated in section 3.1.
1.3.1 Acquisition and Processing of Seismic Data
The STAMPEDE dataset is a 9-C, 3D wide-azimuth survey covering an areal extent of 11.16 square miles; it is 4.08 mi long in the crossline direction and 2.76 miles in the inline di-rection. The survey has an inline azimuth of N48ºW. STAMPEDE was acquired by Dawson Geophysical for Vecta Exploration in 2003. The data were then licensed to Newfield Explo-ration. The Reservoir Characterization Project committed to reprocessing and interpreting the dataset to evaluate the Bakken Formation when Newfield Exploration became a spon-sor of the research conspon-sortium. STAMPEDE was originally shot to investigate the Mission Canyon Formation, particularly the Sherwood interval, overlying the Bakken and Lodgepole Formations. 9-C data were acquired with the objective of imaging the facies delineation be-tween grainstone shoal reservoirs and porous, impermeable, dolomitized lagoonal mudstones (Devault et al. 2007). This facies boundary is unidentifiable using solely compressional wave seismic response.
Nine-component data were acquired with two shear source orientations, a vertical P-wave source, and three-component geophones, i.e. two horizontal and one vertical. The static spread acquisition included maximum cross- and in-line offsets of 19,240 ft and 13,180 ft (respectively) with subsurface bin sizes of 110 x 110 feet (TRNCO Petroleum Corporation 2009). The STAMPEDE survey was acquired with 220 ft receiver and source intervals. The receiver line spacing is 660 ft, and the source line spacing is 1760 ft. These acquisition parameters and others are summarized in Table 1.1. The geometry was poorly shot sampled, introducing a problem within the azimuthal sectors. The fold varies with changing azimuth for a given bin as well as with changing offset; this appears as almost a sinusoidal variation in fold in the inline direction (Figure 1.7). This, in effect, causes a varying signal to noise ratio across the field and affects the reflection amplitudes. This “striped” amplitude pattern”, or acquisition footprint, is obvious on an amplitude slice at the Bakken in the P-wave data
(Figure 1.8). A red dashed line is was overlain on the same crossline location for both maps in Figure 1.7 to manifest the difference in fold for the different offset groups at the same location.
Figure 1.7: Fold at near and far offsets, all azimuths. The red dashed line on each figure is at the same location, indicating the difference in fold with changing offset (Windels 2012).
The processed data includes a P-wave amplitude, a fast and slow shear wave amplitudes, delta, epsilon, and V0 segy volumes. The delta, epsilon, and V0 volumes were picked on
a half mile grid. Delta and epsilon are Thomsen’s parameters. Delta is a measure of the difference of vertical to horizontal velocity; epsilon is the anisotropy that becomes apparent at far offsets, i.e. layer anisotropy. These parameters are used in the imaging process to correctly represent the volumetrics of a reservoir. They are based on VTI media and are calculated during the compressional volume processing (Lynn, H. 2012; Lynn, W., 2012).
Table 1.1: Acquisition parameters for the Stampede 9C-3D seismic survey. (TRNCO 2009)
Acquisition system I/O system II
Number of active channels 1536
Shooting technique Static spread
Number of active receiver lines 24
Number of live channels per line 64
Cross-line spacing between receiver lines 660 feet
Maximum in-line offset 13,180 feet
Maximum cross-line offset 19,240 feet
Receiver Interval 220 feet
Vertical Geophone type OYO 20 DM 70 ohm 10 Hz. Horizontal Geophone type OYO 20 DM 70/275 ohm Vertical Geophones/Channel 6 each 2 ft apart Horizontal Geophones/Channel 3 each 3 ft apart
P Wave Vibrators Mertz Model 26
Vibrator electronics (P wave) Pelton Advance II Mod 5
Vibrator pattern (P wave) bumper to bumper -2 vibs/ 62,000 lb force S Wave Vibrators x-line vibs Mertz Model 26
Vibrator electronics (S wave x-line) Pelton Advance II ver. 5
Vibrator pattern (S wave x-line) Box stacked on flag- 4 vibs/30,000 lb force S Wave Vibrators in-line vibs Mertz Model 18 620
Vibrator electronics (S wave in-line) Pelton Advance II ver. 5
Vibrator pattern (S wave in-line) Box stacked on flag- 4 vibs/30,000 lb force
P-wave Sweeps per vibrator point 3
Sweep Length (P-wave) 4 seconds
Listen time (P-wave) 4 seconds
Sweep bandwidth (P-wave) 6-150 Hz
Sample rate (P-wave) 2 milliseconds
S wave sweeps per vibrator point 6
Sweep Length (S-wave) 8 seconds
Listen time (S-wave) 6 seconds
Sweep bandwidth (S-wave) 3-55 Hz
Sample rate (S-wave) 2 milliseconds
Subsurface natural bin size 110 x 110 feet
Figure 1.8: P-wave amplitude slice on the Bakken horizon. Crossline striping manifests the acquisition footprint.
These data sets were not analyzed in this thesis work. The shear wave amplitude volumes were rotated -15° to N12°E and +75° to N78°W azimuths to parallel the maximum and minimum horizontal stress orientations, respectively, by the Alford Rotation method. The P-wave seismic data were reprocessed to create two azimuthally sectored, far-angle stacks in the N12°E and N78°W directions as well. The Alford rotation and P-wave sectoring processing will be discussed in Chapter 5.
The wide-azimuth P-wave and two shear volumes were processed using the same workflow, using a datum of 2200 ft and replacement velocities of 5500 ft/s and 2250 ft/s for the compressional and shear volumes. Departures from this flow for the individual stacks are discussed after the processing sequence.
1. Demux, 3D geometry, and trace edits 2. Refraction statics, true amplitude recovery
3. Surface consistent deconvolution, spectral balance 4. Velocity analysis
5. Surface consistent residual statics 6. Pre-stack migration
7. Normal moveout correction, 3D common midpoint stack 8. FX deconvolution, TX-Y dip filter enhancement
9. Bandpass filter, time variant scaling
In addition to the P-wave regular flow of processing an additional processing sequence on a half-mile grid was run to derive the Thomsen Parameters. That flow consisted of:
• CDP stack
• Pre Stack Isotropic Time Migration • Thomsen Parameter Analysis
A mistie volume was created using the formation tops provided by the NDIC website and the PSTM stacked P-wave data. Figure 1.9 is a comparison before and after correction of this volume.
(a) Mistie, uncorrected. (b) Mistie, corrected.
Figure 1.9: Mistie:before (a) and after (b) correction (Windels 2012).
The four components of the shear data, i.e. radial, transverse, and two cross-components, were processed individually to the point of CDP stacking. Hand statics were performed on the radial-channel common-receiver and shot stacks. While this method delivers the best continuity, it also compromised the structural integrity of the shear volumes (Windels 2012). S-wave static corrections were on the order of 100 ms or more (Windels 2012). An Alford rotation was performed to create SS11 and SS22 datasets in the N12°E and N78°W orientations, respectively, were put through the final processing steps (8 & 9). Crampin and Lovell (1991) commented on the problems introduced to shear data when acquired with surface to surface reflection surveys. The recorded split shear waves will be in the natural polarizations of the rock within a few wavelengths of the receivers. Therefore, if the direction of horizontal transverse anisotropy varies with depth, additional processing will be needed to
effectively remove the polarizations above the reservoir interval. This additional processing is known as layer stripping. While it has not been performed on the shear data to date; it is recommended for future evaluation of anisotropy of the Bakken Formation.
Exploration at this fine of a scale (the Bakken Formation is approximately 60 feet thick at 9,100 feet depth) requires accurate processing of both the compressional and shear wave volumes. Additional steps should be taken to improve the detectability of seismic data at the Bakken time-depth. Recommendations for future reprocessing include:
• Flex binning, 5-D interpolation, and/or Vector-Offset-Tile binning to remove the ac-quisition footprint.
• Layer Stripping of the shear data to remove shallow HTI signatures.
• More precise Alford Rotation methodology (discussed in detail in section 5.1.1). • Bandwidth extentions of pre-migrated data.
Improvements in seismic processing should be directed by increased geologic knowledge of the study area, both stratigraphically and structurally. A detailed time-depth stratigraphic profile can be used to refine velocity analysis, and interpretations of high-angle faulting can guide efforts to better image these features. With this in mind, a review of the literature on the sedimentological and structural influences of the Williston Basin and how these tie in to the STAMPEDE survey area will be presented next.
CHAPTER 2
GEOLOGY OF THE BAKKEN FORMATION
The Williston Basin has 16,000 ft (4900 m) of sedimentary cover underlain by several fault-bounded Precambrian terranes: the Archean Wyoming craton, the Proterozoic and Archean Trans-Hudson orogenic belt, and the Archean Superior craton (Figure 2.1) (Ger-hard et al. 1990; Cobb 2013). Rifting in late Precambrian created zones of fault systems, one the Montana Belt Basin trough, the other left-lateral, NE-SW, strike-slip faults known as the Brockton-Froid-Fromberg and Colorado-Wyoming Faults. These left-lateral faults bound the Williston Basin; transtensional forces between these faults are hypothesized as one cause for basin development (Figure 2.2)(Gerhard et al. 1990). Subsidence of the basin initiated during the Taconic Orogeny. During the Upper Cretaceous, island arc accretion on the west-ern North American margin structurally stressed the continent far inland, creating wrench and block faulting and compressional folding in the Williston Basin (Shepard 1990). These stresses were introduced by the clockwise torque of the basin resulting from movement along the Brockton-Froid and Colorado-Wyoming shear systems (Figure 2.3). Sedimentation has been affected by the wrench faulting and compressional forces, as well as the overall shape and depth of the basin. The Nesson and Billings anticline and Bismarck-Williston lineament were structurally active from the Middle Ordovician through Silurian ages and created thick-ness anomalies and diagenetic porosity zones at the crests of these features. Uplift of the Transcontinental Arch, the southern border of the the Williston Basin as shown in Figure 2.2, and subsequent negative movement of this feature, shifted the depositional center north to Canada then back to North Dakota-Montana for the Lower and Upper Kaskaskia sequence sedimentation, respectively (Gerhard et al. 1990). The Kaskaskia sequences are important petroleum-bearing sequences, including the Winnipegosis, Duperow, Three Forks, Bakken, and Madison units (Figure 2.4). Carbonate systems dominate the stratigraphic record until
the Pennsylvanian period, when the Absaroka sequence was characterized from detrital input from the uplifted Ancestral Rockies and the Canadian Shield (Gerhard et al. 1990). The stratigraphy of the Bakken Formation will be discussed in detail in the following section, for more information on overall Williston Basin stratigraphy, the reader is refered to Billingsley (2011).
Figure 2.1: Different crustal provinces that compose the basement of the Williston Basin (Anna et al. 2010).
2.1 Facies of the Middle Bakken Member
The Bakken Formation consists of upper and lower marine shales and a middle carbonate-siliciclastic member deposited by subtidal, shallow marine shoal and tidal flat settings. The formation was deposited in an equatorial epicontinental sea setting during the Up-per Devonian-Lower Mississippian (Figure 2.5). Figure 2.5 is a paleo-reconstruction to show the setting of the Williston Basin in this time period. The deposition of the Bakken lower shale marks a continental-scale transgressive event; correlative shales deposited by this same
Figure 2.2: Areal extent of the Williston Basin with structural controls on basin development. (Modified from Gerhard et al. 1990)
(a) Rifting (b) Shearing
Figure 2.3: Stresses on the Williston Basin from: (a) Rifting during the Precambrian and (b) left-lateral movement on shear systems and clockwise-torque response of the Williston Basin (Shepard 1990).
event include the Chattanooga, Exshaw, Woodford, and New Albany shales (Gerhard et al. 1990). Structural features such as the Nesson Anticline had significant impacts on the deposition of the Bakken Formation. Grau et al. (2011) use the coast of Belize as a modern day analogue for the deposition of the Middle Bakken Member east of the Nesson Anticline (Figure 2.6). In this model, the Middle Bakken Member is deposited in a restricted marine shallow, setting with sediment supply from the north (Grau et al. 2011, Simenson 2010). According to this model, the Nesson Anticline had significant control on Bakken Formation deposition. An anomalous thick of the Lower Bakken Shale east of the structure and north-west and down-dip of Parshall and Sanish fields is a large source rock kitchen, making these fields the migration target for generated hydrocarbons (Grau et al. 2011). The Nesson anti-cline restricted mixing of fresh marine water with lagoonal waters; however, it was low-relief and did not contribute detritus into the Middle Bakken Member. Because this constitutes the environment of the study area, discussion of the Middle Bakken Member facies will be related to this interpretation. For a stratigraphic column depicting the different facies, please
review section 1.1, Figure 1.1. The interpretation of three cores, the Fertile 1-12H, ST-Andes 151-89 2134H, and Dobrinski 1-44, by Simenson (2010) and Billingsley (2011) were also used to evaluate the eastward change in these facies in section 4.1.
Figure 2.5: Paleogeographic map showing the location of the Williston Basin during the Late Devonian. The Williston Basin (WB) and South Alberta Basin (SAB) are notated (Blakey 2005).
2.1.1 The Lower Middle Bakken: Facies A, B, and C
Facies A and B constitute the lower section of the Middle Bakken Member. Facies A is a crinoidal brachiopod muddy lime wackestone with intergranular porosity cemented by calcite and pyrite (Simenson 2010). Pyrite inclusions increase near the basal contact with the Lower Bakken Shale, where a shell-lag deposit is present. The facies is very thin, ranging from 1-5 ft (0.3-1.5 m) in thickness with an average 2.9 ft (0.9 m). This facies has an average core porosity and permeability of 4.5% and .0012 mD, respectively (Simenson 2010).
Figure 2.6: Belize analog of depositional environment of the Middle Bakken Member (mod-ified from Grau et al. 2012).
Facies B “consists of bioturbated, argillaceous, calcareous sandstones and siltstones” (Simenson, 2010). Helminthopsis and Scalarituba burrow traces are frequently identified in this interval. Porosity, both intergranular and microfracture, is hampered by calcite and pyrite cement and averages in cores 5.7%. Average thickness of the interval is 20 ft (6.1 m). The average core permeability is 0.0015 mD (Simenson 2010). Vertical, calcite cemented fractures are present.
Facies C is the primary reservoir target for Elm Coulee and Sanish Fields. Facies C is a very fine-grained, shaley sandstone and siltstone with planar and wavy laminations near the base of the section, grading into hummocky cross stratification in the upper section. Simenson (2010) interpreted the wavy laminations as being influenced by microbial colo-nization, making these stromatolitic laminations. Core porosities decrease from an average of 6.3% to 5.4% as the planar laminations give way to hummocky cross stratification. Core permeabilities increase upwards from averages of 0.0026 mD to 0.0079 mD (Simenson 2010). The entire interval has an average thickness of 10.5 ft; however, Facies C pinches out on the eastern edge of Sanish Field and is not present in Parshall or Banner Fields.
Facies A and B are interpreted as being deposited in offshore marine and lower shoreface settings, respectively (Simenson 2010). There is a lack of evidence for wave activity in both facies. Simenson (2010) interpreted Facies C as a lower-middle shoreface deposit, tidal and wave influenced. Facies A-C are part of the same highstand systems tract; the depocenter for this system is east of the and on the Nesson Anticline (Simenson 2010; Grau et al. 2011). Decreased biogenic clasts up-section has been interpreted as a development towards more hostile, restricted marine environments (Grau et al. 2011). Unique to Parshall Field, the Lower Middle Bakken is dolomitized where the Middle Bakken Shoal section (discussed in the following section) is absent. This diagenetic anomaly increases reservoir quality; permeabilities are an order of magnitude higher for dolomitized LMB samples.
2.1.2 The Middle Bakken Shoal: Facies D
Facies D grades from a contorted to massive, fine-grained muddy sandstone to a massive to laminated, light brown to light grey limestone (Simenson 2010). This facies can also be described as a skeletal grainstone or ooid grainstone. Frequent soft sediment deformation structures, i.e. micro-faults, microfractures, and slumps, are found in the lowermost section; however this interval is infrequently found. The upper section of the D facies has parallel to undulating to low angle cross-laminations (Simenson 2010). The upper interval has high intergranular porosity with a high abundancy of calcite cement. Calcite cement occurs from the dissolution of aragonitic shells and ooids (Grau et al. 2011). Core porosities increase from an average of 2.3% to 4.3% from the lower to upper interval, however, the upper interval has a range of porosities from 2.5%-12.8%. This facies is a tight non-reservoir rock.
Facies D is bounded by an erosional unconformity at the base and a flooding surface at the top of the interval. Simenson (2010) interpreted facies D as a middle shoreface, tidally-influenced channel deposited in longshore drifts parallel to the shoreline. This interpretation was attributed to Facies C by Grau et al. (2011), and Facies D was interpreted by those authors as a shoal facies, inconsistently distributed across Parshall Field. The presence of this facies acts as a barrier to diagenetic dolomitization of the Lower Bakken Member and reduces overall reservoir quality of the Middle Bakken Member.
2.1.3 The Upper Middle Bakken: Facies E and F
Facies E and F are the primary reservoir targets for Parshall Field. Facies E “consists of an interbedded dark grey, highly bioturbated siltstone, and light grey, very fine-grained, thin parallel laminated sandstone”, changing upwards to a fossiliferous dolo-lime wackestone (Simenson 2010). The lower section of Facies E has stromatolitic influence and is strongly dolomitized. Core porosities and permeabilities average 5.7% and 0.0062 mD, respectively for the lower section of Facies E. The upper section is rich with crinoid and brachiopod remains. Stringers of the stromatolitic section of Facies E is present throughout. The fossiliferous
section of Facies E is an attractive reservoir; one sample was reported to have a porosity of 3.3% and permeability of 0.0308 mD (Simenson 2010). Facies F is the uppermost facies of the Middle Bakken Member; it is a bioturbated dolomitic shaley-siltstone mottled with pyrite. This facies averages 1.5 ft (0.5 m) in thickness, with core porosities averaging 6% and permeabilities of 0.0482 mD. The entire UMB is reported to have average porosities of 6% and permeabilities of 4.2 mD.
Facies E is interpreted as a lower shoreface deposit, interspersed with fossil-rich storm deposits (Simenson 2010). Continuing along another highstand systems tract, Facies F is an offshore deposit, followed by the marine upper shale facies. This interval constitutes the most hyper-saline deposits of the Middle Bakken Member; lime muds and algal mats are prone to dolomitization.
2.1.4 The Bakken Shales: Facies G
Facies G is the identifier for the upper and lower shale members. The shales are brown to black, planar laminated, carbonaceous and bituminous mudstones with silt-size dolomites, calcites, and quartz. Pyrite is a common inclusion, either generally disseminated throughout the shale or occurring in laminations. Fractures are commonly pyrite- and calcite-cemented. 2.2 Faulting and Fracturing of the Bakken Formation identifying “Sweet Spots” Fracture mechanisms for the Bakken Formation include structural curvature, regional tectonics, hydrocarbon generation, dissolution of the underlying Prairie Evaporites, and facies lithology of the Middle Bakken Member (Murray 1968; Meissner 1978; Sonnenberg et al 2011; Hamid et al 2005). In many instances, it is a combination of these mechanics that affect a region, e.g. preferential movement of groundwater along fault zones can create a zone of Prairie Salt dissolution. Pre-exististing or continuously active faulting will produce structural curvature that causes facies changes towards the apex, diagenetic porosity enhancement, and increased strain post-lithification. The main processes are discussed as well as their locations of influence in relation to the STAMPEDE survey area.
2.2.1 Basement Faulting
The survey area is structurally located east of the Nesson Anticline in between the NW-SE trending Bismarck Shear and Coteau Lineament and directly south of the NE-SW striking Lonetree-Glenburn and Stanley trends (Figure 2.7). Other structural features significant to the study area include the Nesson Anticline, a transpressional wrench fault fold trending N-S, and the Mississippian and Pennsylvanian strand-line trends. As mentioned in the intro-duction to this chapter, the Williston Basin basement rock is composed of several provinces, i.e. the Wyoming craton, the Trans-Hudson orogenic belt, and the Superior craton. Using aeromagnetic data, North Dakota can be divided into four magnetic terranes: the West-ern Magnetic Terrane (WMT), Central MT (CMT), the Churchill-Superior Boundary Zone (CSBZ), and the Superior Craton. The boundary interpretations for these provinces were extrapolated to the project database from Cobb (2013) (Figure 2.8). These boundaries are interpreted as basement faults, with significant effects on depositional trends as well as salt dissolution. Mountrail County, outlined in gray in Figure 2.8 straddles the boundary be-tween the WMT and CMT. The CMT represents the Trans-Hudson orogeny, the accretion of several foreign territories. The Stampede survey area lies within this terrane.
The presence of lineaments and basement faulting in the study area is based on satellite imagery mapping, gravity data, and aeromagnetic data (Anderson 2011; Reeves & Billingsley 2004). Anderson mapped regional lineaments and basement faulting in Mountrail County on the basis of surface expression and 2D seismic data (Figure 2.9). The star is the location of the survey area. The existence and position of these features has been substantiated by 3D seismic and well data in Parshall and Sanish Fields (Ross 2012). Anderson used this analysis to determine two dominant trends of lineament and fault strike: NW and NE. Reeves and Billingsley (2004) used gravity, aeromagnetic, and 2D seismic data to confirm the presence of lineaments identified using LandSat 7 satellite imagery and delineate fault blocks in the Lake Sakakawea area. Figure 2.10 shows the results of the study. The warm colors in the total magnetic intensity images are higher magnitudes of magnetic susceptibility; this has
Figure 2.8: Aeromagnetic map of North Dakota, with the magnetic terranes outlined. The boundaries of the magnetic terranes are believed to be large sutures, or fault systems. Moun-trail County is outlined near the western edge of the state (reproduced from Cobb 2013).
been interpreted as upthrown fault blocks. The presence of these faults is corroborated by Figure 2.10(b); this is a gradient of the moderate resolution aeromagnetic map. What is most apparent are the magnetic lineations trending NE-SW, however inconsistencies or “breaks” in these anomalies are interpreted as faults. These faults appear to have a braided feature, trending NW-SE; this is characteristic of wrench faulting, as discussed in the following section.
Figure 2.9: Lineaments (red) and basement faulting (black) interpreted from surface expres-sion, 2D seismic data, and lineament frequency based analysis. The location of the Banner Field is indicated by the red star (modified from Anderson 2011).
2.2.1.1 Wrench Faulting
Strike slip faulting accommodates the lateral and oblique movement of two adjacent crustal blocks with respect to each other. Oblique movement of crustal block introduces divergent or compressive stresses into the overall strike-slip regime (Christie-Black & Biddle 1985). In map view, the principal displacement zone is linear or curvilinear (Figure 2.11). Deviations as small as 3 degrees from the linear path of a strike slip fault introduce exten-sive deformation as is illustrated in Figure 2.11. This deformation includes synthetic and
(a) Total Magnetic Intensity (b) Horizontal gradient of moderate resolution aeromagnetic data
Figure 2.10: (a) Total magnetic intensity and (b) horizontal gradient map of a moderate resolution aeromagnetic survey maps of the Fort Berthold reservation. (a) is overlain with surface lineaments discerned from LandSat 7 and topography data. The outline of the Fort Berthold reservation is in red surrounding the majority of Lake Sakakawea. Banner Field is located on the northeastern edge, just outside of this survey limit. (Reeves et al., 2004).
antithetic strike-slip faults, normal and reverse faults, and folding. These structures create oversteps, branching, and braiding features, and can also manifest as en echelon faulting (Jansen 2005; Asgarov 2004). Synthetic faults form at angles of 10-20° or less to the di-rection of strike-slip, and antithetic faults form at angles of 70-80° to the system (Asgarov 2004). En echelon faulting, or step-overs, can connect the main strike-slip faults; these are parallel, short, overlapping or underlapping faults obliquely oriented to the direction of main displacement (Christie-Black & Biddle 1985). En echelon faults sometimes have a displace-ment sense opposite of the main system; the step-overs may be right lateral strike-slip in a left-lateral strike slip system (Jansen 2005). These multi-oriented faults can create an extremely complex system of deformation in a narrow zone.
Wrench faults are prominent strike-slip faults that extend from a narrow, sub-vertical displacement zone at depth, usually as deep as igneous or metamorphic basement rocks, to a more laterally extensive, divergent zone of deformation in the sedimentary cover (Fig-ure 2.12)(Christie-Black & Biddle 1985). This upper divergent zone is composed of fault splays are created as isolated features in the more shallow zones that eventually join with the main wrench fault; these create “flower structures” or “palm tree structures” (Christie-Black & Biddle 1985; Jansen 2005; Asgarov 2004). The splays of a wrench fault can be composed of both normal and reverse faults in the same profile. The magnitude of slip and direction of slip can change for different horizons for the same fault, i.e. one fault splay can change from a normal to a reverse fault up-section. Alternatively, this change in fault direction can change laterally; a single horizon can be upthrown at one location of the fault and downthrown at a successive location. According to Christie-Black and Biddle (1985), there are five commonly observed sets of fractures: (1) synthetic strike-slip faults, (2) anti-thetic strike slip faults, (3) secondary synanti-thetic faults, (4) extension or tension fractures, and (5) faults parallel to the principal displacement zones (Figure 2.13). The structural style of wrench fault system and resulting fracture types is influenced by the rotation of fault blocks, introducing convergent or divergent stresses to linear strike-slip faults. Additionally, the rotation and resulting stress regime of one fault block may not translate to adjacent fault blocks (Christie-Black & Biddle 1985). Deformation may be localized to a narrow range adjacent to the strike-slip fault. The simplest pull-apart basin is characterized by subsidence parallel to the strike of the main fault on the very edge of the fault. Fracturing tends to be most intense at fault intersections, where stress variations are high (Jansen 2005). Increased fracturing at fault intersections has been observed using shear wave splitting analysis coupled with fault interpretation and production data (Jansen 2005).
2.3 Wrench Faulting in the Bakken Formation
Wrench faulting is a common deformation mechanism in the Williston Basin. Faulting, sediment draping, and transpressional forces create subtle, low-relief features such as the
Figure 2.12: Wrench fault diagram illustrating the diverging-upwards shape of these systems as well as the change in movement per fault that can occur from changes in the horizontal principal stresses (Christie-Blick and Biddle 1985).
Figure 2.13: Fractures associated with wrench faulting, and three orientation with respect to the main strike-slip fault (Christie-Black and Biddle 1985).
Nesson Anticline and Cedar Creek Anticline. These features can be complex; the Nesson and Cedar Creek anticlines are both formed by faults with episodes of fault reversals in a relatively continuous history of deformation (Gerhard et al. 1990). Lineaments in Parshall Field have been periodically reactivated, most recently by the isostatic rebound of the crustal post-glacial melting (Grau et al. 2011). Figure 2.14 is a cross section across the Nesson Anticline. Multiple faults compose this positive relief structure, and there are multiple changes in slip-direction per-fault. Left-lateral motion along strike-slip faults in the Williston Basin should not be assumed, even when previous directionality of motion is indicated. Lateral movement reversal is common for structures in the Williston Basin, and the dominant sense of motion is uplift (Gerhard et al. 1990).
Shepard (1990) associates wrench faulting with the creation of tension fractures in an average of 4 mile-wide zones. These fractured regions have increased hydrocarbon recovery factors; they introduce permeability in an intergranular porosity-poor reservoir. Basement and wrench faulting also plays an important role in hydrocarbon migration. Bakken-sourced oils in the Madison Group are not radially diffused, but travel along fracture sets introduced by basement faulting and connected shallower zones of weakness.
2.3.1 Structural Curvature
Murray (1968) studied the effect of structural curvature on production at the Antelope Field. He found that the 500,000 bbls of oil from the Sanish pool was produced from a 2 ft fractured interval. Fracture density was linked to the intensity of structural curvature (Figure 2.15). Also, this showed the Bakken shales to have pervasive hydrocarbon saturation, meaning that synclines are as attractive prospects as anticlines. Structural curvature was originally not considered a factor in the Stampede Field after analysis of the P-wave Bakken time structure map (Figure 2.16). This shows a gradual time-dip to the Northeast. However, the shear-wave time structure maps have more rugged features (Figure 2.17). The faults interpreted in Chapter 3 are overlain on Figure 2.17; it does appear that there is some control on the time structure response from these features. Well control is too limited to show the detail of the top-Bakken structure in the survey area, so it must be assumed that the structures manifested by the shear wave data is a factor of the wave-train sensitivity to faulting.
2.3.2 Hydrocarbon Generation
Meissner (1978) identified hydrocarbon generation as another mechanism of fracturing within the Bakken. The process of kerogen converting to oil creates an abnormally high pressure cell, like the one in the Parshall Field area (Figure 2.18), within the Bakken and the creation of a fracture network. This network allows for the migration of hydrocarbons to the middle Bakken as well as the underlying Three Forks and overlying Madison group. The dolomitization and resulting enhanced reservoir quality of the entire Middle Bakken Member in Parshall Field makes this middle unit suitable for super-charging and increased pore pressures (Grau et al. 2011). Figure 2.18 is a pore pressure gradient map showing the Parshall pressure cell with the Tmax 426°C, or “Line of Death” overlain. This line represents the up-dip maturity edge, where hydrocarbon-generation induced microfracturing of the Bakken shales are absent, and the shales are effective pressure seals for the system
Figure 2.15: Map view of the Antelope Anticline with curvature and structural and dip magnitude cross sections (Nordeng and LeFever 2011).
Figure 2.16: Bakken P-wave time structure.
Figure 2.17: Bakken S1-wave time structure, faults A-C overlain to show control on velocity changes and resulting time structure.
(Grau et al. 2011). As you can see, the Stampede survey, indicated by the red dot, lies outside of this line, the Bakken shales are immature and thus do not have the fracturing network associated with hydrocarbon generation.
Figure 2.18: Pore pressure gradient map with the “Line of Death” overlain. The location of the Banner Field is indicated by the red dot (modified from Grau et al. 2011).
2.3.3 Prairie Evaporite Dissolution
Prairie evaporite dissolution can cause local slumping and intense fracturing in the Bakken Formation. Figure 2.19 is a 2D seismic line taken over Weyburn Field, Saskatchewan,
Canada. This image shows deep rooted vertical faulting, and collapse structures through the Mississippian, Triassic, and Jurassic lithologic intervals. Above the Bakken Formation, sediments thicken in response to evaporite dissolution, indicating contemporaneous deposi-tion (Hamid et al. 2005). Therefore, thickness anomalies can be used as proxies for fracture investigation in a two-fold sense. Dramatic thins in the Prairie Formation or thicks in over-lying sediments can pinpoint the location and timing of such events (Cobb 2013). However, Prairie evaporite dissolution is not a factor in the Stampede area, which lies within the bor-der of the salt dissolution edge (Figure 2.20). Also evident from Figure 2.20 is the lack of “bullseye” features that mark areas of salt dissolution.
Figure 2.20: Isopach map of the Prairie Evaporite with the salt dissolution edge superim-posed. The location of the Stampede Survey area is indicated with the red dot. (Sonnenberg 2012).
2.3.4 Lithology of the Middle Bakken Member
Fracture frequency is also controlled by lithology in the middle Bakken member and is therefore facies-dependent. As stated earlier, Simenson (2010) delineated six different facies: A-F. Middle Bakken member facies were mapped by Simenson (2010) using the four wells in the survey area extending through the Bakken: St-Andes-151-89-2413H-1, Robert Andes 24-1, St-Nomeland-150-89-0235H-1, and Vecta Nordquist. As pointed out by Billingsley (2011), determination of the facies without the use of GR, NPHI, DPHI, and resistivity curves combined is difficult. Additionally, the absence of facies D, as is the case in the survey area, as a strong marker can introduce error into the facies interpretation. Once facies are determined, the inherent brittleness of each facies and diagenetic control on the petrophysical properties of the members can be evaluated for increased fracture frequency. Billingsley (2011) evaluated the mechanical stratigraphy and the effects of dolomitization of the Middle Bakken Member to infer lithology-controlled fracturing in the Stampede survey area.
2.4 Discussion
The structural interpretations of the Williston Basin and more specifically, Mountrail County and the Fort Berthold Reservation, has been discussed at length in this chapter. This information was combined to create a focused structural image of the study area. This will then be built upon using the available seismic and wireline log data. Fault identification through the analysis of isopach, isochron, time slices, seismic sections, and well cross sections is discussed in Chapter 3, and the locations of these interpreted faults are then used to create a predictive model of increased fracture intensity based on sedimentary deposition influence and zones of increased strain.
CHAPTER 3
FAULT INTERPRETATION
The identification of faults in the Williston Basin is a difficult process. Low-displacement wrench faults are discernible on seismic data mostly with the use of such attributes as curvature or coherency. These attributes are run on events that exhibit strong reflectivity. Additionally, faulting at the Bakken level is difficult to interpret. The seismic horizons picked at the Bakken show little lateral disturbance in time structure or abrupt amplitude change. Jansen (2005) noticed a lack of significant fault breaks through the upper shale seals in Rulison Field, Colorado. However, faulting continued above and below the shale interval. The shales healed after fault deformation or experienced flow deformation in the first place due to the ductile properties of the shales. This deformation style left no structural trace at the seismic scale. The Bakken shales could have experienced similar style deformation. Therefore it is through the analysis of other reflectors in the seismic data, in conjunction with faults mapped by aeromagnetic and satellite imagery interpretation that a reasonable fault interpretation can be made.
3.1 Previous Research: Faulting in the Study Area
Previous research has reported on faulting in the area, interpreted from LandSAT, aero-magnetic, gravity, and seismic data (Reeves et al., 2004; Grau et al., 2011, Anderson, 2011). These interpretations were combined to create a complete structural picture of the region prior to the observations of the RCP (Figure 3.1). Figure 3.1 not only shows the struc-tural complexity of the area, but also the dominant fault orientations: NE-SW and NW-SE. Included in this figure are also the Sherwood shoreline trend and Tmax 426°C line. The Sherwood shoreline trend is a relevant indication of faulting as the play type is a strati-graphic on-lap on a basement high coupled with a porosity pinch-out. It has already been noted that the Tmax 426°C structurally follows a large fault system or “suture” that extends