DEGREE PROJECT, IN COMPUTER SCIENCE , FIRST LEVEL
STOCKHOLM, SWEDEN 2015
Distributed Graph Mining
A STUDY OF PERFORMANCE ADVANTAGES IN
DISTRIBUTED DATA MINING PARADIGMS
WHEN PROCESSING GRAPHS USING
PAGERANK ON A SINGLE NODE CLUSTER
Distributed Graph Mining
A study of performance advantages in distributed data mining paradigms when
processing graphs using PageRank on a single node cluster
Alan Abdlwafa Henrik Edman
Royal Institute of Technology DD143X, Bachelor’s Thesis in Computer Science Supervisor: Danupon Na Nongkai Examiner: Örjan Ekeberg
Abstract
Distributed data mining is a relatively new area within computer science that is steadily growing, emerging from the demands of being able to gather and process various distributed data by utilising clusters. This report presents the properties of graph structured data and what paradigms to use for efficiently processing the data type, based on comprehensive theoretical studies applied on practical tests performed on a single node cluster. The results in the study showcase the various performance aspects of processing graph data, using different open source paradigm frameworks and amount of shards used on input. A conclusion to be drawn from this study is that there are no real performance advantages to using distributed data mining paradigms specifically developed for graph data on single machines.
Sammandrag
Att utvinna distribuerad data är ett relativt nytt område inom datatekniken och ständigt växande, framkommen ur kraven på att kunna samla in och bearbeta olika distribuerad data genom att användning av kluster. I denna rapport presenteras egenskaper hos data med grafstruktur och vilka paradigmer som bör användas för att effektivt behandla den datastrukturen, baserat på omfattande teoretiska studier tillämpade på praktiska tester som utförs på kluster med en nod. Resultaten erhållna i studien visar de olika prestanda erhållna från bearbetning av grafdata genom att nyttja paradigmer med öppen källkod och olika antal beräkningsintervaller. En slutsats som kan dras av denna studie är att det inte finns några praktiska fördelar med att använda paradigmer avsedda för distribuerad grafdata på enskilda beräkningsenheter, gällande tidsprestanda.
Chapter 1 - Introduction
Significant advances in computing and communication have been made over the last few years. Extensive amounts of raw data, consisting of various information, are generated daily. In 2008, the company Google alone processed several petabytes every day (Dean & Ghemawat, 2008). Many organisations have realised the value of collecting and analysing this data, also known as
mining. The term data mining can be described as: “the process of secondary analysis of large databases aimed at finding unsuspected relationships which are of interest or value to the database owners” (Hand, 1998). Granted, much of this raw data is not obviously interesting nor useful at first sight, but valuable information can be extracted and furthermore, conclusions can be drawn from it and its related statistics when analysed. This presents great opportunities for improvement within all kinds of digitally implemented platforms, from user experience to optimisation of various aspects in many systems and products.
The importance of data mining has steadily increased over the years, as social and corporate platforms have moved the majority of their platforms to digitally implemented solutions, such as social platforms, softwares and individual websites on the internet. Important information is now stored into databases, thus making it easier to maintain; the human effort is effectively translated into automatic operations conducted by the computational power in machines. Completely new possibilities emerged from this information movement, resulting in a steadily increasing flow of data, which potentially hides valuable information on how to further evolve and optimise various systems. This analytic application of digital processing of gathered data came to be recognised as the formal term Business Intelligence. This widely used term was founded in 1989 by an analyst at the Gartner Group, Howard Dresner, as an umbrella term to describe: “concepts and methods to improve business decision making by using factbased support systems” (Power, 2007). It became clear that Business Intelligence was of high importance and widely put into use as a strategic technology within corporate organisations (Watson & Wixom, 2007).
As this raw data is further on processed into valuable information, there are many areas of interest to take into account, fully dependant on what kind of data was gathered in the first place. For instance, data mining is essential for development within the machine learning and pattern recognition area. Patterns that are extracted from raw data during the mining process are utilised in different pattern discovery algorithms. Important categories emerging from this pattern discovery technique are genetic algorithms and neural networks, among many other areas (Bose & Mahapatra, 2001). This way of acquiring and mining data has also stimulated the implementation of huge databases that can be used as a basis when performing major statistical analyses. This resource is of high importance when conducting statistical surveys within the fields of chemistry, medicine, biology, particle physics, banking and social fields, among several others (Hand, 1998).
1.1 Problem Statement
Taking the background of data mining into account and the implementation of different existing distributed data mining paradigms running primarily on large clusters, the problem will be formulated as:
● Are there any advantages to using a graphspecific distributed data mining paradigm, over a regular distributed data mining paradigm, for the PageRank algorithm in single node clusters applied on graph data?
1.2 Purpose
It is somewhat relevant for the distributed data mining field of research to conduct a comprehensive study on a cluster of much smaller scale than usual—in this case on a single machine—in order to further on be able to conclude the main performance advantages, if any, of paradigms that specifically deal with graph structured data. Several available scientific papers and reports within the area of distributed data mining have conducted experiments and research on performance aspects of many different paradigms on large clusters, in many cases containing several thousands of machines. According to the research, an evaluation of performance aspects between different paradigms running on clusters of small scale is yet to be conducted.
There are many open source and easily implemented frameworks available today for smaller scale operations and businesses, which enhances the purpose of performance evaluations on clusters of different scales, from small to large ones. More specifically, this raises the need of the comparison between paradigms that are developed to deal with different kinds of data structures, ran on small scale clusters. When it comes to processing data on clusters of this small scale, the performance differences might vary compared to performances evaluated on large scale clusters.
Chapter 2 - Background
Centralised warehouses are commonly used to store and process data. However, because of the huge amounts related to data mining nowadays this has become fairly unrealistic (Tsoumakas & Vlahavas, 2009). The raw data is already distributed among many different sources, and transferring everything to a central location takes time. Processing this data centrally is also incredibly time consuming, as it can be processed more efficiently if smaller packages of information are sent to different machines to be processed separately.
Dean & Ghemawat (2008) explains that Google employees used many different specialpurpose implementations to process the large amounts of data. Even though they were rather straightforward, the input was often so large that computations would have to be distributed over many different machines within clusters, in order to finish within a reasonable time frame. This was a very complex way to deal with the raw data.
2.1 MapReduce
Google designed a new paradigm to deal with the complexity of mining data, called MapReduce. This focuses on the main objective of gathering and processing data distributed across several different machines and assign processes to clusters in a much more efficient way. The key efficiency lie in the way of handling all the involved resources, mapping, and the fault tolerance taken care of. This is also a unified model that works independently from the system scales or traits (Yang & Sun, 2011). The paradigm is mainly founded on inspiration taken from the programming language Lisp, which includes the functions map and reduce. This was the result of a realisation made by Google, as many process computations applied map operations on the input data (Dean & Ghemawat, 2008).
Figure 1, process during MapReduce execution.
The map and reduce functions are specified by the user. The number of tasks is set so that the input files are split into 1664 megabyte (MB) pieces. There are M map tasks and R reduce tasks and commonly M > R. After the input has been split up into manageable chunks, copies of the program are started on a cluster of machines. One of these copies is the master, which assigns all the work for the rest, the workers. The worker parses key/value pairs (fig. 2) from the input and passes it to the map function. The output of the map function will consist of intermediate key/value pairs to be processed further on. Figure 2, simplified sample code for map function.
The locations for these intermediate pairs are passed to the master which forwards them to the workers that are assigned a reduce task (fig. 3). The data is sorted by the intermediate keys in order to group all occurrences of the same key together. Each unique key and its associated set of values is sent to the reduce function. The output from the reduce function is appended to a file related to the current task. This will result in R different output files. It is not needed to combine these files since they can be read by either using MapReduce or another application that can read input distributed in multiple files. The output of the reduce function is most commonly one single value set, or zero if no reduction was possible to compute. Figure 3, simplified sample code for reduce function.
Thanks to the simplified focus of the MapReduce paradigm, it can be implemented swiftly on any distributed data system, in the range of smallscale businesses to largescale corporate businesses. The main design aspect of MapReduce was to implement a dynamic backbone for distributed data mining, with a great fault tolerance while hiding all the messy details, in order to allow its users to focus on the more specific, simple computations. Hence, MapReduce makes it easier and quicker to parse distributed data since the framework takes care of the parallelisation and distribution.
There are some security aspects already implemented from the start in the MapReduce framework. A task, which is a part of a job submitted by a user, can only be ran through the same user, verified by assigned permissions to that user and the user’s identity. Only the user can
terminate the job processes submitted. Another security policy implemented is the possibility of restricting users when it comes to job submission queues (O’Malley et al., 2009).
Furthermore, to supply the MapReduce paradigm with more solutions in order to improve its security level Airavat was introduced. Airavat is a system with the main purpose of enabling the processing and execution of both trusted and untrusted computations on MapReduce frameworks. Airavat also enforces privacy policies, provided by the data source providers. To achieve this desired level of security, Airavat divides the computation process of MapReduce into two distinct sections, that differ in the aspect of security levels. The first section involves the mapped code, which is considered to be untrusted. The second and last section involves the reducer code, which is seen upon as trusted code. Airavat provides trusted reducers, including the functions SUM, COUNT, and THRESHOLD, which are sufficient for many reduce operations carried out in the distributed data mining industry (Roy et al., 2010).
2.2 Hadoop
One commonly known framework paradigm is Hadoop, an implementation of MapReduce written in Java, which became popular thanks to its open source manner. Hadoop made MapReduce easy to access for businesses of any scale that are interested in maintaining and mining their distributed database sources. The key for this is to process largescale data sets across several clusters while using incomplex programming entities.
The Hadoop framework has two main parts that can be distinguished from each other; first and foremost it consists of the processing framework, which carries out the distributed processing on clusters of any scale. Secondly, Hadoop is carried by a separate file system which holds all the data in a distributed manner. This file system goes under the name Hadoop Distributed File System ( HDFS). The main purpose of this separate file system is to store all the desired data, for efficient access later on once the data is to be processed or analysed. As a means of maintaining the easiness of Hadoop, the HDFS file system is optional to use.
2.3 Graph Mining
When comparing paradigms it is of interest to distinguish them based on what kind of distributed data will be mined. When it comes to mining distributed data that is specifically structured as a graph, there are some known and attributed graph aspects of the mining process that will affect the overall performance to a certain extent. It is of high interest to constantly evaluate those aspects, as a way of making it possible to optimise the underlying algorithms that are developed solely for the graph mining tasks.
2.3.1 Graph Partitioning
To be able to efficiently mine graphs in general, it is of high importance to maintain the graphs partitioned, which would involve breaking the primary graph into subgraphs of equal sizes. A poorly partitioned graph (or not partitioned at all) would require significantly more processing and analysing before and during the mining process, as for instance the amount of edges that cross numerous partitions would require more communication to be carried out between the machines (Zeng et al., 2012).
According to Salihoglu & Widom (2013) a well thought out graph partitioning algorithm will also reduce the input and output data transferred through the network, in form of messages, instructions, etc. This is mainly the outcome when localising edges within the workers instead of just partitioning them randomly.
Zeng et al. (2012) conducted a performance research which applies on the performance of parallel graph partitioning when taking the graph partitioning process into account. They discovered a new algorithm which can process parallel graphs in order to make a kway balance partitioning on graphs of larger scale. The algorithm was evaluated while performing on realworld clusters, containing graph datasets with as much as roughly 42 million vertices, and was compared with an already existing hashing method of graph partitioning. The algorithm implemented for the study outperformed the hashing counterpart, leaving the hashing algorithm approximately three times slower, after finishing the partitioning tests carried out.
2.3.2 Network Performance
The networking performance of a system mining distributed data has a major role in determining the performance outcome of the mining process. It involves the sending and acquiring of information and message packets between worker units in the system. Salihoglu & Widom (2013) have conducted a network I/O (Input/Output) evaluation, which specifically targets the efficiency of network behaviour for different paradigms when mining graphs. According to their study, the variance between different paradigms is large when evaluating the size of the network I/O exchange. Four different graph partitioning schemes were evaluated during the partitioning process. The size difference between the fastest and the slowest partitioner according to their study was 7.9, measured in amount of gigabytes (GB) used for network I/O. The fastest scheme algorithm is an implementation of METIS, which is a software for dividing graphs into smaller partitions defined by the user. METIS is open for anyone to utilise.
2.3.3 Graph State
The downside to using MapReduce for processing graphs is that—because of how the map and reduce functions work—it has no way of keeping the state of the graph during processing. The machines would therefore have to pass around the part of the graph corresponding to the data being processed. This means a substantial amount of inout processing and bandwidth would be spent on just passing the graph around between machines.
The downside of frameworks that implement distributed graph mining, such as Pregel which is discussed below, is that they handle stragglers, machines that does not respond to pings, worse. If one machine fails in MapReduce it just restarts the task. In Pregel, if workers fail, the current state of the partitions assigned to these workers is lost. That state has to be reloaded from a checkpoint, which if unlucky, might be several supersteps back, requiring more than just one worker to recompute already finished work.
2.4 Pregel
Graph algorithms commonly suffer from poor locality, and distribution over many machines increases the probability of singlepoint failure. Singlepoint failure means that the master fails, which will cause the entire program to fail. When mining graphs in MapReduce they need to be written as a series of chained MapReduce invocations. The entire graph needs to be passed between each stage meaning costly communication. This means usability issues and suboptimal performance when dealing with large graphs. To deal with graphs more efficiently, the paradigm Pregel was developed (Malewicz et al., 2010).
Pregel keeps the communication cost low by only sending messages instructing machines how to manipulate the nodes of the graph, keeping it continually updated during runtime. Like MapReduce, Pregel uses a master and a group of workers. It takes a graph as input and at each vertex, the users computation is run. To communicate between vertices, a series of iterations, called supersteps, are used. Each vertex can change its own state, or that of its outgoing edges, read messages from the previous superstep and send new messages in the next superstep. It can also mutate the graphs topology if needed. This vertexcentric model makes it more efficient than MapReduce since the state of the graph is kept on the machine that performs the computation instead of being sent between each stage. The synchronicity also ensures that Pregel programs are inherently free of deadlocks and data races common in asynchronous systems. The computation stops when all vertices are simultaneously in a state called vote to halt. This means that it has no more messages to send and is inactive. It can be reactivated by a message, meaning it has received a new task. The output is often a graph isomorphic to the input, although not necessarily since vertices and edges can be added or deleted during computation (Malewicz et al., 2010).
2.5 GraphChi
Like Pregel, GraphChi was built with graph processing in mind. Not only that, but graph processing on single computers. This differs greatly from other graph processing systems, which use a distributed approach on clusters of machines. Distributed systems means their users will have to manage clusters, fault tolerance and unpredictable performance. In addition to this, the user have to partition the graph across the clusters’ nodes and find efficient graph cuts that minimises communication between the nodes, which is known to be a difficult task.
Like with Pregel, the vertexcentric model is used. Messages are passed between vertices, along edges, and the values of vertices and edges are computed and changed. Advanced graph computing, with billions of edges, would normally require expensive components if it was to be carried out in the memory of a single computer. Another solution was to use persistent storage as memory extension. This usually means poor performance, but by using a novel method called Parallel Sliding Windows (PSW) it could be improved. While Pregel is synchronous, PSW, and therefore GraphChi, is asynchronous by nature. Asynchronicity has been shown to be more efficient than the synchronous model, even if it is argued that Pregels performance could be competitive with that of asynchronous systems.
PSW processes graphs in three stages. First, it loads a subgraph from disk. It then updates vertices and edges of this subgraph and finally writes the updated values to disk. The vertices are divided into a number of disjoint intervals and shards contain the edges. For each interval a shard is associated, called the memoryshard. The other shards are called sliding shards in that interval. A subgraph is constructed one interval at a time, where the inedges for the vertices in this interval are read from the memoryshard and the outedges from the sliding shards. A
sliding window can be visualised over the intervals associated edges in each shard (Kyrola et. al., 2012).
Chapter 3 - Method
This study will be based on several different sources of information, to be able to provide with relevant and comprehensive results within the area of research.
3.1 Literature Study
To be able to conduct a meaningful and unique research on this kind of problem, a more theoretical approach is appropriate in order to implement a wide theoretical backbone, which will advance the knowledge within this area of studies. This includes the knowledge of already available studies and what results they brought forward to the area of business intelligence. It is of high importance to examine and evaluate many different papers and reports published on electronic sources, as they contain many relevant tests and related information to evaluate.
3.2 Test Study Specifications
As a natural outcome of the comprehensive research carried out in the literature study, some relevant paradigm frameworks for small scale clusters, available as an open source solution for personal computers, are chosen for further evaluation on a small scale cluster consisting of a single machine. The main foundation for the research as a whole is to be generated by complementing this study with convincing and interesting results, performed on a single personal computer.
Each is performed individually, with no other software running simultaneously for maximum performance output. The computer machine is also connected to a power supply, maximising the performance of the machine.
3.2.1 Test Machine
The tests are applied on a single machine, computing all the necessary steps during the study. The machine consists of an Apple Macintosh Personal Computer (PC) laptop running the latest version of the operative system OS X “Yosemite” (version 10.10.2). The hardware specifications of the computer utilised during the tests are following: ● Processor: Intel Core i5, 2.4 GHz clock frequency ● Memory: 8 GB RAM, DDR3 1600 MHz clock frequency ● Graphics: Intel Iris 1536 MB VRAM ● Hard Disk Drive (HDD): 256 GB SSD ● Operative System: OS X Yosemite (v. 10.10.2)
3.2.2 Test Paradigm Frameworks
The tests are carried out with two different paradigm frameworks available for free download. The first paradigm used for testing is a native version of Hadoop for OS X, installed locally on the hard drive. Hadoop is an open source software implemented in Java, licensed under the common Apache 2.0 license (Apache Hadoop, 2015). Hadoop can run tests through a terminal window and requires no other user interface. All processes currently running on the Hadoop system can be fully controlled through a local website portal. Hadoop is chosen as one of the test paradigms for the purpose of simplicity and the utilisation area; Hadoop is developed for mining any kind of distributed data, and does not specify any preferred data structure to be mined.
The other paradigm used in this test is the GraphChi framework, also available for free download. GraphChi is open source and licensed under the common Apache license, version 2.0. GraphChi is also implemented in Java and downloaded as an Eclipse project through Github. All the source code is fully available to use and configure. The GraphChi paradigm is developed for mining distributed graphs on a small cluster consisting of a single machine, making it very suitable for the scope of the study and as a paradigm to compare with Hadoop.
3.2.3 PageRank
PageRank is an algorithm used by Google to rank the importance of websites. The importance is determined by the likelihood for a person, who is randomly clicking links, to end up on a certain site. All sites have equal importance at the start of the computation. A sites importance value is evenly distributed over all of its outgoing links. This changes the importance of sites continually during computation. Finally, the sites will have different importance and a link from a site with high ranking and few links is worth more than a link from a less important site with more links. The PageRank algorithm used for the specific tests in this study is available as an open source distribution, made available in the GraphChi framework explained in section 3.2.2 of this report. Same PageRank algorithm was exported as a JAR (Java Archive) file, and used as the algorithm for the Hadoop framework used during the tests (see section 3.2.2).
3.2.4 Input Data
The test applies the PageRank algorithm on directed and undirected graphs stored in text (txt) files. All graphs are open to the public and free to download in compressed (gzip) format from Stanford University’s public dataset collection. The following sub chapters explains the input graphs more indepth with details.
3.2.4.1 Facebook
The Facebook dataset graph describes the structures and connections based on Facebook users’ ‘friend lists,’ collected during a survey. All the survey participants have been anonymised in terms of internal Facebook IDs and other personal information, such as political beliefs etc. The Facebook graph is undirected.
3.2.4.2 YouTube
The YouTube dataset graph consists of a social network where communities can be found and connected to each other. This undirected graph consists of the largest community networks, with the largest connected component on the social network.
3.2.4.3 Amazon
Amazon’s dataset graph was created by crawling the Amazon website and gathering data based on the “Customers Who Bought This Item Also Bought”feature. The network is an undirected graph based on the largest connected component.
3.2.4.4 WikiTalk
The directed graph of WikiTalk is based on Wikipedias Talk pages, which are user pages that can be edited in order to communicate and discuss updates on articles. The network was created from changes to these pages, where nodes represent users and edges represent changes made by one user of another users page.
3.2.4.5 Patents
The Patents dataset is a directed graph containing citations made by US patents during this time period. The dataset was originally gathered and made public by the National Bureau of Economic Research (NBER) between year 1963 and 1999.
3.2.4.6 Pokec
Pokec is an online social network, popular in Slovakia, predating Facebook. The dataset contains anonymised data of the whole network and friendships, represented by the edges in the graph, are directed.
3.2.4.7 LiveJournal
LiveJournal is an online community for maintaining journals and blogs and has a friendsystem. The graph is undirected.
3.2.4.8 Orkut
Another social network called Orkut, which is now dissolved, was owned and operated by Google. The graph is undirected and unlike the other social media graphs, describes userformed groups and their members instead of friendships.
Chapter 4 - Result
The results of the study will be presented in this section of the report. The results will reveal how two different paradigm frameworks perform during a test, which applies a single graph mining algorithm on a cluster containing a single machine.
Each specific graph is processed during five individual sessions for extending and enhancing the reliability of the study itself. When five sessions have been processed, the final performance result for each graph will be calculated as the mean value of the five sessions.
4.1 Graph Size
Figure 4.1 & 4.2, graph sizes based on amount of nodes.
The figures above (fig. 4.1, 4.2) describe the amount of nodes the test graphs consist of. It was of great interest to perform the test on graphs of all sizes, hence explaining the great variance of node sizes of the graphs included in the test. The Facebook graph, being the smallest one, is build by roughly 4,000 nodes. On the other side of the spectrum of graphs there is the LiveJournal graph, built upon approximately 4 million nodes and is the biggest graph based on amount of nodes. Following figures down below show the amount of edges for each graph in the test.
Figure 5.1 & 5.2, graph sizes based on amount of edges.
Based on amount of nodes for each graph, the graph for Orkut data shows a significant high amount of edges for each node. This is based on Orkut being a social network which share the traits of having relatively large amounts of edges per node in their corresponding graphs. The Facebook graph (roughly 88K edges with around 20 times more edges than nodes in that graph) and the Pokec graph (around 1,7M edges with approximately 19 times more edges than nodes in that graph) share the same similarities, while also being graphs representing social networks. 4.2 Time Performance for Individual Graph Sessions
To determine the variance of time performance between the five sessions, a diagram of time results are to be shown in the following sections for each graph. Each diagram for a specific graph shows time results for five sessions based on the amount of shards during the tests (two and eight shards respectively) and the paradigm used during the tests (Hadoop and GraphChi).
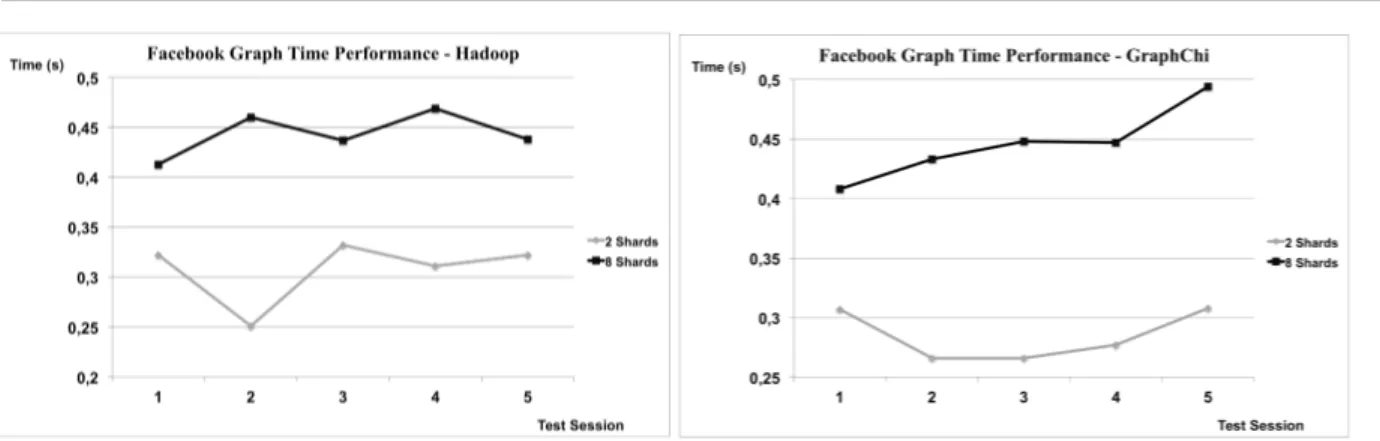
4.2.1 Facebook Graph
Figure 6.1, Facebook graph time results (seconds) during five tests using Hadoop. Figure 6.2, Facebook graph time results (seconds) during five test using GraphChi.
As shown in the figures above (fig. 6.1, 6.2) the difference in time performance between the two paradigms is small —especially for the tests applying the algorithm with eight shards. When using only two shards, the GraphChi paradigm is slightly more efficient than the Hadoop counterpart. This specific result is special based on the Facebook graph being a considerately smaller graph, in comparison with the other graphs tested in this study.
4.2.2 YouTube Graph
Figure 7.1, YouTube graph time results (seconds) during five tests using Hadoop. Figure 7.2, YouTube graph time results (seconds) during five test using GraphChi.
In this test, as seen above (fig. 7.1, 7.2), it is more clear that the Hadoop paradigm is notably quicker than the GraphChi paradigm, with roughly one second across all test sessions regardless of amount of shards used when applying the PageRank algorithm on the YouTube graph. Compared to the Facebook graph, the YouTube graph has considerably more nodes and edges. On the other hand, the Facebook graph has roughly 10 times more edges per node in comparison. 4.2.3 Amazon Graph Figure 8.1, Amazon graph time results (seconds) during five tests using Hadoop. Figure 8.2, Amazon graph time results (seconds) during five test using GraphChi. When it comes to applying the PageRank algorithm on the Amazon graph, Hadoop is roughly half a second quicker compared to the GraphChi performance. The performance consistency is shared from the YouTube test in the above section (fig. 8.1, 8.2). Also, the Amazon graph has nearly as many edges per node as the YouTube graph.
4.2.4 Wikitalk Graph
Figure 9.1, Wikitalk graph time results (seconds) during five tests using Hadoop. Figure 9.2, Wikitalk graph time results (seconds) during five test using GraphChi.
During the testing of the Wikitalk graph, the tests with two shards Hadoop showed a great variance of time results during the five test sessions. In the long run, the Hadoop paradigm performed the fastest with two shards. The tests applying eight shards when processing the Wikitalk graph showed a more stable time result output, where it is more clear that the Hadoop paradigm is the fastest one, with roughly 7,3 seconds compared to GraphChi’s 8,9 seconds (mean values).
4.2.5 Patents Graph
Running the PageRank algorithm on the Patents graph with two shards, both paradigms performed almost equally —Hadoop was approximately one second quicker (comparing mean values) than the GraphChi paradigm during the test, which is a minor difference considering the total running time. For the PageRank algorithm with eight shards, Hadoop showed a consistently more efficient trend compared to GraphChi throughout the tests seen above (fig. 10.1, 10.2). 4.2.6 Pokec Graph Figure 11.1, Pokec graph time results (seconds) during five tests using Hadoop. Figure 11.2, Pokec graph time results (seconds) during five test using GraphChi. The Pokec graph showed tendencies of being more efficiently processed when using Hadoop, as shown in the figures above (fig. 11.1, 11.2). When running the PageRank algorithm with two shards, the Hadoop paradigm never exceeded 34 seconds in any test session, which was not the case for the GraphChi paradigm. During the tests involving eight shards, Hadoop outperformed GraphChi with roughly two seconds during all five test sessions.
4.2.7 LiveJournal Graph Figure 12.1, LiveJournal graph time results (seconds) during five tests using Hadoop. Figure 12.2, LiveJournal graph time results (seconds) during five test using GraphChi.
The graph of LiveJournal showed a particularly varied during the five tests utilising the PageRank algorithm with two shards (fig. 12.1, 12.2). The best result for GraphChi is on the same level as Hadoop’s worst time performance, thus making Hadoop the fastest paradigm during tests with two shards. When comparing the two paradigms in the tests with eight shards, Hadoop was again showing better overall results compared to GraphChi. 4.2.8 Orkut Graph Figure 13.1, Orkut graph time results (seconds) during five tests using Hadoop. Figure 13.2, Orkut graph time results (seconds) during five test using GraphChi.
The Orkut graph is by far the largest graph included in the test; with approximately 38 times more edges than nodes, Orkut has considerably more edges than any other graph in this test which makes it more complex in terms of processing with the PageRank algorithm. Test results for two shards found in the figures above show almost no difference between the paradigms (fig. 13.1, 13.2). The difference in time performance is less than half a second. Both paradigms exceed the 100second time frame, thus making such a small difference more or less negligible in terms of of this study’s limitations. Greater differences in terms of time results are achieved only when applying the PageRank algorithm with eight shards. In that scenario, Hadoop is once more the most efficient algorithm with around a four second difference compared to the GraphChi algorithm.
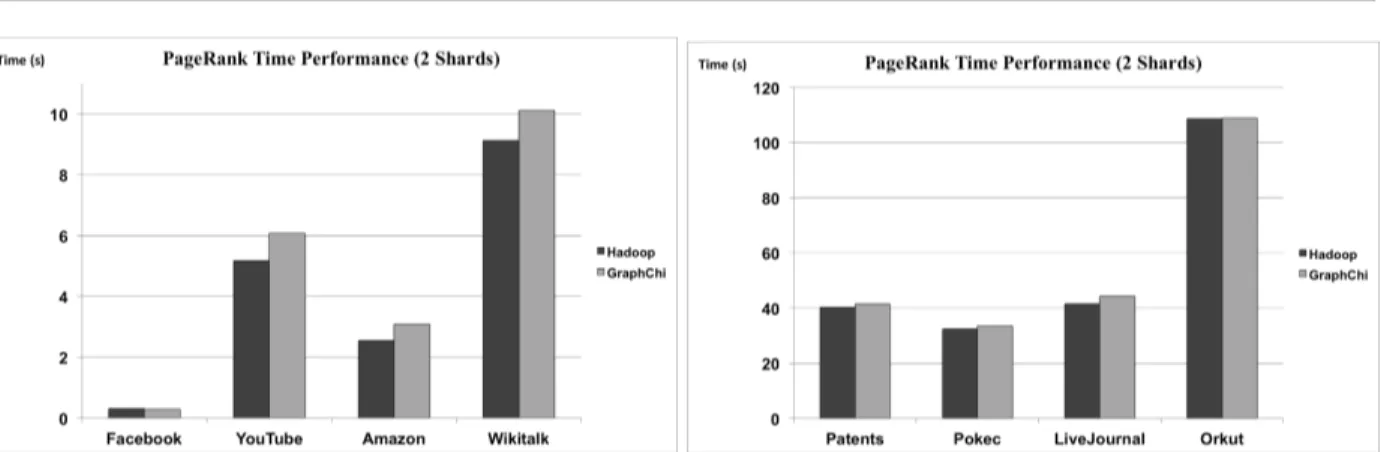
4.3 Time Performance For All Sessions
Figure 14.1, 14.2, time results all graphs (mean values in seconds) using two shards.
Both figures displayed above (fig. 14.1, 14.2) summarise the time performance tests performed on the single machine in this study, when applying the PageRank algorithm with two shards on all graphs included. Hadoop is more efficient in processing the graphs during almost all tests, with Facebook being the only difference. Hadoop is better when processing the Orkut graph, with a slight time difference of less than half a second as stated in section 4.2.8 of this study. GraphChi manages to beat Hadoop when processing the Facebook graph, with a mean time of
graph structures of Facebook’s and Orkut’s graphs are the high edges per noderatio with the difference being the total size of the graph. Figure 15.1, 15.2, time results all graphs (mean values in seconds) using eight shards. Figure 15.1 and 15.2 showcase the overall time performance with mean values from the tests performed with the PageRank algorithm applied on all graphs, with eight shards. As with the tests using two shards (fig. 14.1, 14.2) Hadoop outperforms GraphChi. Even the Facebook graph displayed, marginally, better results with Hadoop (0,443 seconds compared to GraphChi’s 0,446 seconds). Eight shards results in an overall improved performance when processing most graphs in both paradigms. The Facebook network graph is considerably smaller than the other graphs and showed a somewhat worse time performance when increasing the number of shards.
Chapter 5 - Discussion
Hadoop generally performs best on multiplenode clusters and —because of how the map and reduce functions work—it has to pass the graph continuously between the machines, using up a lot of bandwidth. GraphChi, on the other hand, is optimised for graph mining on a single consumerlevel machine. Theoretically, this should imply that the GraphChi paradigm outperforms the Hadoop counterpart, so we expected great time differences in favour of GraphChi, especially when running tests with a higher amount of shards.
The result for the time performances in figures 14 and 15 show that Hadoop, contrary to what we expected, generally performs as fast, or even better, than GraphChi for the relatively small graphs we used. The mean time taken to mine each graph only differ by a few seconds for all the different graphs. According to Kyrola et al. (2012) GraphChi computes graphs with billions of edges efficiently. The graphs we used had at most 120 million edges. It is probable that these smaller graphs did not allow GraphChi to show its strengths and therefore likely that GraphChi would outperform Hadoop on larger built consisting of billions of edges. Unfortunately, due to the limited time frame given for this study, and restrictions regarding the availability of large graphs, there were no possibilities of including a deeper analysis of such graphs in this study. Further studies with larger graphs, with billions of edges, are therefore of high interest and suggested.
Another aspect that might have had an impact on the results is the algorithm used, which is PageRank. We used a version that was included with the GraphChi distribution and developed to be easy and swift to use. To get as little of an impact as possible, we wanted to use that same algorithm. However it is possible that the results would have been different, if we would have used different PageRank algorithms.
As stated above, we had a few limitation aspects to take into account while performing this study. First and foremost, due to the time frame given for the study, we had to limit our tests to be performed on a single machine which instantly limited the amount of possible distributed data mining paradigms to use for the tests. Even though this limitation existed, we managed to find two paradigms highly suitable for this kind of study and specifically developed for single node clusters. Even though distributed data mining is usually processed on multiple clusters, containing thousands of computing machines, we managed to motivate this study and enhance its purpose by exclusively choosing paradigms developed for running data on single machines. Moreover, the very limited time frame for this kind of theoretical area also affected the range of this study; even larger graphs and more test sessions would instantly increase the reliability of this study and give a deeper and more thorough answer to the problem stated.
Chapter 6 - Conclusion
Distributed data mining is a large subject. Many paradigms have been created with the purpose of mining the huge amounts of data generated each day. Data sets can take on different structures and some can be seen as a graph. The first paradigms used, utilised the idea of map and reduce functions to mine data, which is not an optimal way of mining graph structured data sets. On the subject of distributed graph mining, many paradigms are optimised for large clusters. Hadoop however can be set up on single node clusters and GraphChi is optimised for them. Hadoop is built on the older idea of map and reduce functions for distributed data mining, while GraphChi has been optimised for mining large graphs (with billions of edges). The graphs used in this study consist of millions of edges, because of the limited availability of larger graphs. The algorithm used to mine these graphs was PageRank, a widely used algorithm. For these smaller graphs our test runs give us the answer to our problem statement that there are no advantages to using a graphspecific distributed data mining paradigm for the PageRank algorithm in single node clusters on graph data, at least not on graphs with less than billions of edges. In fact, for graphs with millions of edges, Hadoop performed even better, if only slightly, than GraphChi.
References
● I. Bose, R.K. Mahapatra (2001). Business Data Mining A Machine Learning Perspective. Department of Decision and Information Sciences, Warrington College of Business Administration, University of Florida. Available on: <http://www.sciencedirect.com/science/article/pii/S037872060100091X#> [Accessed on: 20150303] ● J. Dean, S. Ghemawat. (2008). MapReduce: Simplified Data Processing on Large Clusters. Google, Mountain View, CA. Available on: <http://dl.acm.org/citation.cfm?id=1327492> [Accessed on: 20150306] ● D.J. Hand (1998). Data Mining: Statistics and More? The American Statistician. Available on: <http://dx.doi.org/10.1080/00031305.1998.10480549> [Accessed on: 20150306] ● G. Malewicz, M. H. Austern, A. J.C. Bik, J. C. Dehnert, I. Horn, N. Leiser, G. Czajkowski (2010). Pregel: A System For LargeScale Graph Processing. Google, Inc. Available on: <http://kowshik.github.io/JPregel/pregel_paper.pdf> [Accessed on: 20150306] ● O. O’Malley, K. Zhang, S. Radia, R. Marti, C. Harrell (2009). Hadoop Security Design. Yahoo! Inc. Available on: <http://carfield.com.hk:8080/document/distributed/hadoopsecuritydesign.pdf> [Accessed on: 20150316] ● D.J. Power (2007). A Brief History of Decision Support Systems. DSSResources.com. Available on: <http://dssresources.com/history/dsshistory.html> [Accessed on: 20150306] ● I. Roy, S. T.V. Setty, A. Kilzer, V. Shmatikov, E. Witchel (2010). Airavat: Security and Privacy for MapReduce. The University of Texas, Austin, Tx. Available on: <http://static.usenix.org/events/nsdi10/tech/slides/roy.pdf> [Accessed on: 20150224] ● S. Salihoglu, J. Widom (2013). GPS: A Graph Processing System. Stanford University. Available on: <http://dl.acm.org/citation.cfm?id=2484843.pdf> [Accessed on:● G. Tsoumakas, I. Vlahavas (2009). Distributed Data Mining. Department of Informatics Aristotle University of Thessaloniki Thessaloniki, 54124 Greece. Available on: <http://lpis.csd.auth.gr/publications/tsoumakasdwm2.pdf> [Accessed on: 20150306] ● H. J. Watson, B. H. Wixom (2007). The Current State of Business Intelligence. University of Georgia, University of Virginia. Available on: <http://ieeexplore.ieee.org/stamp/stamp.jsp?tp=&arnumber=4302625&tag=1> [Accessed on: 20150306] ● X. Yang, J. Sun (2011). An Analytical Performance Model of MapReduce. Dept. of Computer Science & Technology, Zhejiang University, Hangzhou, China. Available on: <http://ieeexplore.ieee.org/stamp/stamp.jsp?tp=&arnumber=6045080> [Accessed on: 20150316] ● Z. Zeng, B. Wu, H. Wang (2012). A Parallel Graph Partitioning Algorithm to Speed Up the Largescale Distributed Graph Mining. School of Computer Science, Beijing University of Posts and Telecommunications. Available on: <http://dl.acm.org/citation.cfm?id=2351325.pdf> [Accessed on: 20150327] ● A. Kyrola, G. Blelloch, C. Guestrin (2012). GraphChi: largescale graph computation on just a PC. School of Computer Science, Carnegie Mellon University, Pittsburgh, PA, USA. Available on: <http://dl.acm.org/citation.cfm?id=2387884.pdf> [Accessed on: 20150403] ● Apache Hadoop (2015). Hadoop. Available on: <http://hadoop.apache.org> [Accessed on: 20150306]