Contents lists available atScienceDirect
Engineering Fracture Mechanics
journal homepage:www.elsevier.com/locate/engfracmechExperimental and numerical assessment of the work of fracture in
injection-moulded low-density polyethylene
Martin Kroon
a,⁎, Eskil Andreasson
b,c, Viktor Petersson
b, Pär A.T. Olsson
d,e aLinnaeus University, Växjö, SwedenbTetra Pak, Lund, Sweden
cBlekinge Technical University, Karlskrona, Sweden dMalmö University, Malmö, Sweden
eLund University, Lund, Sweden
A R T I C L E I N F O
Keywords: Polyethylene Low-density Fracture Energy Cohesive Injection-moulding Abaqus FEMA B S T R A C T
The fracture mechanics properties of injection-moulded low-density polyethylene (LDPE) sheets were investigated both experimentally and numerically. The total work of fracture was de-termined experimentally, by means of fracture mechanics testing of sheets of injection-moulded LDPE with side cracks of different lengths. A multi-specimen method, proposed by Kim and Joe (1987), was employed. The total work of fracture was estimated to 13 kJ/m2. The experiments were simulated numerically using thefinite element method. Crack growth was enabled by in-clusion of a cohesive zone, and the constitutive response of this zone was governed by a traction-separation law. The local (or essential) work of fracture was estimated through numerical ana-lyses, where the initiation of crack growth was simulated and the outcome was compared to the experimental results. The local (i.e. essential) work of fracture was estimated to 1.7 kJ/m2, which
is consistent with previous experimental measurements for the material in question. The total work of fracture, retrieved from the present experiments, agreed well with the farfield values of the J-integral in the numerical analyses.
1. Introduction
The present paper concerns fracture mechanics of soft polymers. More specifically, the work of fracture of a low density poly-ethylene (LDPE) is investigated. Polypoly-ethylene is a polymer that may exhibit different degrees of crystallinity, mainly depending on the degree and type of branching of the polymer chains, which governs the ability of the chains to crystallize. Hence, high density polyethylene (HDPE), which exhibits the highest degree of crystallinity, is the stiffest and hardest type of PE. Another version of PE is linear low density polyethylene (LLDPE), which is the most amorphous of the PE grades discussed in the present work. All of these versions of PE have a semi-crystalline microstructure and are extremely ductile at room temperature. As a result, they exhibit an elastic-viscoplastic and/or viscoelastic mechanical behaviour.
The energy required to propagate a crack in such a material may be divided into (at least) two parts. Thefirst part, sometimes denoted the essential work of fracture, is associated with the fracture process at the very crack tip. For polymers, such as poly-ethylene, this process includes void formation and coalescence, andfibril formation and failure in a craze zone ahead of the crack tip. The second part of the work of fracture is associated with viscous dissipation in the region surrounding the crack tip. This second process includes plastic work required to cause crack tip blunting but also other dissipative plastic, viscous, and damage processes
https://doi.org/10.1016/j.engfracmech.2018.02.004
Received 10 October 2017; Received in revised form 29 January 2018; Accepted 2 February 2018
⁎Corresponding author.
E-mail address:martin.kroon@lnu.se(M. Kroon).
Available online 09 February 2018
0013-7944/ © 2018 The Authors. Published by Elsevier Ltd. This is an open access article under the CC BY-NC-ND license (http://creativecommons.org/licenses/BY-NC-ND/4.0/).
that may take place around the deforming crack tip. Both of these contributions to the total work of fracture are expected to be rate-dependent.
These contributions to the total work of fracture have been investigated in several numerical studies. Tvergaard and Hutchinson, for instance, studied the contributions from the fracture process and crack tip plasticity to the total work of fracture for the case of small scale yielding and for a class of general, elastic-plastic materials[1]. In three similar studies, Kroon investigated the con-tributions of viscous processes at the crack tip to the total work of fracture in soft polymers during steady-state crack propagation
[2–4].
In the present work, we adopt a computational framework for assessing the work of fracture in soft polymers undergoingfinite deformations. The material is taken to be anisotropic, and crack propagation is enabled by the inclusion of a cohesive zone in the model[e.g. 5–9]. The present study also includes experimental work, where the total work of fracture of an LDPE material is determined. A number of experimental schemes have been proposed for assessing the fracture mechanics properties of soft polymers,
[e.g. 10–18]. Most of these methods enable the determination of the total work of fracture. However, the essential work of fracture (EWF) method[19,20]is an attempt to determine the fracture (or surface) energy at the very tip of the crack during crack initiation and propagation. The method has been applied for determining the essential work of e.g. pure polyethylene[21–24], polyethylene composites[25,26], and PETG[27]. However, the method must be seen as highly approximative, since it is based on extrapolation. In the present work, we adopt the method of Kim and Joe[16,17]for estimating the total work of fracture of the LDPE material in question, but results from EWF estimates from the literature are also discussed.
The paper is organized as follows: In Section2, a concise formulation of the problem to be analyzed is provided. The problem is analyzed both experimentally and numerically. Section3contains a description of the experimental study, and Section4describes the numerical model that is used to analyze the problem. In Section5, the experimental and numerical results are presented, and Section6contains a discussion and some concluding remarks.
2. Problem formulation
The geometry of the problem to be analyzed is illustrated inFig. 1. An orthogonal coordinate systemX1-X2-X3is introduced. A quadratic polyethylene sheet (white) with a side length W and of thickness B is clamped between two identical and rigid grips (grey). The width and height of the grips areWgand Hg, respectively, and the dimensions of the part of the polyethylene sheet that is free to deform are W and H. The polyethylene sheet is mounted symmetrically between the grips. The sheet contains a sharp side crack of length a, which is perpendicular to the loading direction. The upper grip is attached to afixed hinge, and the load is applied to the lower grip through a second hinge, as indicated inFig. 1. The applied load is denoted by P, and the associated load-line displacement is denoted by δ. The J-integral is evaluated along contours around the crack tip, as indicated inFig. 1.
3. Experiments
3.1. Material
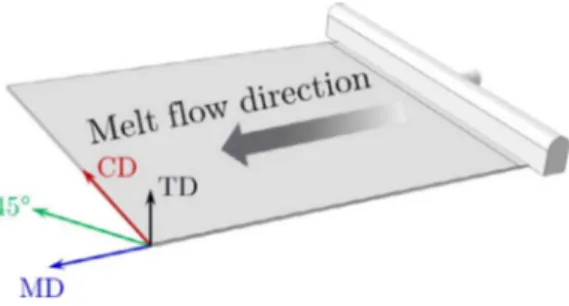
A low-density polyethylene (LDPE) was tested. The test specimens originate from sheets that had been manufactured through an injection-moulding process, seeFig. 2. Theflow direction is denoted by ‘MD’, the cross direction by ‘CD’, and the thickness direction is denoted by‘TD’. The sheets had a thickness of =B 0.60mm. The details of the injection-moulding process used have been described in a previous paper[28]. With regard to coordinate directions, we assume thatMD⇔ X1,CD⇔ X2, andTD⇔ X3.
Uniaxial tensile testing of dog bone-shaped test specimens, punched out from such sheets, was performed in a previous study[28].
These results enabled the determination of the anisotropic elastic and plastic properties of the material. In the present study, fracture mechanics testing is performed. Quadratic specimens, with a side lengthW=79mm, were therefore punched out from the same type of injection-moulded sheets for the fracture mechanics testing, seeFig. 3.
The crack in the specimens was introduced using a razor blade. In total, 7 different initial crack lengths were investigated, i.e.
=
a 24, 26, 28, 30, 32, 34, and 36 mm, seeFig. 1.
3.2. Testing procedure
A standard tensile testing machine was used for the fracture testing. The test specimens were mounted between two aluminium grips, as indicated inFig. 1. The dimensions of the grips wereWg=Hg=65mm, and the distance between the grips, i.e. the gauge length, was H=65mm. The testing was performed under displacement control and using a constant grip separation speed of
=
δ ̇ 0.5mm/s. During the test, the force, P, and displacement, δ, were registered. The specimens were loaded up to the point when initiation of crack growth was observed, after which the specimens were immediately unloaded using the same loading velocity. The observed force and displacement at initiation of crack growth is denoted byPcrandδcr, respectively.
Initiation of crack growth was registered by drawing a vertical line with a width of 0.5 mm in front of the crack tip. Complete disruption of this line was taken as initiation of crack growth.
3.3. Evaluation of work of fracture
Based on the force vs. displacement curves, attained from the fracture mechanics tests, the work of fracture can be estimated by use of the Locus method [16,17]. The method is illustrated in Fig. 4, where it is assumed that specimens with crack lengths
= … −
a a a1, , ,2 an 1,anhave been used.
In the method, it is assumed that the critical value of the J-integral, Jc, causing initiation of crack growth, is constant and independent of crack length. The energy U ac( )is defined as the area enclosed by the force-displacement curve for crack length a, the locus curve defined by the points of crack initiation, and the δ-axis, as illustrated inFig. 4. Hence,Jcmay be estimated as
= − − − J B U a U a a a 1 ( ) ( ) , n n c c 1 c 1 (1)
which may be generalized to
= − J B U a 1 Δ Δ . c c (2) The energy U ac( )is evaluated for each crack length and then plotted versus the crack length, such that the slope of that curve (Eq.
(2)) may be used for estimating the work of fracture,Jc.
The estimateJcshould be interpreted as an estimate of the farfield value of the J-integral, i.e.Jff. For an elastic-plastic material,
Fig. 2. Injection-moulding of test sheets.
the J-integral will in general be path-dependent due to plasticity, damage, and other types of dissipation at the crack tip. However, the farfield value,Jff, is evaluated some distance from the crack tip, where the material remains elastic and where the integral is therefore still path-independent.
4. Numerical model
4.1. Preliminaries
The experiments were simulated using afinite element model, and the finite element code Abaqus[29]was used. Due to the small thickness of the polyethylene sheets (compared to the in-plane dimensions) and due to the fact that no out of plane deformations (buckling) were observed, a 2D model was adopted, in which a state of plane stress was assumed.
Boundary conditions were applied in accordance with the experimental setup. The loading was imposed in terms of a prescribed force at the bottom of the lower grip. The maximum force from the experiments,Pcr,i=P acr( )i, defined the total force that was applied
to the specimens. (Strictly speaking, this is inconsistent with the experimental procedure, since in the experiments, the displacement is prescribed rather than the force. However, since we believe thatPcris more accurate/reliable thanδcr, it is convenient to run the simulations in force control rather than displacement control, and this deviation has no affect on the simulation results.)
The simulations were performed in the form of implicit dynamic simulations, such that inertia was included in the analyses. The densitiesρPE=940kg/m3andρAl=1000kg/m3were used for the polyethylene sheets and the aluminium grips, respectively. The total forcePcrwas applied linearly during a time step ofts=0.1s.
Crack growth was enabled by including a thin cohesive zone along the crack plane. Initiation of crack growth was taken to correspond to the stage in the simulation when thefirst 0.5 mm of the cohesive zone had been completely damaged (corresponding to the crack disrupting the drawn line in the experiments).
4.2. Discretization
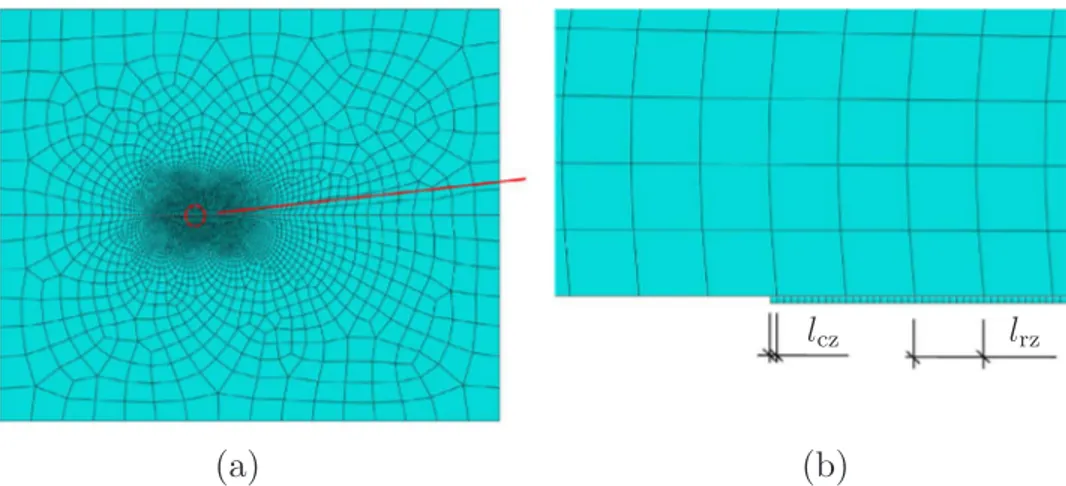
The different parts of the model were discretized using finite element meshes. The aluminium grips were modelled using quadratic elements with a side length of 4 mm (linear shape functions).Fig. 5(a) shows the discretization of a polyethylene sheet. The mesh shown was the standard mesh used in the simulations. In this mesh, the largest elements in the model had a side length of about 4 mm. The mesh for the PE sheets was refined in the close proximity of the cohesive zone, seeFig. 5(b), where only the upper half of the polymer sheet and the cohesive elements are shown. The characteristic size of the elements in the refined zone closest to the cohesive zone waslrz=0.2mm. Quadratic shape functions were used for the continuum elements of the PE sheet. The size of the
Fig. 4. Locus method used for estimating the work of fracture of the material.
(quadratic) cohesive elements waslcz=0.02mm, and linear shape functions were used.
The different sections of the model, i.e. the grips, the bulk of the polyethylene sheet, and the cohesive zone in the polyethylene sheet, were‘glued’ together using the ‘tie’ command in Abaqus, such that the discretizations of the different sections didn’t need to be compatible with each other.
4.3. Material models
The aluminium grips were modelled as isotropic, linearly elastic materials with Young’s modulusEAl=70GPa and Poisson’s ratio =
νAl 0.3.
The polyethylene sheet was modelled as an orthotropic material. Hence, the principal directions of the material were taken to coincide with the coordinate directionsX X1, 2, andX3. The elastic behaviour was taken to exhibit cubic symmetry and to be governed by the Young’s modulusEPE=210MPa, the Poisson’s ratioνPE=0.4, and the shear modulusGPE=46MPa[28]. The in-plane elastic and plastic properties of these polyethylene plates were determined in a previous study[28]. The elastic properties of the thickness direction (TD) were taken to be the same as for CD and MD.
The plastic response was modelled by use of Hill’s plasticity model and yield criterion[30], which enables modelling of aniso-tropic yielding and hardening. Due to lack of information about the plastic response of the thickness direction, we assumed the same plastic properties for TD as for CD.
In Abaqus, Hill’s model is formulated in terms of the yield stress ratios
= = = = = = R R R R R R , , , , , , σ σ σ σ σ σ σ τ σ τ σ τ 11 22 33 12 13 23 y,11 0 y,22 0 y,33 0 y,12 0 y,13 0 y,23 0 (3)
whereσy,11…σy,23denote the yield stress for the different material directions, σ0is a reference stress, andτ0=σ0/ 3. Plastic hardening is modelled by use of an isotropic hardening behaviour on the form
= + ∊
σ0 σ00 H p, (4)
whereσ00is the initial value of the reference stress σ0(= σy,11) at the beginning of the analysis, H is the hardening modulus, and∊pis the (equivalent) plastic strain. The parameters used for modelling the plastic behaviour are listed inTable 1.
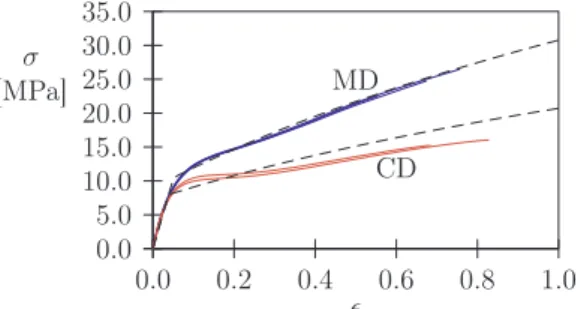
The resulting predictions of the stress-strain behaviour are illustrated for MD and CD inFig. 6together with experimental curves from Kroon et al.[28]. (These simulations were performed using a cubic test element.) The material response shown inFig. 6is taken to be the inviscid response of the material at low deformation rates. The plastic response of TD is taken to be identical to CD.
As can be seen inFig. 6, the model prediction for MD is excellent, whereas the prediction for CD deviates somewhat from the experimental results. Abaqus enables the definition of a user-defined hardening behaviour but not separate hardening functions for different material directions. Hence, the hardening behaviour in the model was adjusted to fit the MD response, since the poly-ethylene sheets are primarily loaded in MD.
The constitutive response of the cohesive zone is modelled by use of a traction-separation law, seeFig. 7. The entitiesTnand δn denote the normal traction and surface separation in the cohesive zone, respectively. (Due to the symmetry of the problem, the shear modes do not come into play.) The maximum nominal traction that the zone can sustain isTmax, which occurs at the surface se-parationδc. At a surface separation of δf, the cohesive zone is completely damaged and completely looses its load-bearing capacity. The initial stiffness of the traction law is denoted byEn=Tmax/δc.
The local work of fracture,Γ0, is attained as the area under the traction separation law, i.e.
∫
= = T δ Γ d . δ δ 0 0 n n n f (5) The entityΓ0may be interpreted as the local value of the J-integral for an integration contour that is located at the very tip of the crack, i.e.Γ0= Jtip.In the numerical simulations, E ,Γn 0, andTmax are prescribed. The constitutive response of the traction-separation law is mainly governed byΓ0andTmax. In the present analyses,Tmax=20MPa andEn=300MPa/mm were employed as standard values. The value ofΓ0was then adjusted tofit the point of initiation of crack growth in the experiments.
4.4. Computation of the J-integral
The J-integral was also evaluated in the simulations. A total number of 20 contours with increasing distance from the crack tip
Table 1
Parameters in plasticity model.
σ0 R11 R22 R33 R12 R13 R23 H
[MPa] [–] [–] [–] [–] [–] [–] [MPa]
was used in the evaluation for each crack geometry. The J-values pertaining to the outer contours were virtually the same, indicating that they were located in the elastic domain of the specimens. This farfield value of J, i.e.Jff, could be compared toJcfrom the experiments.
5. Results
5.1. Experimental results
The outcome of the fracture mechanics testing is shown inFig. 8in terms of the load vs. load-line displacement graphs for the different crack lengths. The end of each curve indicates initiation of crack growth, in the sense that the 0.5 mm thick line drawn in front of the crack tip was disrupted. As indicated above, two tests were done for each crack length. The stiffness response increases with decreasing crack length. There is also a general tendency that the critical force at initiation of crack growth decreases with increasing crack length. The values of the critical force,Pcr, is plotted vs. crack length inFig. 9. There is an anomaly fora=24mm, for whichPcris smaller than fora=26mm. Otherwise it is evident that the critical force decreases linearly with the size of the ligament of the test specimen.
The force curves were averaged, and the energyUcwas calculated for each crack length. These discrete values,Uc,1…Uc,7, were then plotted versus the corresponding crack lengths,a1, ,…a7, as demonstrated inFig. 10. A straight line isfitted to the discrete values, and the slope of this line is proportional to−BJc( =B 0.60mm). This procedure yielded the estimateJc=Jff=13kJ/m2.
Fig. 6. True stress-strain data from experiments (blue and red solid lines) from Kroon et al.[28]together with model predictions (dashed black lines) for MD and CD. (For interpretation of the references to color in thisfigure legend, the reader is referred to the web version of this article.)
Fig. 7. Traction-separation law.
5.2. Numerical results
The experiments were simulated using the numerical model, and the applied load corresponded to the maximum force from the experiments at initiation of crack growth for each crack length.Fig. 11shows the average force vs. displacement curves from the experiments together with the associated predictions from the numerical simulations. As can be seen, there are notable, although not alarming, discrepancies between experiments and simulations.
For the analyses inFig. 11, the value ofJffat the end of the analyses was also calculated, and the outcome is shown inFig. 12. As can be seen inFig. 12, the predictions ofJfffrom the simulations agree very well with the experimental estimate, 13 kJ/m2, and for most of the simulations, the deviation is less than 10% compared to the experimental value.
The behaviour of the bulk (PE) material was completely determined by previous tensile testing, and the only material parameters that remained to be determined by comparison to the fracture mechanics tests were the parameters of the cohesive law, whereΓ0and
Tmaxare the most prominent. Hence, for a given value ofTmax, the local work of fracture,Γ0, was adjusted such that the initiation of crack growth in the simulations occurred at the same load as in the experiments. In this way,Γ0was determined with an accuracy of two significant figures.
The outcome of the analyses is summarized inTable 2. Hence,first of all, the values ofΓ0that produced a crack growth of 0.5 mm (corresponding to 25 completely damaged cohesive elements) for different crack lengths are listed inTable 2. In fact, for all crack
Fig. 9. Averaged maximum force in fracture experiments.
Fig. 10. Discrete values of Ucvs. crack length (blue dots) andfitted straight line (solid blue line). (For interpretation of the references to color in this figure legend, the
reader is referred to the web version of this article.)
lengths analyzed, the valueΓ0=1.7kJ/m2enabled the best prediction of initiation of crack growth.
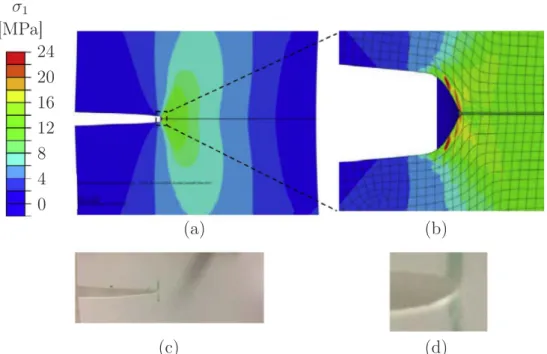
InFig. 13, an example of an arrested and blunted crack tip is shown (a=28mm). The distribution of the maximum principal true (Cauchy) stress, σ1, is shown.Fig. 13(a) shows the whole PE sheet (mesh not shown for the sake of clarity), andFig. 13(b) shows a close-up of the blunted crack tip. The damaged cohesive elements can be seen at the blunted crack tip. About 25 cohesive elements have been completely damaged, which corresponds to a crack increase of 0.5 mm.
Fig. 12. Variation in Jfffrom simulations (symbols) compared to the experimental estimate, 13 kJ/m2(dashed line).
Table 2
Estimations of local fracture energy.
ai Pcr,i Tmax Γ0 Jff [mm] [N] [MPa] [kJ/m2] [kJ/m2] 24 164 20 1.7 11.0 26 170 20 1.7 13.5 28 153 20 1.7 14.0 30 137 20 1.7 14.0 32 124 20 1.7 13.5 34 108 20 1.7 12.5 36 95.5 20 1.7 13.5 24 164 15 1.9 11.0 24 164 25 1.5 11.0
Fig. 13. Geometry of the crack and stress distribution at initiation of crack growth fora=28mm; (a) stress distribution in whole simulated specimen ( =P Pcr=153N andΓ0=1.7kJ/m2), (b) close-up of the crack tip region, (c) image of the corresponding test specimen in the experiments, and (d) close-up of the crack tip in the experiment.
InFig. 13(c) and (d), images of the physical crack geometry from one of the experimental tests are shown (alsoa=28mm). These images are also taken at the very instant of initiation of crack growth.Fig. 13(c) shows the whole crack, and a comparison with
Fig. 13(a) reveals that the geometry of the predicted crack agrees well with the physical test, both qualitatively and quantitatively. The same conclusion holds for the close-up images inFig. 13(b) and (d).
The solution inFig. 13is forΓ0=1.7kJ/m2, which resulted in an array of completely damaged cohesive elements with a length of
about 0.5 mm. ChangingΓ0by± 0.1kJ/m2would, in general, change the predicted crack growth by∓5–10 cohesive elements, i.e.
∓0.1 mm. Hence, determination ofΓ0beyond two significant figures was not deemed meaningful.
As indicated above, the dominating parameters of the cohesive law areΓ0andTmax. For this reason, the influence of the maximum traction,Tmax, was also investigated. Hence, the resulting estimate ofΓ0for the casesTmax=15MPa andTmax=25MPa were also determined, and the outcome is shown at the bottom ofTable 2. As can be seen, a change of± 5MPa inTmaxcauses a change of 0.2 kJ/m2in the estimated value ofΓ0. An increase inTmaxmeans that the plastic strains at the crack tip must increase in order to produce stresses that enable damaging of the cohesive elements, which in turn means that more plastic dissipation takes place. Thus, less local fracture energy in terms ofΓ0is required to withstand a given external load. In other words, for a given total work of fracture, increasingTmaxcauses a redistribution from local fracture energy,Γ0, to dissipation in the form of crack tip plasticity.
The influence of the mesh was also investigated. A mesh where the size of the smallest bulk and cohesive elements was doubled was utilized in a simulation for the casea=24mm (andTmax=20MPa). The resulting estimate ofΓ0was 2.0 kJ/m2. Thus, a certain mesh dependence exists in the present results, but the overall tendencies should still be valid. Furthermore, the influence of the initial stiffness in the cohesive law, En, was checked by applying a double stiffness,En=600MPa/mm (using standard values for the other model parameters). This modification did not cause any change in the estimated value ofΓ0, i.e.Γ0=1.7kJ/m2was still the estimated value of the local fracture energy. One simulation with an increased simulation time,ts=1s, was also done, to ensure that inertia did not affect the simulation results. A change in tsfrom 0.1 s to 1 s did not cause any significant changes in the simulation results. 6. Discussion and concluding remarks
The fracture mechanics properties of PE are of great practical interest. Crack initiation and growth in polyethylene seem to take place through formation and subsequent breakdown of a craze zone ahead of the crack tip[31–34]. This process is driven by localized plastic strains, initiation and coalescence of voids, and formation offibrils that eventually fail. This is the damage process that governs the fracture toughness of polyethylenes. Chudnovsky et al.[33,35]provide a detailed theoretical analysis of this damage process through their‘crack layer’ concept, but in general, the damage process can be well described by the more simple cohesive zone approach.
The cohesive zone approach, adopted in the present study, is a powerful computational tool for modelling crack initiation and growth. This approach requires (among other things) knowledge of the local fracture energy of the material. One of the outcomes of the present study is an estimate of this local fracture energy for LDPE. The cohesive zone approach has also been employed in several other studies for modelling crack growth in polyethylenes. For instance, Ivankovic et al.[36]use a similar computational framework as in the present study and simulate crack growth in a polyethylene three-point-bending test specimen. The works by Ting[34]and Janko et al.[37]are other examples.
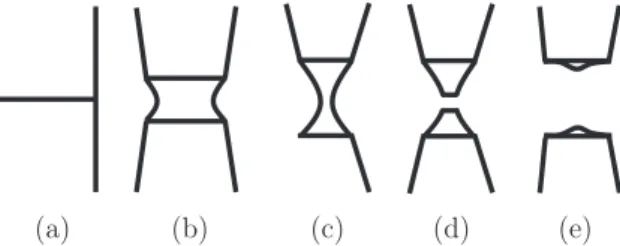
A qualitative investigation of the crack tip deformations was performed using a microscopy, seeFig. 14. The evolution steps in
Fig. 14were determined by examining the crack growth under magnification. Steps (a)–(c) demonstrate that a strain localization occurs at the growing crack tip. Finally, the localized portion ruptures, shown in (d), and the material relaxes and recovers partially, as shown in (e). In the relaxed configuration after failure, there is a remaining ridge in the middle of the fracture surface, as illustrated in (e). Clearly, there is a lot of plasticity involved at the crack tip. Even so,final rupture does not seem to take place by complete plastic collapse, since the remaining thickness of the sheet atfinal failure is still substantial.
InFig. 15, images of the crack surface are shown from two slightly different angles. (Hence, the images inFig. 15were retrieved after substantial crack growth had taken place in the specimen rather than at crack initiation.) As mentioned in connection to
Fig. 14(e), the failure process leaves a remaining ridge of ruptured material, and this ridge can be seen in both Fig’s15(a) and (b). The width of the fracture surface could be estimated from the images, yielding a width of aboutBd=0.30mm. This means that the remaining thickness is0.3/0.6=50% of the initial thickness. This measurement agrees very well with the numerical analyses, where the remaining thickness was predicted to be about 50–55% of the original thickness.
Several measurements of the fracture properties of polyethylenes have been reported in the literature. For instance, many at-tempts have been made to establish the essential work of fracture. However, the dispersion in these estimates is significant. This
dispersion can probably be attributed to differences in experimental method, but above all to differences in molecular structure and processing of the materials. For HDPE, the estimates range from 1.7–2.9 kJ/m2
[38]up to 20–40 kJ/m2[24]and with other estimates in between[39,40]. For LLDPE, the estimates fall in the range 20–58 kJ/m2[21,41,26]. The type of PE used in the present study is an
LDPE, and the estimates for this grade that are to be found in the literature are 1.4 kJ/m2[42], 1.8–2.7 kJ/m2[38], 11 kJ/m2[21],
23 kJ/m2[25], 35 kJ/m2[43], and 6–40 kJ/m2[44], where the last study was performed on thinfilms of different thickness. The numbers above are supposed to be estimates of the local fracture energy of these polyethylene grades, but the highest of them seem to rather reflect the total work of fracture. The total work of fracture of these materials has also been estimated experimentally; for HDPE, 29 kJ/m2[13], and 10–40 kJ/m2[45](variation due to differences in loading rate), and for LDPE, 10 kJ/m2[14]and 82.6 kJ/m2[46].
Hence, the estimate of the total work of fracture of LDPE by Garcia Brosa et al.[14]agrees well with the present estimate of 13 kJ/m2. Also, the lower estimates of the local fracture energy (or essential work of fracture), i.e. the values reported by Wang et al. [42]and Semrick[38], agree well with the present estimate ofΓ0, i.e. 1.7 kJ/m2. The estimate forΓ0was surprisingly constant when evaluated for different crack lengths. That is, the value 1.7 kJ/m2was, in fact, obtained for all crack lengths tested.
As discussed above, the two main parameters of the cohesive law are the local fracture energy,Γ0, and the maximum traction,Tmax. In one study by Pandya and Williams, an attempt was made to determine experimentally the parameters in the cohesive law of an HDPE material[45]. According to those results, the maximum traction,Tmax, can be expected to vary depending on the deformation rate. A rate-dependent maximum traction was not accounted for in the present analysis. However, another interesting result from the study by Pandya and Williams was that the ratio between the rate-dependent maximum traction and the (like-wise) rate-dependent yield stress seemed to be fairly constant, i.e.Tmax/σy≈2, where σydenotes an isotropic but rate-dependent yield stress. In the present study, we adopted the valueTmax=20MPa, which thus seems justified, since the yield stress in MD was about 10 MPa. The influence of variations inTmaxwas investigated in the present study, and as demonstrated in Section5, the choice ofTmaxdoes have an influence on the resulting fracture energy,Γ0.
The local fracture energy,Γ0, and the total work of fracture,Jff, were estimated to 1.7 and 13 kJ/m2, respectively. In other words, the local fracture energy is estimated to contribute with somewhat more than 10% to the total work of fracture, and the rest must be attributed to plasticity, damage and other dissipative processes around the crack tip.
The low-density polyethylene material considered in the present work is rate-dependent, and the rate-dependency was quantified in a previous paper by the present authors[28]. The fracture mechanics testing in the present study was performed at a low deformation rate, in order to minimize the influence of the deformation rate. However, the attained value of the local fracture energy,
Γ0, can hardly be expected to be a material constant. Hence, changing the loading rate is expected to produce a different value ofΓ0 (either higher or lower), i.e.Γ0is also expected to be rate-dependent. As discussed above, the fracture process at the very tip of the crack does not consist of a’clean’ separation of two smooth surfaces, but rather of a sequence of complex viscous damage processes. A significant rate-dependence inΓ0is therefore to be expected.
In summary, an experimental and numerical study of the fracture mechanics behaviour of injection-moulded low-density poly-ethylene has been performed. The total work of fracture was determined experimentally, where the testing was performed on sheets with side cracks. The local work of fracture was estimated through numerical analyses, where the initiation of crack growth was simulated. In the numerical formulation, initiation of crack growth was modelled by use of a cohesive zone and an associated traction-separation law. The estimated local work of fracture is consistent with previous experimental measurements of the essential work of fracture of the material in question, and the total work of fracture, retrieved from the present experiments, agreed well with the calculated farfield values of the J-integral from the numerical analyses.
Acknowledgements
The authors acknowledge the support from The Knowledge Foundation in Sweden, Grant No. 20150165, and from Tetra Pak.
References
[1] Tvergaard V, Hutchinson JW. The relation between crack growth resistance and fracture process parameters in elastic-plastic solids. J Mech Phys Solids 1992;40:1377–97. [2] Kroon M. Steady-state crack growth in rubber-like solids. Int J Fracture 2011;169:49–60.
[3] Kroon M. Dynamic steady-state analysis of crack propagation in rubber-like solids using an extendedfinite element method. Comput Mech 2012;49:73–86. [4] Kroon M. Energy release rates in rubber during dynamic crack propagation. Int J Solids Struct 2014;51:4419–26.
[5] Barenblatt GI. The formation of equilibrium cracks during brittle fracture. general ideas and hypotheses. axially symmetric cracks. J Appl Math Mech 1959;23:622–36. [6] Dugdale D. Yielding of steel sheets containing slits. J Mech Phys Solids 1960;8:100–4.
[7] Needleman A. An analysis of decohesion along an imperfect interface. Int J Fracture 1990;42:21–40.
[8] Camacho G, Ortiz M. Computational modeling of impact damage in brittle materials. Int J Solids Struct 1996;33:2899–938.
[9] Kroon M, Faleskog J. Micromechanics of cleavage fracture initiation in ferritic steels by carbide cracking. J Mech Phys Solids 2005;53:171–96.
[10]Ait Hocine N, Abdelaziz MN, Ghfiri H, Mesmacque G. Evaluation of the energy parameter J on rubber-like materials: comparison between experimental and numerical results. Eng Fract Mech 1996;55:919–33.
[11]Ait Hocine N, Abdelaziz MN, Mesmacque G. Experimental and numerical investigation on single specimen methods of determination of J in rubber materials. Int J Fracture 1998;94:321–38.
[12]Ait Hocine N, Abdelaziz MN, Imad A. Fracture problems of rubbers: J-integral estimation based uponη-factors and an investigation on the strain energy density distribution as a local criterion. Int J Fracture 2002;117:1–23.
[13]Chan MKV, Williams JG. J-integral studies of crack initiation of a tough high density polyethylene. Int J Fracture 1983;23:145–59.
[14]Garcia Brosa V, Bernal C, Frontini P. Calibration of fracture mechanics parameters andJ R− curve determination in polyethylene side-grooved arc-shaped specimens. Eng Fracture Mech 1999;62:231–48.
[15]Joe CR, Kim BH. A method to determine the R-curve offlexible materials using a monotonic loading of a single trouser tear specimen. Int J Fracture 1990;44:15–26. [16]Kim BH, Joe CR. A method to evaluate critical J-integral value: locus method. Polymer Test 1987;7:355–63.
[17]Kim BH, Joe CR. Comparison of the locus and the extrapolation methods that determine the critical J-integral in the presence of remote energy dissipation. Eng Fracture Mech 1988;30:493–503.
[18]Kim BH, Joe CR. Single specimen test method for determining fracture energy (Jc) of highly deformable materials. Eng Fracture Mech 1989;32:155–61. [19]Mai YW, Cotterell B. On the essential work of ductile fracture in polymers. Int J Fracture 1986;32:105–25.
[20]Martinez AB, Gamez-Perez J, Sanchez-Soto M, Velasco JI, Santana OO, Maspoch ML. The essential work of fracture (EWF) method - analyzing the post-yielding fracture mechanics of polymers. Eng Fail Anal 2009;16:2604–17.
[21]Casellas JJ, Frontini PM, Carella JM. Fracture characterization of low-density polyethylenes by the essential work of fracture: changes induced by thermal treatments and testing temperature. J Appl Polymer Sci 1999;74:781–96.
[22]Fayolle B, Verdu J. EWF method to study long term fracture properties of cross-linked polyethylene. Polym Eng Sci 2005;45:424–31.
[23]Kwon HJ, Jar PYB. Application of essential work of fracture concept to toughness characterization of high-density polyethylene. Polym Eng Sci 2007;47:1327–37. [24]Peres FM, Schön CG. Application of the essential work of fracture method in ranking the performance in service of high-density polyethylene resins employed in pressure
pipes. J Mater Sci 2008;43:1844–50.
[25]Costa FR, Satapathy BK, Wagenknecht U, Weidisch R, Heinrich G. Morphology and fracture behaviour of polyethylene/Mg-Al layered double hydroxide (LDH) nano-composites. Eur Polym J 2006;42:2140–52.
[26]Yang W, Xie BH, Shi W, Li ZM, Liu ZY, Chen J, et al. Essential work of fracture evaluation of fracture behavior of glass beadfilled linear low-density polyethylene. J Appl Polym Sci 2005;99:1781–7.
[27]Karger-Kocsis J, Barany T, Moskala EJ. Plane stress fracture toughness of physically aged plasticized PETG as assessed by the essential work of fracture (EWF) method. Polymer 2003;44:5691–9.
[28]Kroon M, Andreasson E, Persson Jutemar E, Petersson V, Persson L, Dorn M, et al. Anisotropic elastic-viscoplastic properties atfinite strains of injection-moulded low-density polyethylene. Exp Mech 2018;58:75–86.
[29] ABAQUS/Standard User’s Manual, Version 6.16. Providence (USA): Dassault Systemes SIMULIA Corp.; 2016. [30]Hill R. A theory of the yielding and plasticflow of anisotropic metals. Proc R Soc Lond A 1948;193:281–97. [31]Bhattacharya SK, Brown N. The initiation of crack growth in linear polyethylene. J Mater Sci 1985;20:2767–75. [32]Duan DM, Williams JG. Craze testing for tough polyethylenes. J Mater Sci 1998;33:625–38.
[33]Chudnovsky A, Shulkin Y. Application of the crack layer theory to modeling of slow crack growth in polyethylene. Int J Fracture 1999;97:83–102.
[34] Ting SKM. The study of crack growth in polyethylene using traction-separation laws, Ph.D. thesis. Imperial College of Science, Technology and Medicine; 2003. [35]Zhang H, Zhou Z, Chudnovsky A. Applying the crack-layer concept to modeling of slow crack growth in polyethylene. Int J Eng Sci 2014;83:42–56.
[36]Ivankovic A, Pandya KC, Williams JG. Crack growth predictions in polyethylene using measured traction-separation curves. Eng Fracture Mech 2004;71:657–68. [37]Janko M, Ecker W, Pinter G, Kolednik O. Numerical simulation of crack growth in polyethylene composites by means of the cohesive zone model. Macromol Symp
2012;311:1–8.
[38] Semrick K. Determining fracture toughness by orthogonal cutting of polyethylene and wood-polyethylene composites, Master’s thesis. Oregon State University; 2012. [39]Kwon HJ, Jar PYB. Toughness of high-density polyethylene in shear fracture. Int J Fracture 2007;145:123–33.
[40]Kwon HJ, Jar PYB. New energy partitioning approach to the measurement of plane-strain fracture toughness of high-density polyethylene based on the concept of essential work of fracture. Eng Fracture Mech 2007;74:2471–80.
[41]Pedrazzoli D, Ceccato R, Karger-Kocsis J, Pegoretti A. Viscoelastic behaviour and fracture toughness of linear-low-density polyethylene reinforced with synthetic boehmite alumina nanoparticles. Polym Lett 2013;7:652–66.
[42]Wang MD, Nakanishi E, Hashizume Y, Hibi S. Fracture energy analysis of single-edge-cracked isotropic ductile polyolefins. Polymer 1992;33:3408–14.
[43] Cao W. Two new approaches to toughness characterization of polyethylene - case studies on low-density polyethylene and ultra-high-molecular-weight polyethylene, Master’s thesis. University of Alberta; 2011.
[44]Rennert M, Nase M, Lach R, Reincke K, Arndt S, Androsch R, et al. Influence of low-density polyethylene blown film thickness on the mechanical properties and fracture toughness. J Plastic Film Sheet 2013;29:327–46.
[45]Pandya KC, Williams JG. Measurement of cohesive zone parameters in tough polyethylene. Polym Eng Sci 2000;40:1765–76.