AN AGENT-BASED APPROACH TO SOCIAL LICENSE
DURABILITY
by Kyle Bahr
c
Copyright by Kyle Bahr, 2015 All Rights Reserved
A thesis submitted to the Faculty and the Board of Trustees of the Colorado School of Mines in partial fulfillment of the requirements for the degree of Doctor of Philosophy (Mining and Earth Systems Engineering).
Golden, Colorado Date Signed: Kyle Bahr Signed: Dr. Masami Nakagawa Thesis Advisor Golden, Colorado Date Signed: Dr. Priscilla Nelson Professor and Head Department of Mining Engineering
ABSTRACT
Public expectations for what constitute responsible practices of mining and other extrac-tive companies have been evolving and becoming evermore complex. As focal organizations struggle to come to terms with increased expectation, tools must be developed to assess performance and, if possible, predict and forecast how their performance will be received by stakeholders in the future.
The main purpose of this work is to provide a tool for assessing the current state and longevity of public perceptions of corporations who are already measuring their social per-formance. This tool should allow managers and other decision makers within a focal orga-nization to plan for and manage social risk to their operations by giving them a sense of the potential social outcomes that a specific project may generate. In addition, it may provide insight to others interested in the social license of a given project, such as governments, NGO’s, and individual stakeholders and stakeholder groups.
The work provided herein is comprised of an agent-based model of fluctuations in social license to operate through the use of opinion diffusion and stakeholder network creation. Agent-based modeling is a bottom-up approach that explores complex macroscopic phenom-ena through the implementation of simple microscopic rules for the behavior of individual agents. This method allows researchers to explore and quantify potential outcomes.
The model created for this work demonstrates the change in social license for a group of stakeholders with a specific distribution of influence and individual consensus levels.
Fur-TABLE OF CONTENTS
ABSTRACT . . . iii
LIST OF FIGURES . . . vii
LIST OF TABLES . . . xi
LIST OF SYMBOLS . . . xii
LIST OF ABBREVIATIONS . . . xiii
ACKNOWLEDGMENTS . . . xiv
DEDICATION . . . xv
CHAPTER 1 INTRODUCTION . . . 1
CHAPTER 2 STAKEHOLDER ANALYSIS AND SOCIAL LICENSE TO OPERATE . 5 2.1 Corporate Social Responsibility (CSR) . . . 5
2.2 Social License to Operate (SLO) . . . 8
2.3 The Role of Complex Systems in SLO . . . 16
CHAPTER 3 AGENT-BASED MODELING . . . 17
3.1 Evolution of ABM . . . 18 3.2 Model Architecture . . . 25 3.3 Model Characteristics . . . 27 3.3.1 Agents . . . 27 3.3.2 Rules . . . 29 3.3.3 Environment . . . 29 3.4 Applications . . . 30
3.5 ABM of Information Diffusion . . . 33
CHAPTER 4 AGENT-BASED MODEL OF OPINION DIFFUSION . . . 34
4.1 Primary Opinion Diffusion Model . . . 35
4.1.1 Agents, Variables, and Environment . . . 35
4.1.2 Interactions . . . 37
4.1.3 Output . . . 40
4.1.4 Initial Case Studies . . . 41
4.2 Model Enhancements . . . 44
4.2.1 The Problem of Consensus . . . 44
4.2.2 Reciprocity . . . 45
4.2.3 Case Study: Absolute Consensus Model . . . 47
CHAPTER 5 AGENT-BASED MODEL OF STAKEHOLDER NETWORK . . . 53
5.1 Network Analysis . . . 53
5.1.1 Network Characteristics . . . 54
5.1.2 Metrics . . . 58
5.2 Agent-based Network Model . . . 67
5.2.1 Dynamic Influence . . . 68
5.2.2 Equivalent Influence . . . 70
6.3 Parameter Scaling with Network Size . . . 94
CHAPTER 7 CONCLUDING REMARKS AND FUTURE WORK . . . 96
REFERENCES CITED . . . 98
APPENDIX A - MODEL INTERFACE . . . 108
A.1 Model Initialization . . . 109
A.2 Varying Parameters . . . 113
A.3 Features . . . 113
A.4 Monitoring . . . 116
APPENDIX B - RUNNING THE MODEL . . . 124
LIST OF FIGURES
Figure 2.1 Types of stakeholder based on power, interest, and legitimacy.
Adapted from Mitchell et al. by Chevalier and Buckles. . . 12
Figure 2.2 Social license levels and boundary criteria . . . 14
Figure 2.3 Social license durability as a function of network structure type . . . 15
Figure 3.1 Game of Life: initial state . . . 19
Figure 3.2 Game of Life: 58 timesteps . . . 20
Figure 3.3 Life structures . . . 21
Figure 3.4 Game of Life: developed . . . 22
Figure 3.5 Schelling segregation: initial state . . . 24
Figure 3.6 Schelling segregation: 75% preference for similarity . . . 25
Figure 3.7 Schelling segregation: 33% preference for similarity . . . 26
Figure 3.8 Power grid model with environmental interaction . . . 31
Figure 4.1 A simple agent-based environment . . . 37
Figure 4.2 Community-community two agent interaction . . . 39
Figure 4.3 Model output, 1 CSR agent initial condition . . . 40
Figure 4.9 Time averaged distributions . . . 49
Figure 4.10 Distribution of agents over license categories over the course of a typical run . . . 51
Figure 4.11 Timesteps to consensus with variable reciprocity . . . 52
Figure 5.1 Maslow . . . 55
Figure 5.2 Graph . . . 56
Figure 5.3 Adjacency Matrix . . . 57
Figure 5.4 Matrix graphs for binary, non-binary, symmetric, and asymmetric adjacency matrices . . . 58
Figure 5.5 Traffic distinctions . . . 61
Figure 5.6 Serial path . . . 62
Figure 5.7 Transfer trail . . . 62
Figure 5.8 Parallel Walk . . . 63
Figure 5.9 Trajectory distinctions . . . 63
Figure 5.10 Simple network for centrality comparison . . . 67
Figure 5.11 Model outcomes with and without equivalent influence logic . . . 72
Figure 5.12 Network link creation . . . 74
Figure 5.13 Stakeholder network templates from Boutilier . . . 75
Figure 5.14 ABM network templates . . . 77
Figure 5.15 Initial “seed” network: factions. . . 78
Figure 5.16 Equality network . . . 79
Figure 5.17 Committee/tribe network . . . 81
Figure 5.18 Accountable leadership network . . . 82
Figure 5.20 Exclusive elite network . . . 84
Figure 5.21 No organization network . . . 85
Figure 5.22 Emergent leader network . . . 86
Figure 5.23 Dictatorship network . . . 87
Figure 5.24 Relationship between global model parameters and network structures. . 89
Figure 6.1 Global and local network stability wells . . . 92
Figure 6.2 Accountable leadership network from alternative link-decay/attachment-preference settings . . . 93
Figure A.1 Model interface . . . 108
Figure A.2 Attribute File . . . 111
Figure A.3 Adjacency matrix file . . . 112
Figure A.4 Inputs . . . 113
Figure A.5 Buttons . . . 114
Figure A.6 Network Layouts . . . 115
Figure A.7 Global model parameters . . . 116
Figure A.8 Model logic and visualization features . . . 117
Figure A.9 Link information displayed . . . 118
Figure A.10 License and influence distribution monitors . . . 119
Figure B.3 Behavior-space run dialogue . . . 127 Figure B.4 Save output as .csv . . . 127 Figure B.5 Behavior-space monitoring options . . . 128
LIST OF TABLES
Table 2.1 Theoretical and Agent-based SLO levels. . . 14
Table 3.1 ABM Applications . . . 32
Table 4.1 Opinion levels and license categories. . . 36
Table 4.2 Numerical and qualitative influence levels. . . 36
Table 4.3 Absorption of CSR messages by license category . . . 38
Table 4.4 Community-community interaction proportions . . . 39
Table 4.5 Bi-directional opinion diffusion matrix. . . 47
Table 5.1 density equations . . . 59
Table 5.2 Freeman closeness, Freeman degree, and eigenvector centralities for a simple network . . . 67
LIST OF SYMBOLS
Numerical opinion of agents . . . x Timesteps . . . t Numerical influence value . . . I Numerical license value . . . L Amount of available opinion . . . X
LIST OF ABBREVIATIONS
Agent Based Modeling . . . ABM Cellular Automata . . . CA Corporate Social Responsibility . . . CSR Social License to Operate . . . SLO
ACKNOWLEDGMENTS
I would like to acknowledge the phenomenal support of my dissertation advisor, Dr. Masami Nakagawa, whose dedication to his students has consistently eclipsed my highest expectations. I would also like to express my sincere appreciation to the members of my dissertation committee, who have taken time to work with me throughout the production of this thesis: Dr. Jessica Rolston, Dr. Robert Boutilier, Dr. Jason Delborne, Dr. John Grubb, and Dr. Murray Hitzman. I would like to thank Javier Diez de Medina, Juan Mamani, Vivian Barrios, and Patricia Dalence, whose input and encouragement were instrumental in completing this work.
I am forever grateful for the thoughts and prayers of my wonderful family, who have always loved and supported me. My parents, Mark and Judy Bahr, always encouraged my curiousity, even though it meant lots of hospital bills for them. My brothers Kelly and Brennan Bahr, and my sister, Shawnee Wolfe are the best siblings I could ask for, and they have always been there for me when I needed them most. Most of all, I am eternally indebted to my loving wife Jessica and my amazing daughter Hazel, who make our home a paradise. I would also like to thank the many wonderful teachers who have helped me along the way. Specifically, Stephanie Parrish, David Wu, Carolyn Koh, Christian Frenzel, and Bill Wilson. My sincerest thanks are owed to all my wonder friends: Dustin and Linda Timmins, Caleb and Ellen Speirs, Michael and Rachel Young, Doug and Joanne Colby, and the entirety of the Ireland Dublin Mission. Finally, I thank God, who preserves me from day to day.
CHAPTER 1 INTRODUCTION
Minerals are the force behind the high standard of living currently enjoyed by societies with developed economies. They fuel our travel, power our homes, and transport our food, not to mention that the majority of all the products we consume are made from a variety of minerals. The need to extract and process an increasing amount of mineral products comes as the global population increases and an ever growing number of consumers are created as nations develop. At the same time, public scrutiny of and expectation for the ethical behavior of extractive operations is also increasing.
As agents of the corporation, managers have struggled to understand and respond to the rapid changes in public expectation over the past three decades. This is evidenced by the vast body of literature on the subjects of business ethics and corporate social responsibility, and a general lack of agreement on what the social responsibilities of a corporation actually are and how they should be executed. Even the reasons for the increased interest in corpo-rate social responsibility remain unclear. This conversation will and should continue to be ongoing, as minerals continue to be produced and public expectations continue to evolve. The major hypothesis of this work is that agent-based modeling is a methodology that can significantly expand the manager’s toolkit for monitoring and forecasting their ability to manage the expectations of their stakeholders through the use of Social License to Operate (SLO). Though the primary users of this work are envisioned to be mine managers and other professionals, it may also provide insight to others interested in the social license of a given project, such as governments, NGO’s, and individual stakeholders and stakeholder groups.
The tools developed in this dissertation are a set of Agent-Based Models (ABM), which utilize the bottom-up approach of allowing individual-level decision-making to drive larger social phenomena. The ability to gain macroscopic information from microscopic interactions
is very powerful, as it allows for a wide range of complex behavior to be observed, while simplifying and minimizing the need for model inputs. The behavior of interest in this work is the ability of a diverse group of stakeholders to issue a level of social license, and the durability of that license once it has collectively been decided.
This work constitutes a novel approach to social license durability in the following ways: • It applies a new scientific methodology (agent-based modeling) to the area of
stake-holder analysis
• It utilizes a new set of algorithms and interactions rules to monitor the interaction of stakeholders
• These interaction rules are used to produce stakeholder networks which can be analyzed for social license and stakeholder network outcomes
• The final model has forecasting capabilities; it can give information about the potential for social license changes from a given set of initial conditions
This thesis has been organized into seven chapters, including the introduction. In chapter 2, the motivation for this research is set forth, including a short history of Corporate Social Responsibility (CSR) and it’s definitions, and some of the overarching themes and broad questions that CSR seeks to address. It also includes an exploration of some of the criticisms of CSR as a business practice. The concept of Social License to Operate (SLO) is also explored, including some discussion on the advent of SLO as a reaction to public expectation. The chapter explores the major questions of who issues social license, and to whom social
some of the major developments being highlighted. The general architecture of the method is then discussed, including definitions of agents, environment, variables, and an overview of the modeling cycle. Some of the applications of ABM are described as a precursor to the specific application represented by this work.
Chapter 4 is concerned with the primary model created for this research. The purpose of the primary model is to explore how the social license issued by individual stakeholders can change based on individual stakeholder interactions. Interaction rules for this model are based on the diffusion of information through repeated contact of agents, in which opinion is transferred and the social license of the group as a whole may be inferred by the emergence of patterns of individual levels of consent. The mechanism for diffusion of opinion from one agent to another is the differential influence between two interacting agents. Two types of agent were originally proposed, and case studies were performed to prove the internal consistency of the program, as well as to validate the model through its ability to produce an expected result. Following a discussion of the results of the primary model, several enhancements were proposed to increase the complexity of the model and provide more nuanced rules for the interactions. The major proposed enhancement to the primary model is the addition of reciprocity in order to produce mutual interaction as agents exchange opinion with each other instead of just having opinion dictated from one agent to the other. The enhanced model was subjected to a further case study to ensure the continuation of internal consistency. The case study tested two sets of initial conditions, and the results include average distributions of agents over the license and influence variables. Also included is a discussion of the time required by the model for a consensus to emerge.
The primary model is further enhanced in chapter 5, in which a new level of complexity is introduced in the form of network links that tie interacting agents in the overall stakeholder network. A brief discussion of network characteristics is given in order to explain the addi-tion of network logic to the model. Several metrics used in measuring network properties are explained, including density, clustering, and centrality. Different metrics of centrality
are explored, which includes a discussion types of network flow, which is an essential con-sideration when choosing a metric for analysis or use in agent decision making. The actual enhancements to the model are then set forth. The centrality measure of Freeman degree is used by agents to determine the influence of individual agents dynamically, rather than having them set a priori. Because the mechanism for opinion transfer is the differential in-fluence of two agents, an “equivalent inin-fluence” scheme is introduced as a means to provide interaction rules for agents who have no difference in influence and would otherwise not interact. A case study was run to determine the effect that the equivalent influence scheme has on the behavior of the model and the results are then discussed. The concept of decay is set forth as a mechanism for the disappearance of links from the network in order to balance the formation of links that occurs as agents interact. Finally, the evolution of one network into another is discussed, and the implications of such evolutions on the network’s ability to issue and maintain a social license is considered.
Chapter 6 provides a discussion of some of the significant findings of the model tests, including the stability of networks that are produced. Some of the networks are very robust, and act as boundary reference points for the other structures. Some structures are self-sustaining within a narrow set of parameters, and some structures are unstable and merely act as transitory states as the network develops from one structure to another. A discussion is also included on how the scaling of one variable affects another, and the probability of agent interaction and link formation. The scaling of variables also applies to the number of agents in the model as the probability of interaction changes depending on the number of agents available for interaction.
CHAPTER 2
STAKEHOLDER ANALYSIS AND SOCIAL LICENSE TO OPERATE
Corporate Social Responsibility (CSR) as a topic has a broad spectrum of opinions, defi-nitions, applications, and political and economic implications associated with it. While it is not the aim of this work to debate the ethics or efficacy of CSR, a discussion of the theoret-ical foundation and the benefits, critiques, and challenges associated with CSR (especially in its manifestation as Social License to Operate) is necessary in order to understand the potential uses and benefits of the models that are proposed in later chapters.
2.1 Corporate Social Responsibility (CSR)
The concept of CSR has been evolving for more than 50 years, and has woven together themes from different areas of business ethics1. The term “Corporate Social Responsibility” has become an emblem for the whole debate about the proper or desired role of business in society. It is generally thought of as an attempt by industry to react to an ever-increasing public expectation of what companies should provide for society [2, 3]. In turn, the public’s expectation seems to be a reaction to the risks and costs to communities because of bad practices [4–6]. Speaking specifically about oil and gas development, Jaquet points out several risks that communities face in their potential interactions with corporations, such as rapid industrialization and its associated problems, uneven distribution of costs and benefits, inter-community conflict, and social-psychological stress [7]. A satisfactory definition of CSR has not yet emerged, partially because from the early days of CSR there has been debate about what the moral responsibility of the corporation is, if it has one at all. Friedman famously argued that the social responsibility of the corporation is to maximize profits, and that any attempt at social work by companies is unethical because it requires an agent of the corporation (executives, management, etc.) to spend money that belongs to stakeholders, 1for a thorough history of CSR, see Carroll, 1999 [1]
on projects that don’t represent the interest of the stockholders [8]. Other authors see the concept of CSR as being a pro-business attempt to justify expansion into vulnerable markets, while escaping the policing of government by appealing to the idea of self-enforcement of internal standards that are beyond the expectation of government [9, 10]. One general definition, put forward by the World Business Council for Sustainable Development, is as follows:
Corporate Social Responsibility is the continuing commitment by business to behave ethically and contribute to economic development while improving the quality of life of the workforce and their families as well as of the local community and society at large [11].
This definition captures many ideals that are central to the concept of CSR, such as economic development and quality of life of the workforce, focusing both on the community, and society. It neglects, however, the business-case for CSR, which deals with the motivations of business in participating in social improvement. This motivation was well summarized by Bhattacharya and Sen:
not only is “doing good” “the right thing to do,” but it also leads to “doing better” through its positive effects on key stakeholder groups [12].
Making a “business case” for CSR is one of the major challenges faced by CSR practitioners. The business case is most usually related to reducing or eliminating the costs associated with things like staff time spent on conflict management and operating time lost due to occupation or strikes [13, 14]. Porter and Kramer suggested the idea of Creating Shared
Several criticisms of CSV are leveled by Crane et al. (ibid.), perhaps the most compelling of which is the failure of CSV to address the tensions that exist between social and economic goals as these goals come into competition with each other.
One example of the tension that may exist between social and economic goals is captured by Gardner in the form of what she terms, “disconnect development” [16]. Disconnect development occurs when a company uses the rhetoric of partnership to actually distance themselves from local risks while maintaining the benefits of creating compliance within the community and creating a CSR “performance” for their global audience of shareholders. This happens because tension exists between the social goals of meaningful engagement with community stakeholders competes with the economic goals of minimizing risk and expenditure on social projects. Appel and Rajak document similar happenings as mining and oil and gas companies use infrastructure in one case and HIV/AIDS treatment in the other as a material and symbolic frame in which to abdicate social responsibility [10, 17]. In this situation, Gardner suggests that the company should become more involved with the community–even to the extent that they intervene in local governance by “pressing the governments they work with for greater transparency in their dealings”–in order to pursue the social goal, at the expense of the economic goal. But social and economic goals are not the only forces in tension.
It is also possible to see this kind of disconnect happening because of the competition of multiple social goals–Gardner points out the paradox that in order for development to be sustainable, the development must be able to continue even as the “donor” or “patron” symbolized by the company inevitably withdraws. In order to support the argument that companies must engage in a more permanent relationship with local communities, Gard-ner casts up sustainability as the “holy grail” of contemporary development work as an unattainable ideal to be replaced with a more realistic patron/beneficiary relationship be-tween business and local stakeholders. As will be discussed in the next section, Boutilier hypothesizes that this kind of patron/beneficiary relationship may be a characteristic of a
low level of social license in which interactions are characterized by a transactional relation-ship in which support is conditional on a flow of benefits and companies keep communities at arm’s length [18]. This is backed up by Zandvliet’s assertion that, “when companies do not engage with communities on a long-term basis, communities pressure companies for short-term gains” [19]. According to this view, the kind of disconnect development that Gardner discusses is an early stage of social license that must be worked through in order to achieve higher trust and reciprocity among the stakeholder community.
2.2 Social License to Operate (SLO)
The term Social License to Operate (SLO) was originally used in the context of the mining industry by Jim Cooney of Placer Dome as a metaphor for the mining industry’s need to improve its reputation after a period of intense public scrutiny following some high-profile social and ecological disasters which left public trust of the mining industry at an extreme low [20]. It is agreed that the concept of SLO emerged from this type of public scrutiny, though it is interesting to note that who or what was responding and being responded to, as well as the reasons for the response are debated. Owen and Kemp view it as a response to opposition and a mechanism to ensure the viability of the sector through the manipulation of stakeholders, whereas Prno and Slocombe assert that it was a response to demands by communities for a greater share of benefits and increased involvement in decision making [3, 21]. Whatever the reason, the idea behind SLO is that full compliance with law has become insufficient to satisfy society’s expectation for mineral extraction companies; now it is necessary to receive social permission from the communities and stakeholders who most are heavily affected by the extraction process [22]. SLO is a way of measuring the perception of
explored in the literature, such as: who issues social license? Is it a cohesive group, or a collection of individuals? If it is a group, who is included in the group? If it is individuals, which individuals are the most dominant in the decision to issue license? To whom is it granted? What does social license look like? How is it tracked and measured? How does it change over time? What factors contribute to the granting or denial of the social license? How is it tracked and measured? Is it possible to forecast probabilistic outcomes for future social license? To the degree that these questions have been addressed in the literature, some potential answers will be given in this section.
The first set of questions to be explored pertain to the identity of the grantors of SLO, and appeals to the area of stakeholder theory for answer2. The main challenge of stakeholder
theory is that of stakeholder identification, which is recognized by critics and proponents alike [9, 24–27]. In stakeholder theory, a stakeholder is defined as an actor that either affects, has potential to affect, is affected by, or has potential to be affected by a given project or issue [27]. This means that identification and classification of stakeholders is crucial in order to ensure the proper understanding of relevant stakeholders and the legitimate issuance of social license. Identification of stakeholders can be a complex process, partially because of what Thomson and Boutilier call, “the fiction of community as an entity,” and what Welker calls the “enactment of the corporation” [20, 28]. These ideas of corporate and community enactment revolve around the fact that groups, institutions, and organizations are not cohesive, coherent, homogenous entities unto themselves, but in fact are made up of individual agents with different values, ideals, and visions for the direction and future of their organizations. In Welker’s work, the corporation is conceptualized as departments contending for the finite resources that are collectively held, and decisions made by the firm are actually the result of the dynamics of this internal competition. Kemp and Owen cite this as a reason that CSR is not yet a core competence of the mining industry because, according to them (and corroborated by Welker), the CSR department of a company is
often seen as an auxiliary appendage that is pushing the agenda of community relations onto other departments [29]. Kemp and Owen go on to say that the pattern of relegating CSR underestimates the sustained negative impact on social performance of the corporation. Boutilier applies this concept to an even larger scope, examining the idea that because of the disconnected nature of departments within a company, single operations within a company of multiple operations, companies within an industry, and an industry within a sector, social license may be granted to one part and withheld from another (e.g. a department is granted social license while the larger operation is not, or vice versa) [30]. The interaction of distinct corporate agents deals with the question of who is seeking the social license, or to whom the license is granted. In other words, it is related to the question of identification of the focal organization. This is important, because it is necessary to understand that the solicitation and granting of social license is done at the intersection between management (CSR department) and community, which means that the tools for identifying, categorizing, and forecasting the behavior of stakeholders are used by managers, and therefore must be useful to them specifically [25, 31]. The question of who the other stakeholders are is related to the “fiction of community as an entity,” as noted above.
One current approach to stakeholder identification is found in the methodology of systems analysis and network theory. According to Boutilier:
To combine social networks with stakeholder theory it is only necessary to restrict membership in the network to stakeholders. Then the network is defined by the significance of stakes rather than by the nebulous notion of a ‘community’. The stakeholder network replaces the community as the grantor of the social license
graphs quickly reveal whether or not there are cohesive clusters of stakeholders that grant or withhold the social license. Network graphs can also show to what extent the project’s supporters or opponents are isolated, clustered, or central to the main component of the network. It quickly becomes obvious which ones are more influential and what levels of social license they grant. Debates about which groups or clusters of organisations represent the true views of the ‘community’ become irrelevant because the stakeholder network approach dispenses with the frequently false assumption that there is only one view [18].
There are several methods within network and stakeholder theory for identifying stakehold-ers. The first method relies on the local knowledge of experts within the focal organization to generate a list of stakeholders as perceived by the mine. This often leads to some stake-holders being marginalized because they are not acknowledged or considered by the manager to be difficult to manage [9]. Cragg and Greenbaum find that physical stakeholders are often included, while ideological stakeholders are disregarded [25]. This method, while providing an incomplete picture of who is included as a stakeholder, provides the starting point for what is known as “snowball sampling”. In snowball sampling, the initial stakeholder list is asked to identify other people and organizations that they consider to have a stake in the issue. This can help to find some of the hidden stakeholders by removing, or at least modify-ing the biases that lead to the original stakeholder list. The main deficiency of this method is that the resultant stakeholder list may be a product of stakeholders who form a limited network, and therefore are unaware of stakeholders belonging to a different component of the network. This modified list can be further updated by using the “key informant method”, in which stakeholder nominations come from well connected members of the domain, who may not have a stake in the issue themselves. This includes figures such as religious leaders, merchants, medical professionals, and others that are likely to interact with people from different socio-economic strata, and thus, able to identify stakeholders that may have been missed by the previous lists. Having a complete list, it is then important to classify
stake-holders according to the level of social license that they issue, as well as according to their level of influence in the overall stakeholder network. The level of social license issued may be determined by managers based on the level that stakeholders issued in the past, or it may be self-reported through sampling methods such as surveys, interviews, etc. The classification of stakeholders by influence level is outlined below.
Mitchell et al. propose a framework for classifying stakeholder influence according to their power, urgency, and legitimacy [26]. This framework was adapted by Chevalier and Buckles to replace urgency with interest [32]. Interest, in this context, can be thought of as the “stake” that an individual stakeholder has in a given project. This taxonomy allows for the delineation of different types of stakeholder according to Figure 2.1.
As the figure shows, the level of influence or importance of a stakeholder in this taxonomy can be attributed to its possession of a combination of power, interest, and legitimacy. Power is defined as access to resources that allow a stakeholder to act upon its interests. Interest is the stake or level of potential to be affected that a stakeholder has in a given issue or project. Legitimacy is the credibility that a stakeholder has to a claim in a given issue. The taxonomy shown in Figure 2.1 is the basis for the influence levels of agents in the ABM model, which will be discussed in chapter 4. The determination of which stakeholders fall into which influence category is part of the stakeholder definition stage, which must be done through the local knowledge of the focal organization or as part of the process in which stakeholders are initially identified. A framework for categorizing stakeholders according to these classifications is given by Chevalier and Buckles [32].
Once stakeholders are identified and classified, the overall level of social license that the stakeholder group issues can be assessed based on the individual social license issued, weighted by the overall centrality of influence of that individual stakeholder within the group. There are many suggested frameworks within the literature about the best way to monitor the SLO and CSR performance of a company. Some prefer reporting initiatives or global standards, while others advocate for the use of more localized and contextual measures [33, 34]. Some assert that compliance with strict government regulations is the most causal link between standards and social accountability [35]. The conceptual framework of social license levels and boundaries used in this work is that proposed by Thomson and Boutilier in the SME Mining Engineering handbook, which is a methodology of local sampling and empirical observation over time. The structure of social license levels hypothesized by Thomson and Boutilier are visualized in Figure 2.2.
These SLO levels form the basis of the agent-based SLO levels that will be discussed in chapter 4, and the relationship between these two metrics is shown inTable 2.1.
The contribution of individual stakeholder social license to the overall level of social license is determined by certain features and characteristics of the stakeholder network. A
Figure 2.2: Social license levels and boundary criteria [20].
Table 2.1: Theoretical and Agent-based SLO levels. Theoretical SLO levels ABM SLO levels
more thorough discussion of network theory and measures is given in chapter 5. For this section, we will limit the level of network analysis to the features of closure and core-periphery structure. It is hypothesized that these features determine the durability or resilience of the social license; closure, by determining the extent to which stakeholders are connected to each other and therefore able to organize and communicate, and core-periphery by determining the extent to which the social license of the most dominant stakeholders represent the social license of the less dominant stakeholders. Figure 2.3 shows the template structure proposed by Boutilier for social license durability [27]. The social license issued by network type is believed to go from less durable in the bottom left (no organization) to more durable in the top right (accountable leadership).
2.3 The Role of Complex Systems in SLO
Complex systems (discussed more thoroughly in chapter 3) are systems whose charac-teristics are emergent, dynamic, and often probabilistic [36]. The application of complex systems analysis is the cutting edge of SLO research. It has already been used to explore some of the factors that lead to granting or withdrawal of SLO in mining applications. For example, Prno and Slocombe recently advanced a novel systems-based framework for assess-ing SLO determinants and outcomes [37]. They discuss four possible stable states of SLO, namely:
1. SLO granted and the mine proceeds 2. SLO withheld and the mine proceeds
3. SLO granted and the mine does not proceed 4. SLO withheld and the mine does not proceed
The authors also discuss some of the reasons that each of these states could be reached, in order to understand more fully the resilience of SLO. The next step is to involve compu-tational complex systems architecture (such as agent-based modeling) to identify additional determinants, and forecast the durability of the SLO in order to improve the performance of extractive companies in their efforts to practice CSR. Some efforts have already been made in this direction [38, 39]. A large body of literature has shown the care that must be exercised when using technical tools to solve social problems, or else the products and artifacts that are produced will have no contextual use, and therefore be of little worth to the CSR field
CHAPTER 3
AGENT-BASED MODELING
Modeling has long been used as a means of simplifying complex phenomena through the use of analogy. There are mathematical models, sociological models, ethical models, biological models, chemical models–models for every branch and discipline imaginable. In any type of modeling, the goal is often not to perfectly reproduce a “real” object, but to understand some aspect of a whole by examining the underlying phenomena. There are many different types of models with a wide range of applications. There are many types of models, including qualitative–as in Bohr’s model of the atom–analytical–characterized by explicit formulas that describe a phenomenon–or quantitative, as in the numerical methods used to understand fluid flow. Models are useful tools that allow us to contextualize phenomena and behavior that is not well understood into something familiar, or at least tractable. Each type of model has its usefulness, and the type of model to use depends largely on what being modeled. The subject of this dissertation is agent-based modeling, a specific kind of computational model that uses qualitative and quantitative information at a microscopic level to produce information about a system at a macroscopic or aggregate level. It is useful for modeling systems that have no analytical solution, multiple scales of manifested behavior, and heterogeneous constitutive parts. Nigel Gilbert laid out some of the potential advantages of ABM:
ABM allows modelers to represent in a natural way multiple scales of analysis, the emergence of structures at the macro level for individual action, and various kinds of adaptation and learning, none of which is easy to do with other modeling approaches [43].
This kind of “bottom up” approach is concerned with how complex macro-level behavior can emerge from simple micro-level rules. In this chapter, we will explore some of the early
agent-based models in an effort to understand how these models are organized, what they require or how they are characterized, and the kind of emergent phenomena that they produce. It should be noted here that there are many variables and contextual specificities involved in determining and understanding a the dynamics between companies and stakeholders. In any kind of modeling it is necessary to narrow the possible variables in order for the model to be computationally manageable. This means that not all of the relevant variables are necessarily included in a given model, which represents one particular approach to knowledge creation. Understanding the limitations of modeling as a methodology is necessary in order for mine managers and others to correctly use the proposed model and interpret it’s results.
3.1 Evolution of ABM
The earliest manifestations of agent-based modeling was in the form of cellular automata (CA). The idea of CA came from the famous question, “could a machine be programmed to make a copy of itself,” or, could a man-made object be created that was complex enough to contain all of the information necessary for its own replication [44]? This question prompted much thought on the ability of organisms to self organize more complex forms of life. Even-tually mathematician John Conway proposed his “Game of Life” as an exploration of the concept of the self-replication of simple structures [45]. This is a good starting point to examine the way that complex behaviors may emerge from simple rules. In Conway’s game, there is an initial grid of cells, which have a random binary state of being either “alive” or “dead” (on or off, black or white, etc.) (Figure 3.1). The state of each cell in the next “move” or timestep is determined by its current state. There are three simple rules that decide the next state:
Figure 3.1: Game of Life: initial state
As each timestep passes, the cells have an opportunity to change, and very quickly certain patterns start to emerge. Figure 3.2 shows a run of the game after only 27 timesteps. Stable structures emerge, including blocks (Figure 3.3(a)) and behives (Figure 3.3(b)). As the model develops (Figure 3.4), the areas of random change (Figure 3.3(c)) are minimized, and more stable structures are produced, as well as some semi-stable self-replicating structures such as blinkers (Figure 3.3(d)) and gliders (Figure 3.3(e)). Blinkers are structures that alternate between horizontal and vertical in each timestep due to the vertical end-cells dying and horizontal end-cells being born (and vice versa). Gliders are structures that likewise alternate forms, but the alternating action causes them to move across the board until they meet some other structure.
(a) Block (b) Beehive (c) Unstable Struc-ture (d) Blinker (e) Glider
This early and rudimentary model shows one of the major features that characterizes agent-based modeling: that of emergent phenomena. Emergent phenomena are macroscopic outcomes that are observed, but would not be expected based on the rules of interaction. In other words, emergent phenomena are complex behaviors that come from simple rules. The ability to produce such complex behavior from such simple rules is one of the major strengths of ABM as a method, as it allows the modeler to observe the evolution of complexity, while only requiring simple rules to be defined.
Even though the outcomes of the “game of life” model have little real world application, the model demonstrates an important mathematical concept. An application of this concept was shown soon after with a slightly more elaborate model proposed by Thomas Schelling [46, 47]. Schelling was trying to understand how racial segregation of neighborhoods occurred, despite the fact that there was no longer any top-down legal enforcement of segregation. He proposed another simple model, an extension of the the cellular automata model, in which self-contained, autonomous agents were able to move from one cell to another in order to meet their preference for having similar neighbors. Agents were divided into two colors, randomly distributed throughout the grid (Figure 3.5), and again the agents had three rules to govern their behavior:
1. Each agent calculates the number of neighbors that have the same color.
2. If the number of neighbors with the same color is greater than their preference for similarity, then the agent stays in their cell.
3. If the number of neighbors with the same color is less than their preference for similarity, then they move to a cell in which their preference is satisfied.
Not surprisingly, Schelling found that when agents had a high preference for similarity among their neighbors, they became completely segregated from each other (Figure 3.6). What was surprising was that even with a relatively low preference for neighbor similarity (say, 33%) the agents would still self-segregate into distinct neighborhoods, even if the
nomena was more localized. This again shows emergence, as the outcome is not necessarily implied by the rules, nor is it consistent with the objective of the individual. This model also furthers the earlier work in cellular automata as the model provides some insight into the real-world phenomena of spontaneous segregation into groups based on sameness [48].
Figure 3.6: Schelling segregation: 75% preference for similarity
3.2 Model Architecture
Further advancement of the method of ABM was made as computational architecture improvements were developed and incorporated. For instance, the addition of discrete event simulation to ABM provided the framework for coordinating interactions, while object ori-ented programming allowed for the organization of agents into classes based on their behavior [49]. These advances in computer science made it possible to develop some of the features
that will be described below, including the ability of agents to learn, and the prospect of ABM’s with multiple types of agents. In addition to these computing features, several soft-ware packages have been developed for the specific purpose of agent based modeling. Some of these suites include Swarm, Mason, Repast, and Netlogo. Mason, Swarm and Repast all utilize some form of the Java programming language, but Netlogo has devel-oped its own internal language. Netlogo was chosen for this work for its ease of use and extensive documentation.
3.3 Model Characteristics
While there is a wide range of applications for ABM, there are several characteristics that all have in common, which constitute the core of what ABM is. There are several good references for newcomers to ABM, which lay out modeling techniques, characteristics of ABM, definitions and terminology. Macal and North have produced a guide specifically aimed at corporate managers who hope to use ABM to optimize their production streams and better understand their markets [50]. A discussion of the historical evolution of agents in computational economics is given by Chen [51]. Railsback and Grimm have a textbook to be used by teachers in ABM classes [49]. Introductory works on ABM for more general audiences was written by Gilbert and Axelrod and Tesfatsion have a guide for those approaching ABM from social science perspective. [43, 52]. All of these references have outlined the general concepts and characteristics of ABM. For convenience, a few will be discussed here.
3.3.1 Agents
All agent-based models have at least some form of agent. The definition of agents can be somewhat ambiguous, as there is no universally accepted definition in the literature, beyond the property of autonomy. Macal and North provide a helpful list that covers most of the important features of agents, as well as some that are possible, but not necessary [53]:
• Agents must be self-contained. This means that every agent is a distinct individual that has boundaries and is uniquely identifiable as a discrete entity.
• Agents must be autonomous. It must be able to interact with other agents and the environment in a way that is completely self-directed. This requires the writing of rules that allow agents to sense their surroundings and make decisions.
• Agents have variables that define their state at any given time. The variability in states from one agent to another allow for heterogeneity, and are required for agents to make decisions as they interact.
• Agents must be social, meaning that they must interact influence/be influenced by other agents. This happens as interactions force the change of agents’ state variables. Part of the agents ability to sense means that they have to be able to recognize the state traits of other agents, at least on a local level.
In addition to these requirements, Macal and North describe the following optional fea-tures:
• Agents may learn and adapt. This happens by having internal rules that allow for a different set decisions to be made for a different variable state. As agents interact and change state, they can also change the rules that will define their next interaction. • Agents may be goal directed. For example, agents may try to optimize their their
search for potential interaction partners. This is another form of learning that allows agents to assess the extent to which their behavior is helping to achieve their goals. • Agents may be heterogeneous. This means that not only can agents have multiple
3.3.2 Rules
Agents, acting as autonomous individuals, need to have some kind of directive to per-form in order to fulfill the requirement to interact and change their state. These rules can be extremely simple, as in the examples of Conway and Schelling given above, or can be themselves more complex. For example, it is possible to not only have rules for the behavior of the agents, but also to have rules about rules, or procedures that determine what set of rules gets followed by an agent at a given time or in a given situation. There are also rules about the thresholds that may prompt a change in the state variables of agents [54]. In chapter 4, rules are described for the interaction of agents of the same type and a different set of rules is given for the interaction of different types of agents.
In addition to rules that govern different types of interactions for different types of agent or situation, there can also be rules for how an agent learns from its experience. Genetic algorithms and neural networks are two popular methods of machine learning, as is fuzzy logic [55–57]. These schemes allow agents to change their internal rules to respond to new types of stimuli and adapt as stimuli become familiar and allow for an even greater level of complexity to be explored.
3.3.3 Environment
One of the major caveats for interaction is that agents only be able to sense local agent and environment information. This is to ensure that the model does not become over-constrained in a way that produces deterministic behavior. What constitutes proximity is a question of the agent’s envrionment. The locality of the information doesn’t necessarily need to be a physical proximity, as agents connected by a network link can be considered “neighbors” even if they occupy opposing sides of an interaction grid. An important consideration in designing an agent-based model is the “topology,” or how locality is defined. In the cellular automata example of Conway, a “Von Neumann” topology is applied, in which agents are actually the cells themselves, and have a fixed set of eight bordering cells that constitute a neighborhood.
In the Schelling example, agents are able to move around in a two-dimensional space known as a “Euclidean” topology. Network models have their own topology, in which proximity is defined by the network distance or geodesic path length (described in chapter 5) of two agents. Other topologies include Geographic Information Systems (GIS), in which actual geographic information is overlaid on the interaction space and agent movement is restricted by physical geographic features, and aspatial or “soup” topology, in which proximity is randomly assigned as two agents are randomly pulled out of a “soup” of agents for an interaction, and then put back to be randomly drawn again.
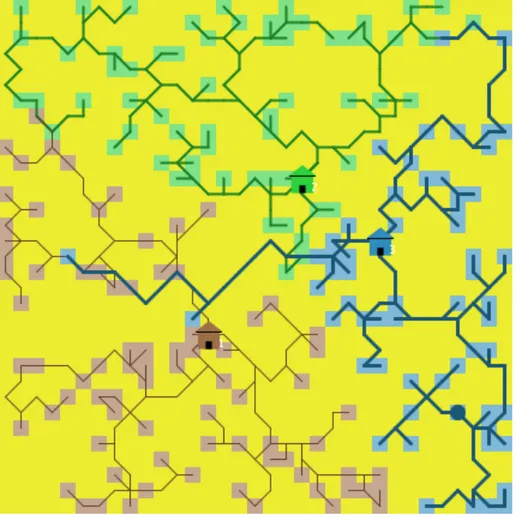
Topology is not the only defining characteristic of the model environment. The cells themselves can be considered a stationary type of agent with their own state that elicits a response from agents that move to them. For instance, in another model created by the author, patches or cells represented the spatial location of different energy sources. Specific patches had a specific kind (wind, solar, fossil) and amount (2MW, etc) of energy production potential. As agents moved around the interaction space, their goal was to prospect for energy, and build the most efficient transmission line to transport power back to their patches of origin. Not only did patches have energy potential, but also a “rent” associated with building a transmission line on them, and agents built the most efficient lines by building the shortest path while also minimizing rent. Figure 3.8 shows the interaction environment of this model, in which agents interact with the environment itself, rather than other agents.
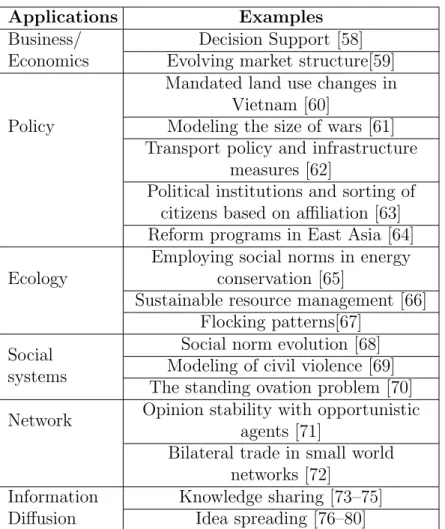
3.4 Applications
Table 3.1: ABM Applications
Applications Examples
Business/ Economics
Decision Support [58] Evolving market structure[59]
Policy
Mandated land use changes in Vietnam [60]
Modeling the size of wars [61] Transport policy and infrastructure
measures [62]
Political institutions and sorting of citizens based on affiliation [63] Reform programs in East Asia [64] Ecology
Employing social norms in energy conservation [65]
Sustainable resource management [66] Flocking patterns[67]
Social systems
Social norm evolution [68] Modeling of civil violence [69] The standing ovation problem [70] Network Opinion stability with opportunistic
agents [71]
Bilateral trade in small world networks [72]
Information Diffusion
Knowledge sharing [73–75] Idea spreading [76–80]
3.5 ABM of Information Diffusion
There is one specific application that deserves special attention in the context of this work, and that is the application of diffusion of information in agent-based systems. The literature listed above in the “information diffusion” category constitutes a specific kind of ABM with the specific goal of studying how various types of information, innovation, stereotyping, emotion, and ideas are spread through a group of individual agents. This work forms the basis for the primary model presented in the next chapter. It includes rules that other authors have used to govern interactions in these types of systems, and these rules were carefully considered in the process of choosing rules for the models represented in this work. Information diffusion is a concept that has received much attention from the agent-based community, and it continues to be explored and expanded upon by current works which include this dissertation.
CHAPTER 4
AGENT-BASED MODEL OF OPINION DIFFUSION
The first step in creating an agent-based model is to identify the behavior of interest and to define the identity and features of the stakeholders to be modeled as agents. Once those elements are defined, a simple model can be created to which complexity can be added a step at a time until the system of interest is satisfactorily represented.
In this work, the problem that the primary model (described below) set out to solve is as follows: a mining company wants to gain social license to use some land for waste storage with the possibility of recovering ore from the waste in the future. The company purchased the land and has the approval of the community to store waste there. There are, however, several individuals in the community who have traditionally used this land for grazing, and feel that they should be further compensated for the use of the land. The company wants to gain social license with dissenters and solidify the license that it already has with other community members before they begin to use the land. This is done by building consensus through diffusion of opinion among the community.
In the most simplistic case, the focal organization needs to know how many of their CSR employees are needed in the community in order to reach a favorable consensus in a given time frame, or how long it would take to reach consensus with a given number of people as representatives. A more complex case involves how the company—as a single stakeholder within a large and complex web of relationships and interests—affects and is affected by the
rules that define the system of interest, and explore the changes that have been made to the model as the definitions and questions were refined over the course of this research.
4.1 Primary Opinion Diffusion Model 4.1.1 Agents, Variables, and Environment
The primary version of the model started out with two classes of agent: community members and employees in the CSR department of the mine. The community agents have internal state variables that determine their overall acceptance of the mine project and status within the community. Definitions of these variables are as follows:
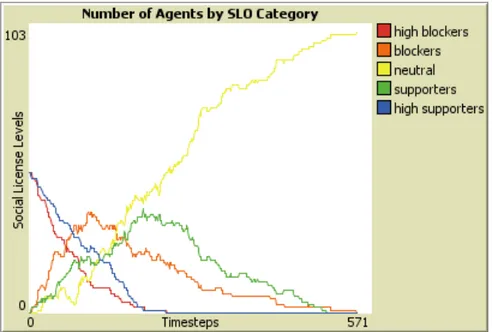
License This attribute is variable in time, and is one of the main points of interest for the model. The “license” variable is used as a measure of individual judgement on the company’s Social License to Operate. Each agent is placed into one of 5 license categories: high blocker, blocker, neutral, supporter, and high supporter, with the former categories having the least approval for the mining project and the latter having the most. For the purposes of modeling, each category is given a numerical integer value ranging from -2 (high blocker) to +2 (high supporter). The license of a community agent is a “dummy” variable that is tied to the opinion variable for that agent
Opinion Opinion is the information that each agent uses to form their license. It is trans-ferred between agents according to the interaction rules, which differ depending on what kind of agents are interacting (see below). As agents accumulate a predefined amount of opinion their license variable changes to reflect their new opinion. Opinion can be both positive and negative with regard to the mine. As agents accumulate negative opinion, their license to the mine goes down, and as they accumulate positive opinion, their license to the mine goes up. Table 4.1 shows the how the license categories relate to the amount of opinion a community agent has.
Influence Influence is a measure of the weight given to an individual’s opinion. In the early iteration of the model, influence varied from agent to agent, but did not vary in time. In later versions, the network position of each agent was used to deter-mine that agent’s influence dynamically as the model progressed. Influence, like license, has been discretized into five categories: Dominant, Strong, Influential, Vulnerable, and Marginal. These influence categories are also given numerical values from -2 (marginal) to +2 (dominant) for the purposes of modeling (Ta-ble 4.2). Influence is the driving force behind the transfer of opinion between community agents.
Table 4.1: Opinion levels and license categories. Opinion Level License Category
0-10 -2 (HB)
11-20 -1 (B)
21-30 0 (N)
31-40 1 (S)
41-50 2 (HS)
Table 4.2: Numerical and qualitative influence levels. Numerical Influence Value Influence Category
2 Dominant
1 Strong
0 Neutral
number of these agents is variable from 0 to 8, reflecting the CSR resources of the mine. Using social judgment theory as a basis, the degree to which individual community agents absorb the messages (opinion) provided by the CSR agents is a function of the degree to which those individuals already agree with the message.
Figure 4.1 shows a two-dimensional Euclidean topology in which these agents can in-teract, including CSR agents (stars) and Community agents (arrowheads). The black box in which the agents are located represents the grid environment in which agents may move and meet each other. Agents are initially placed randomly in the space and move around this area randomly. When an agent comes into a specified proximity with another agent, the interaction rules dictate what the agents will do next. The space has periodic boundary conditions, which means that if an agent leaves the space through one side of the box, they will enter through the opposite side. This condition confines the space allowed for interaction without imposing the superficial constraints of a physical boundary.
Figure 4.1: A simple agent-based environment
4.1.2 Interactions
There are two kinds of interaction rules in the model. The first deals with CSR-community interactions. When a CSR agent moves into the space that is already occupied
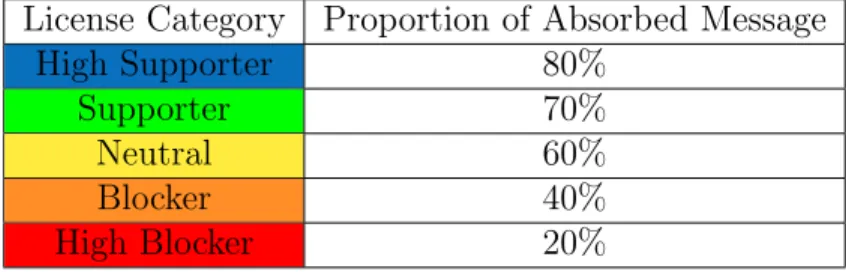
by a community agent, the CSR agent “dispenses” or makes available 10 points of opinion. This is because 10 opinion points is the minimum requirement for changing an agent’s license by one category (Table 4.1). The community agent then decides how much of that opinion they will accept, based on their own current license level. Table 4.3 shows the proportion of the 10 point opinion message that a community agent will accept based on the license category they fall into. The proportions in the right-hand column come from the experience of a CSR team at a working mine, and will vary from culture to culture, location to location, and mine project to mine project. The colors in Table 4.3 are used to show the license level of agents shown in Figure 4.1. Care should be exercised in determining these percentages for different stakeholder groups involved with different projects in different areas of the world, as the local contextual percentages may vary depending on local social and cultural values.
Table 4.3: Absorption of CSR messages by license category License Category Proportion of Absorbed Message
High Supporter 80%
Supporter 70%
Neutral 60%
Blocker 40%
High Blocker 20%
An example of what this table shows is that a “neutral” community agent (upon meeting with a CSR agent) will accept 60% of the 10 point opinion being offered, and their own opinion variable will increase by 6 points. If 6 opinion points added to their previous opinion level is enough to move them to a different license category (Table 4.1), then their license variable will also change to reflect their new opinion.
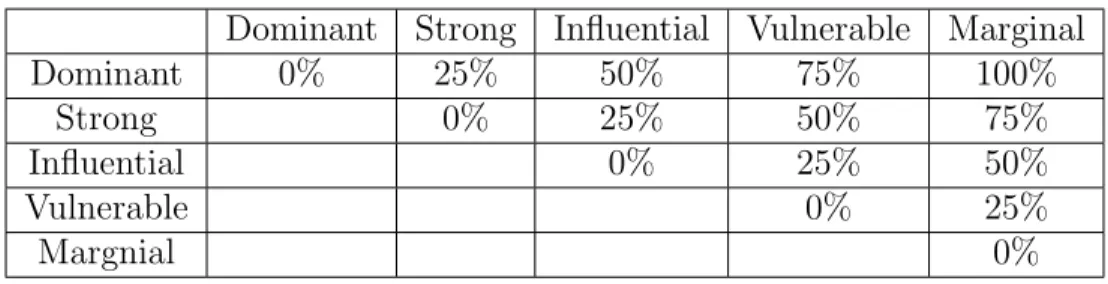
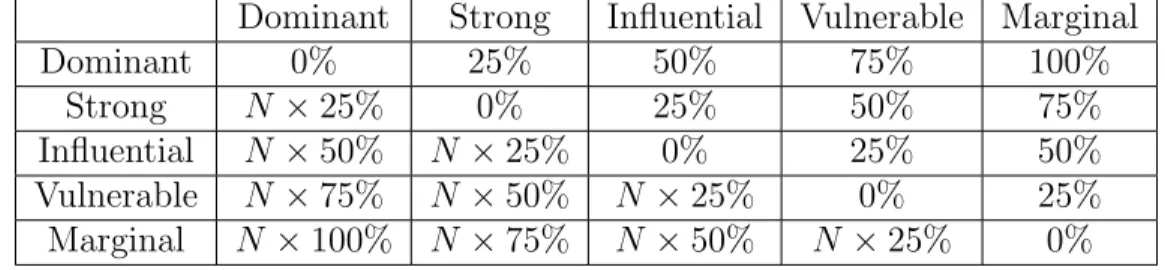
(positive or negative) is determined by the differences in license. The proportions of accepted opinion between agents of any two license levels are shown in Table 4.4. Just like Table 4.3, these proportions were determined through the experience of a CSR team, and are subject to the same constraints on applicability.
Table 4.4: Community-community interaction proportions Dominant Strong Influential Vulnerable Marginal
Dominant 0% 25% 50% 75% 100%
Strong 0% 25% 50% 75%
Influential 0% 25% 50%
Vulnerable 0% 25%
Margnial 0%
This type of interaction is best understood through an example. Consider two community agents—agent i and agent j—that have the variable profiles shown in Figure 4.2.
Agent: i Agent: j
Influence: 2 (Dominant) Influence: 1 (Strong)
License: -2 (High Blocker) License: 2 (High Supporter) Figure 4.2: Community-community two agent interaction
When agent i and agent j meet, they will exchange opinion according to the following equation: F or Ii > Ij ( ∆xj = 0.25 |Ii− Ij| sgn (Li− Lj) X ∆xi = 0 (4.1) where ∆xi is the change in opinion of agent i over a given timestep, t is the timestep, Ii is the
numerical influence value for agent i, Li is the numerical license value for agent i at a given
timestep, and X is the amount of opinion available for transfer during that interaction (in this case, 10 points). What this equation means is that the magnitude of the change in opinion of agent j over a given timestep is equal to 25% of the total difference in influence of the two agents, multiplied by the amount of available opinion for that step. The directionality of the opinion is determined by the sign of the difference in license level of the two agents. So,
when agent i and agent j meet, agent i will make 10 opinion points (X) available to agent j, and agent j will accept 25% of the difference in influence levels (0.25 × 10 × (2 − 1) = 2.5). The sign of the difference in license is negative (−2 − 2 = −4), which means that overall, agent j will adjust its internal opinion variable by -2.5 points. If -2.5 opinion points added to agent j’s previous opinion level is enough to move agent j to a different license category (Table 4.1), then j’s license variable will also change to reflect the new opinion. Note that in this early iteration of the model opinion only flowed one direction; agent j absorbed some of agent i’s opinion, but agent i absorbed none of agent j’s (∆xi = 0). This will be addressed
later in this chapter with the addition of a reciprocity variable. 4.1.3 Output
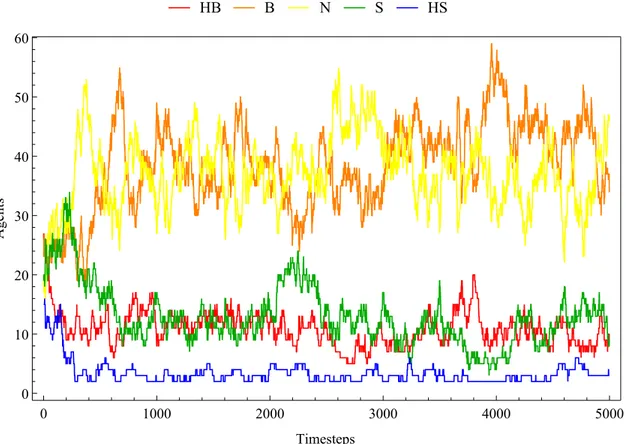
One of the outputs of the primary model is a graph that shows the total number agents with each license level. By running different cases (different numbers of MSC agents), it is possible to get an idea of the relative number of time-steps it takes for the community to reach a consensus. The output of one run is shown in Figure 4.3.
0 5 10 15 0 2 4 6 8 10 12 Timesteps x1000 Agents HB B N S HS
There is a transition time associated with the number of timesteps it takes for most people to go from high blocker to high supporter (the portion of the graph between the black lines). With one CSR agent, the transition time is about 6000 timesteps. Figure 4.4 shows the same output, but with a much shorter transition time (aproximately 1000 timesteps). This corresponds with having a higher number of CSR agents in the interaction space, which significantly drives down the transition time.
0 500 1000 1500 2000 0 2 4 6 8 10 12 Timesteps Agents HB B N S HS
Figure 4.4: Model output, 8 CSR agent initial condition.
4.1.4 Initial Case Studies
In order to understand the emergent behavior and as a means verifying the internal consistency of the model, several “what-if?” scenarios were run by changing specific variables and analyzing the results. In the first case, the number of CSR agents was varied from one to eight to determine the marginal benefit of adding more agents. The results were expected to show diminishing returns, consistent with the real-world allocation of the type of resource that the CSR agents represent.
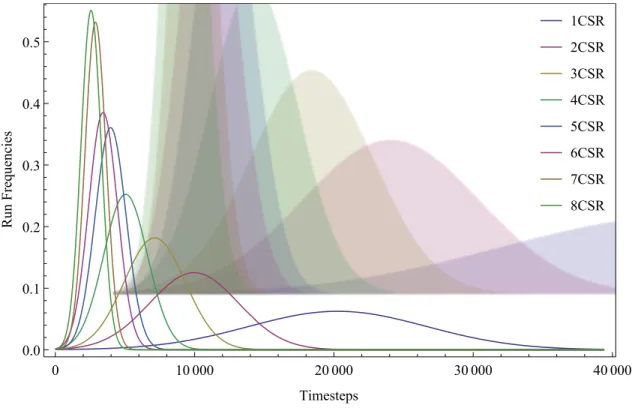
A thousand runs were made for each case (1-8 MSC agents) in order to statistically verify the results. Because the model was run a thousand times for each case, the number of timesteps that it would take to reach consensus was expected exhibit a normal distribution. The results are shown in Figure 4.5 below.
1CSR 2CSR 3CSR 4CSR 5CSR 6CSR 7CSR 8CSR 0 10 000 20 000 30 000 40 000 0.0 0.1 0.2 0.3 0.4 0.5 Timesteps Run Frequencies
Figure 4.5: Comparative histogram results.
In Figure 4.5, the bins represent the number of timesteps it took for each run to reach consensus. The frequency is the number of times that the runs reached consensus in a given bin value. One of the interesting features of these histograms is that each run shows the expected normal behavior. What vary between cases is the average time it takes to reach consensus and the scale of standard deviations. With one CSR agent, the average time to consensus was 20,271 time-steps. Two CSR agents bring the average time down to 9,965 time-steps; a 50.8% savings in time. The time is further reduced by adding a third and fourth CSR agent, but after the fourth CSR agent, the benefit becomes much smaller, dropping to a 3% marginal savings in time. In other words, adding a fifth, sixth, seventh and eighth
The second scenario that was run was a variation on the initial condition comparison mentioned above. Three sets of initial conditions were run. The first was based on data from a real project wherein most of the community members start out as high blockers (case 4.1.1). In the second scenario, all of the community members were initially high blockers (case 4.1.2). In the third, all of the community members start out neutral (case 4.1.3). The result shows a decaying trend, which would be expected based on the analysis of the comparative histograms of Figure 4.5. Figure 4.6 shows the resulting curves for the initial conditions test. ● ● ● ● ● ● ● ● ■ ■ ■ ■ ■ ■ ■ ■ ◆ ◆ ◆ ◆ ◆ ◆ ◆ ◆ ● Case4.1.1 ■ Case 4.1.2 ◆ Case 4.1.3 1 2 3 4 5 6 7 8 0 5000 10 000 15 000 20 000 CSR Agents Average Timesteps to Consensus
Figure 4.6: Initial conditions comparison: diminishing returns.
The decreasing marginal benefit can be seen quite clearly in Figure 4.6. In each case, the benefit of adding more than four CSR agents is significantly smaller than that gained by adding the first three. This information is useful since each CSR agent represents a cost to the mine that could be used elsewhere. The diminishing returns shown by these figures also provide some validation of the model, since they clearly show the model producing results
that are consistent with expected, real-world behavior. 4.2 Model Enhancements
The model presented in the above section serves as a primary basis from which to build more complexity into the model. In order to build on this basis, it is important to identify any potential deficiencies of the original model so that the model can be continuously improved. The first (and most simple) of the improvements to be made is the exclusion of CSR agents from the model. Since these agents were “proto-agents” that did not have internal variables or change their state, it was impossible for the community to change the opinion of the CSR agent. This represents a situation in which a mine is trying to dictate terms to a community, instead of being one of the many stakeholders in a community’s development. In order to give the mine itself the ability to change and adapt based on the social license level of the community, the CSR-agents that represented the mine were replaced by a single community agent with a high license level (the mine should endorse what it is doing) and a high degree of influence (based on the resources and interest that it brings to the community). This means that in future iterations of the model, the mine becomes just one (albeit very powerful) member of a larger community that can change its behavior based on the overall license of the larger stakeholder group (see chapter 2).
4.2.1 The Problem of Consensus
One of the main improvements to be made in the preliminary model deals with the problem of consensus. Because of the way that the first model was set up, two issues are immediately apparent: (1) the community always comes to consensus, and (2) the consensus
![Figure 2.2: Social license levels and boundary criteria [20].](https://thumb-eu.123doks.com/thumbv2/5dokorg/4338115.98566/30.918.279.634.220.612/figure-social-license-levels-boundary-criteria.webp)
![Figure 2.3: Social license durability as a function of network structure type [27]](https://thumb-eu.123doks.com/thumbv2/5dokorg/4338115.98566/31.918.146.760.508.1006/figure-social-license-durability-function-network-structure-type.webp)