Based on Renewable Energy Sources in Spain,
Portugal, Germany, and United Kingdom
Annex to Report of the Grid Connection Inquiry
Stockholm 2008
Regeringskansliets förvaltningsavdelning. Beställningsadress: Fritzes kundtjänst 106 47 Stockholm Orderfax: 08-690 91 91 Ordertel: 08-690 91 90 E-post: order.fritzes@nj.se Internet: www.fritzes.se
Svara på remiss. Hur och varför. Statsrådsberedningen, 2003.
– En liten broschyr som underlättar arbetet för den som skall svara på remiss. Broschyren är gratis och kan laddas ner eller beställas på
http://www.regeringen.se/remiss
Textbearbetning och layout har utförts av Regeringskansliet, FA/kommittéservice Tryckt av Edita Sverige AB
This report is an underlying report to the Inquiry established by the Swedish Government on connection to the grid of electricity production based on renewable energy sources. The aim of this report is to give an insight on how different issues regarding connec-tion to the grid have been regulated in Spain, Portugal, Germany, and the United Kingdom.
This report is based on interviews and legislation. The focus of this report relies on network issues but in order to give an overall insight on the circumstances in which renewable energies are deve-loped in the studied countries even a description of the economical promotion schemes is done.
We would like to thank all those who have contributed to this report:
• In Spain: Asociación Empresarial Eólica – AEE, Comisión Nacional de la energía – CNE, Ministerio de Industria, Turismo y Comercio – MITYC, Instituto para la Diversificación y Ahorro de la Energía – IDAE, Endesa, Iberdrola, and REE – Red Electrica de España.
• In Portugal: REN – Rede Eléctrica Nacional, EDP – Energías de Portugal, APREN – Associação de energias renováveis, DGEG – Direcção Geral de Energia e Geologia, and Centro de Estudos em Economia da Energia, dos Transportes e do Ambiente – CEEETA.
• In Germany: German Federal Ministry for the Environment (BMU), Federal Ministry of Economics and Technology (BMWi), Federal Network Agency (Bundesnetzagentur), German Wind Energy Association (BWE), RWE Transportnetz Strom GmbH, German Network Association (VDN), Enercon.
• In the United Kingdom: Ofgem, Department of Trade and Industry (DTI), National Grid, Xero Energy, Garrad Hassan, British Wind Energy Association (BWEA), University of Strathclyde.
Stockholm, November 2007
List of Abbreviations ... 11
List of Figures ... 13
List of Tables ... 17
1 Spain ... 21
1.1 Introduction ... 21
1.1.1 Overview of the Transmission System... 23
1.1.2 Overview of the Distribution System ... 24
1.1.3 Relevant Legislation for Renewable Electricity Production ... 24
1.1.4 Regulatory Framework for Network Companies ... 26
1.1.5 Development of the Wind Power Sector in Spain... 27
1.1.6 Possible Barriers for the Future Development of the Wind Power Sector in Spain ... 32
1.2 Payment Scheme for Renewable Electricity Production... 32
1.2.1 Development of payment schemes... 42
1.2.2 Agents Opinions on different Payment Schemes for Renewable Electricity Production... 42
1.3 Application Procedure for Access and Connection to the Grid ... 43
1.3.1 Definition of the Capacity of a Production Installation ... 46
1.3.2 Permitting Entities ... 47
1.4 Obligations of Grid Companies regarding Grid Access ... 49
1.4.2 Priority Access for Renewable Electricity
Producers...51
1.4.3 Reservation of Transmission Capacity ...52
1.5 Costs Associated to the Connection to the Grid ...52
1.5.1 Costs for the Connection Installations...53
1.5.2 Costs for Reinforcement of the Transmission Grid ...55
1.5.3 Costs for Reinforcement of the Distribution Grid ...56
1.6 Costs and Obligations related to measurement ...57
1.6.1 Net-metering...57
1.6.2 Hourly measurement ...58
1.6.3 Measurement costs...59
1.7 Grid tariffs ...60
1.8 Rights and Obligations regarding Real-Time Operation ...60
1.9 Conclusions Spain ...62
2 Portugal... 67
2.1 Introduction ...67
2.1.1 Overview of the Transmission System ...68
2.1.2 Overview of the Distribution System ...69
2.1.3 Relevant Legislation for Renewable Electricity Production...70
2.1.4 Regulatory Framework for Network Companies ...70
2.1.5 Development of the Wind Power Sector in Portugal ...71
2.1.6 Possible Barriers for the Future Development of the Wind Power Sector in Portugal ...74
2.2 Payment Scheme for Renewable Electricity Production ...74
2.2.1 Wind Power...76
2.2.2 Solar Power...78
2.2.3 Biomass...79
2.2.4 Hydropower ...80
2.3 Application Procedure for Access and Connection to the Grid and Evaluation on Environmental Impact...81
2.4 Obligations of Grid companies regarding Grid Access ... 85
2.4.1 Available Capacity ... 85
2.4.2 Priority Access for Renewable Electricity Producers ... 87
2.4.3 Reservation of Transmission Capacity... 88
2.5 Costs associated to the Connection to the Grid ... 89
2.5.1 Costs for the Connection Installations ... 89
2.5.2 Costs for Reinforcement of the Transmission Grid... 90
2.5.3 Costs for Reinforcement of the Distribution Grid... 92
2.6 Costs and Obligations Related to Measurement ... 92
2.7 Grid tariffs... 92
2.8 Rights and Obligations regarding Real-Time Operation ... 92
2.9 Conclusions Portugal ... 93
3 Germany ... 97
3.1 Introduction ... 97
3.1.1 Overview of the Transmission System... 100
3.1.2 Overview of the Distribution Systems... 101
3.1.3 Relevant Legislations for Renewable Energy... 102
3.1.4 Regulatory Framework for Network Companies .... 106
3.1.5 Development of the Wind Power Sector in Germany... 107
3.1.6 Future Plans and Possible Barriers for the Further Development of Wind Power ... 110
3.2 Payment Scheme for Renewable Energy Sources ... 113
3.3 Application Procedure for Access and Connection to the Grid ... 119
3.3.1 Definition of the Capacity of a Production Installation ... 124
3.3.2 Permitting Entities ... 125
3.4 Obligations of a Grid Company Regarding Grid Access.... 125
3.4.1 Available Capacity ... 126
3.5 Costs Associated with the Connection to the Grid ...127
3.6 Costs and Obligations Related to Measurement ...128
3.7 Grid Tariffs ...129
3.8 Rights and Obligations Regarding Real Time Operation....129
3.9 Conclusions Germany ...130
4 United Kingdom ... 133
4.1 Introduction ...133
4.1.1 Overview of the Transmission System ...138
4.1.2 Overview of the Distribution Systems ...141
4.1.3 Relevant Legislations ...143
4.1.4 Regulatory Framework for Network Companies ....149
4.1.5 Development of the Wind Power Sector in the UK...151
4.1.6 Future Plans and Possible Barriers for the Further Development of Wind Power...153
4.1.7 Payment Scheme for Renewable Energy Sources ...155
4.2 Application Procedure for Access and Connection to the Grid...167
4.2.1 Definition of the Capacity of a Production Installation...172
4.2.2 Permitting Entities...172
4.3 Obligations of a Grid Company Regarding Grid Access ....174
4.4 Grid Access, Available Capacity and Queue Management ...175
4.5 Reservation of Transmission Capacity ...180
4.6 Costs Associated with the Connection to the Grid ...181
4.7 Costs and Obligations Related to Measurement ...183
4.8 Grid Tariffs ...183
4.9 Rights and Obligations Regarding Real Time Operation....188
5 Summary of Findings... 193
5.1 General Renewable Energy Promotion Scheme ... 193
5.2 Network Connection Procedure ... 197
5.3 Network Investment Costs... 200
5.4 Capacity Limits in the Regulations for Renewable Energy... 203
5.5 Network Concessions ... 205
5.6 Metering ... 208
5.7 Network Tariff Structure ... 209
5.8 Priority Production and Curtailment Policy ... 211
5.9 Current Policy Challenges Related to Network Issues ... 213
BEGA Bilateral Embedded Generation Agreement
BELLA Bilateral Embedded License Exemptable Large
Power Station Agreement
BETTA British Electricity Trading and Transmission
Arrangement
BSUoS Balancing Services Use of System charges
CNE Comisión Nacional de la Energía, (Regulator Spain)
CUSC Connection and Use of System Code
CHP Combined Heat and Power
DCLF DC Loadflow
DGGE Ministry of Economy and Innovation through its
Directorate of Energy
LECs Levy Exemption Certificates
DGE Dirección General de Energía
DL Decree Law (Portugal)
DNC Declared Net Capacity
DNO Distribution Network Operators
HEDP Energias de Portugal
GB Great Britain
IDNO Independent Distribution Network Operator
NETA New Electricity Trading Arrangement
NFFO Non-Fossil Fuel Obligation
NFPA Non-Fossil Purchasing Agency
Ofgem The Office of Gas and Electricity Markets
OFTO Offshore Transmission Owner
PFER Plan de Fomento de las Energías Renovables
RECs Regional Electricity Companies
REE Red Eléctrica de España
REN Rede Eléctrica (Portugal)
RES Act Renewable Energy Source Act
RO Renewable Obligation
ROCs Renewables Obligation Certificates
SRO Scottish Renewable Orders
NGET National Grid Transmission
RD Royal Decree (Spain)
SPTK Scottish Power Transmission Limited
SHETL Scottish Hydro-Electric Transmission Limited
TEC Transmission Entry Capacity
TIRG Transmission Investment for Renewable
Generation
TO Transmission Owner
TSO Transmission System Operator
TNUoS Transmission Network Use of System Charges
Figure 1-1 Breakdown of total installed capacity for power
production ... 21
Figure 1-2 Renewable energy breakdown... 22
Figure 1-3 The Spanish Electricity Transmission Network ... 23
Figure 1-4 Factor for installations using renewable energies .... 26
Figure 1-5 Development of the installed wind power
capacity (MW) in Spain 2000–2006. ... 29
Figure 1-6 Voltage levels at which the wind farms in Spain
are connected by March 2007... 31
Figure 1-7 Two power lines improve the connection to
distribution grid. ... 54
Figure 1-8 Provisional connection of a wind farm... 55
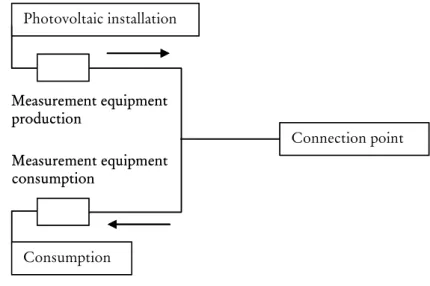
Figure 1-9 Solar photovoltaic generator with measurement
equipment ... 58
Figure 2-1 Breakdown of total installed capacity in Portugal by
the end of year 2006... 67
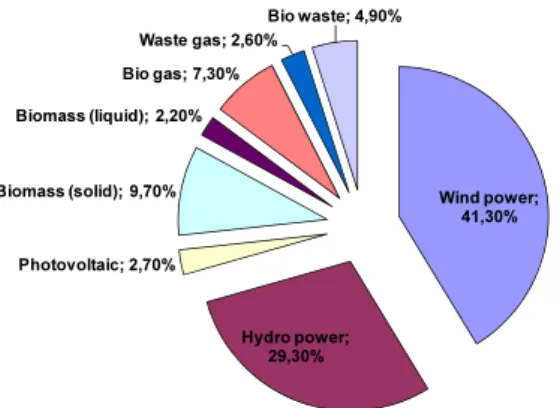
Figure 2-2 Renewable energy breakdown by 31/12/2006 ... 68
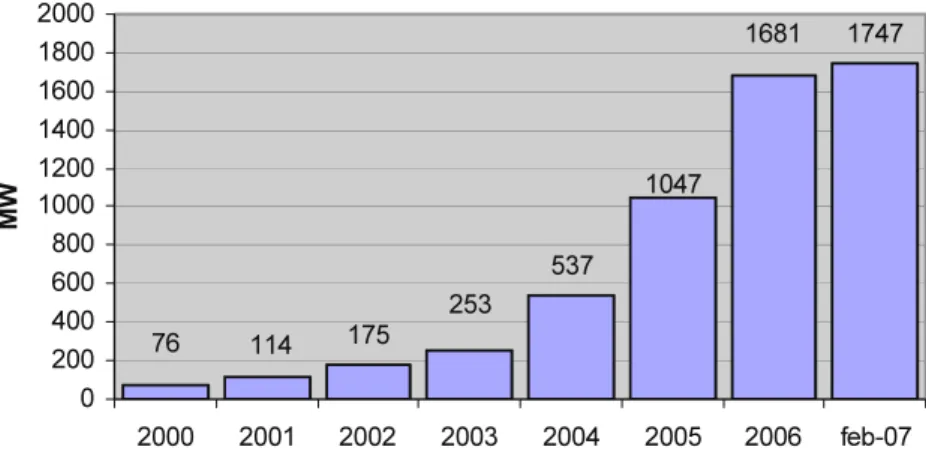
Figure 2-3 Installed wind power capacity in Portugal from
year 2000 to February 2007 ... 71
Figure 2-4 Yearly average feed-in tariff paid to wind power
producer... 76
Figure 2-5 Monthly average payments for wind power
Figure 2-6 Main investment projects in the Portuguese
Transmission grid until 2010 ...91
Figure 3-1 Renewable energy generation by source, 2006 ...98
Figure 3-2 The German High Voltage Transmission
Network and its TSOs. ...100
Figure 3-3 Schematic geographic representation of German
distribution companies...101
Figure 3-4 Regional distribution of wind power in Germany .108
Figure 3-5 Shares of the potential annual energy yield of the net
electrical energy consumption for the Federal States
of Germany ...109
Figure 3-6 Forecast for the development of wind power in
Germany...111
Figure 3-7 Composition of the electricity price in the house-
hold sector, 2005 ...119
Figure 3-8 Potential bottlenecks within E.on Netz transmission
system...122
Figure 4-1 UK Electric Energy Production in 2006...133
Figure 4-2 Electrical Generating Capacity of Renewable Energy
from 1997 to 2006 …. ...134
Figure 4-3 Growth in Electricity Generation from Renewables
since 1990...135
Figure 4-4 The High Voltage Transmission Network in England
& Wales and Scotland...139
Figure 4-5 The High Voltage Transmission Network in
England, Wales and Scotland. ...140
Figure 4-6 Schematic representation of distribution companies
in Great Britain. ...141
Figure 4-7 Year-on year-existing and forecast onshore
wind farms to 2010 ...152
Figure 4-8 Wind Farm Capacities Map ...153
Figure 4-10 Renewable generating capacity from NFFO and former NFFO contracts... 156 Figure 4-11 Breakdown of ROCs issued by technology type in
2006... 165 Figure 4-12 Eligible capacity by technology in kW. ... 166
Figure 4-13 Process for connection to the transmission system in
the UK. ... 168
Figure 4-14 Generation Use of System Tariff Zones as at 1 April
Table 1-1 Payment scheme for renewable electricity
production according to RD 661/2007... 35
Table 1-2 Payment scheme for renewable electricity
production according to RD 436/2004... 38
Table 1-3 Payment scheme for renewable electricity
production according to RD 2818/1998... 41
Table 2-1 Voltage levels at which wind power installations
are connected... 72
Table 2-2 Feed-in tariffs (c€/kWh) paid to wind power
producers ... 78
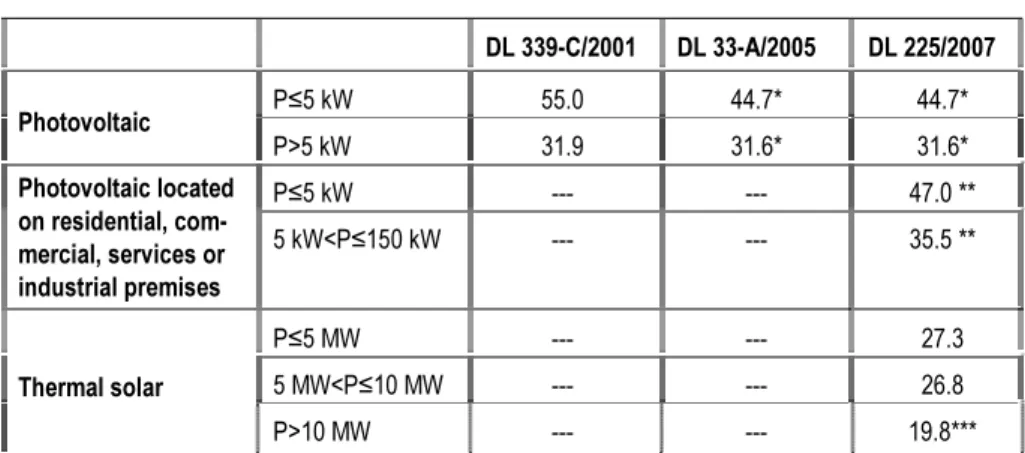
Table 2-3 Feed-in tariffs (c€/kWh) paid to electricity
producers based on solar energy ... 79
Table 2-4 Feed-in tariffs (c€/kWh) paid to electricity
producers using biomass... 80
Table 2-5 Feed-in tariffs (c€/kWh) paid to hydropower
plants... 80
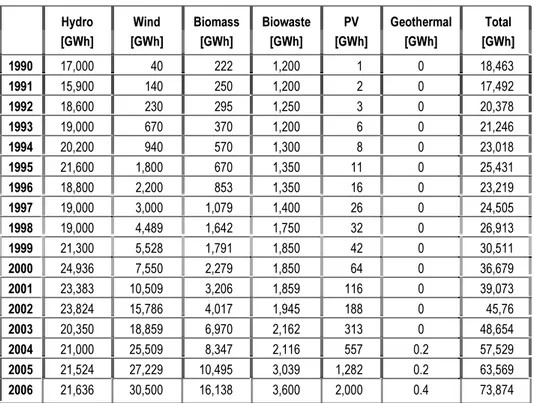
Table 3-1 Development of electricity production from
renewable energy... 97
Table 3-2 Development of installed capacity by source from
1990 to 2006 ... 98
Table 3-3 Development of renewable electricity production
by source from 1990 to 2006... 99
Table 3-4 Feed-in tariffs for Wind Power based on Renewable
Table 3-5 Feed-in tariffs for Photovoltaic based on Renewable Energy Sources Act 2004 ...116
Table 3-6 Feed-in tariffs for Hydro units based on Renewable
Energy Sources Act 2004 ...116
Table 3-7 Feed-in tariffs for Geothermal based on Renewable
Energy Sources Act 2004 ...117
Table 3-8 Feed-in tariffs for Biomass based on RES Act 2004-
Part 1 ...117
Table 3-9 Feed-in tariffs for Biomass based on RES Act 2004-
Part 2 ...118
Table 4-1 Installed capacity of Renewable Energy Sources in
the UK from 1998 to 2006...136
Table 4-2 Electricity generated from Renewable Energy
Sources in the UK from 1998 to 2006...137
Table 4-3 Overview of Non-Fossil Fuel Obligations in England
& Wales and operational capacity 2006 ...157
Table 4-4 Successful NFFO bidding prices in British
pence/kWh. ...158
Table 4-5 Overview of Scottish Renewable Orders (SRO)
and operational capacity 2006...159
Table 4-6 Overview of NFFO Auction Results ...160
Table 4-7 How suppliers complied with their obligations in
England & Wales ...163
Table 4-8 ROC prices from 2002 to 2007 based on eroc
Auctions...164
Table 4-9 Overview of proposed bands. ...167
Table 4-10 Overview of deadlines for distribution
companies ...171
Table 4-11 Fixed Prices for New Bilateral Agreements. ...182
Table 5-1 Comparison of renewable energy regulations and
its impact on wind power and solar photovoltaic
Table 5-2 Comparison of network connection procedures for
producers using renewable energies... 197
Table 5-3 Comparison of network investment costs for producers using renewable energies... 200
Table 5-4 Comparison of capacity limits for producers using renewable energies ... 203
Table 5-5 Overview of policy issues related to the construction/ownership of new power lines... 205
Table 5-6 Comparison of metering requirements. ... 208
Table 5-7 Comparison of network fees... 209
Table 5-8 Comparison of curtailment policy... 211
Table 5-9 Comparison of current policy challenges related to network issues. ... 213
1.1
Introduction
Spain has a total installed capacity in electric power production of
82,336 MWFTPF
1
FPT by the end of 2006. A Breakdown of total installed
capacity by technology by the end of 2006 can be seen in Figure 1-1. Spain has very little interconnection capacity with its neighboring
countries, France, Portugal, Morocco, and Andorra of about 3%TPF
2
FPT
of the installed capacity.
Figure 1-1 Breakdown of total installed capacity for power production by
technology by 31/12/2006. Category “Rest of special regime” in-cludes cogeneration and renewables except hydro and wind.
TP
1
PT
Source: Wind Power 2007, Spanish Wind Power Association, http://www.aeeolica.org/ varios/AEE_Anuario_2007_ING.pdf
The total installed capacity in renewable electricity production excluding large hydropower stations (installed capacity larger than 10 MW) was 13,959 MW by the end of year 2006. Figure 1-2 shows the share of the different renewables technologies to the total in-stalled capacity in renewable electricity production. Wind power is the renewable source that has experienced the largest development in Spain. During the last seven years the installed wind power capacity has grown from 1,585 MW year 1999 to 11,615 MW by the
end of year 2006TPF
3
FPT. Wind power production during year 2006 was
23,372 GWh, i.e., approximately 8.5% of the total electricity de-mand in Spain.
Figure 1-2 Renewable energy breakdown by 31/12/2006
Source: CNE & AEE
Therefore, even though the aim of this chapter is to give an insight on the Spanish renewable sector as a whole, it focuses on the wind power sector. During the last two years it has been an important increase of solar photovoltaic producers and the total installed
capa-TP 2 PT http://www.etso-net.org/NTC_Info/library/e_default.asp TP 3 PT
city of this technology was by the end of year 2006 equal to 118 MWTPF
4
FPT.
Even though the installed capacity of solar photovoltaic installations is not comparable with the installed wind power capacity it might be interesting to get an idea of what is behind the development of solar photovoltaic.
1.1.1 Overview of the Transmission System
The typical voltage levels for the transmission grids in Spain are 400 kV and 220 kV. The international connections are also consi-dered as a part of the transmission system. Red Eléctrica de España, REE, is the Transmission System Operator (TSO) and owns about 99.8% of the 400 kV power lines and 98.5% of the 220 kV power
linesTPF
5
FPT.
Figure 1-3 The Spanish Electricity Transmission Network
Source: REE
TP
4
PT
Source: Trends in photovoltaic applications. Survey report of selected IEA countries be-tween 1992 and 2006 http://www.iea-pvps.org/products/download/rep1_16.pdf, page 5.
TP
5
PT
1.1.2 Overview of the Distribution System
The typical voltage levels for the distribution grids in Spain are 132 kV (very high voltage), 66 kV, 45 kV, 30 kV (high voltage), 20 kV, 15 kV, 13.2 kV, 11 kV (medium voltage) and 380 V (400 V in the latest regu-lation, RD 842/2002, low voltage).
In Spain the main distribution companies are Iberdrola, Endesa, Unión Fenosa, Hidrocantábrico, and Viesgo with a market share of 40%, 39%, 15%, 2.5%, and 2.5% each, which represent 99% of the total distribution activity. During the last years the number of distri-bution companies has increased considerably even if they have a negligible market share.
1.1.3 Relevant Legislation for Renewable Electricity
Production
Electricity producers in Spain are subjected to different legislation depending on the producing technology and energy source used. Producers are classified in two main groups; special regime and ordi-nary regime. Renewable energy sources are included in the special regime while the ordinary regime consists of conventional power plants such as nuclear power stations and is therefore left out of this study.
The special regime has been regulated by different royal decrees named in the following. Royal Decrees in Spain are legal orders proposed by the government, instead of being proposed by the parliament as in the case of laws, and have a lower range than laws. Royal decrees are named with a number followed by the year they are published.
Royal decrees regulating the special regime are Royal Decree (RD) 2366/1994 which was modified by the RD 2818/1998 in order to adapt the legislation to the Law of the electricity sector 54/1997. The RD 2818/1998 was modified by the RD 436/2004 and recently, May 2007, by the RD 661/2007. Aspects related to the connection of the production installations are regulated in the RD 1955/2000 partially modified by the RD 661/2007, by its annex XI regarding connection and by its “disposición final segunda” regarding de-posits for licensing. There is specific legislation, RD 1663/2000, for the connection to the low voltage grid of solar photovoltaic in-stallations with an installed capacity lower than 100 kVA.
There have been some changes in the different royal decrees regarding the groups in which producers in the special regime are divided. The RD 436/2004 established for the first time a division of the solar category into solar photovoltaic and thermal solar and of the wind category into on-shore and off-shore. The RD 661/2007 reduces the number of groups of the special regime from four to three. The three groups are: electricity producers using cogeneration (CHP), renewable energy sources, and waste.
The group with producers using renewable energy sources is
called group b and is divided into 8 subgroupsTPF
6
FPT as follows:
• b.1: solar energy • b.2: wind energy
• b.3: waves, geothermic, tides • b.4: and b.5: hydropower
• b.6, b.7, and b.8: biomass and biogas
Installations with an installed capacity larger than 50 MW are not included in the special regime. However, when these installations use renewable energies, except for hydro power, they receive a pre-mium equal to the prepre-mium obtained by a similar installation with a capacity below 50 MW multiplied with a factor. That factor de-creases linearly with the installed capacity from 0.8 for 50 MW to 0.2 when the installed capacity is larger than 100 MW, see Figure 1-4. Due to this limitation there are no installations using renewable energies with installed capacity larger than 50 MW.
TP
6
PT
For more details on which energy sources that are included in each subgroup see RD 661/2007, article 2.
Figure 1-4 Factor for installations using renewable energies with an installed capacity larger than 50 MW.
0 0,1 0,2 0,3 0,4 0,5 0,6 0,7 0,8 0,9 50 60 70 80 90 100 110 120 MW Fa ct or
Currently, most of the producers included in the special regime are regulated by the RD 436/2004 even though there are still some producers regulated by the RD 2818/1998. There are transitory periods established in every Royal Decree in order to switch to a new regulatory frame established by a new Royal Decree. In some cases it is possible for producers to stay in the former legislation and in others there is no transitory period as for example for solar photovoltaic producers that automatically have switched into the new RD 661/2007 by June, 2007.
1.1.4 Regulatory Framework for Network Companies
The income of the distribution activity is established ex-ante in the
legislation every yearTPF
7
FPT in order to avoid eventual abuse of
monopo-listic positions. The total income for the distribution activity is based on the previous year income modified by the national average de-mand increase, the price index, and a certain efficiency factor. Year 2007 a total income of 4,000 M€ was recognized to the distribution activity. To establish the income of each distribution company certain pre-defined shares are used. These shares do not take into account specific demand increase for each distribution company
TP
7
PT
The income for the different distribution companies for year 2007 was established in the RD 1634/2006 (annex VII).
which means that companies with large demand increase (as for example Iberdrola in the Levante region) get the same incentives to make investment as companies with a stable demand. Not all invest-ment costs are included when calculating the income for each distri-bution company, it is only those investment costs dedicated to the expansion of the grid to cover the natural increase in demand that are included.
A new model for payment of the distribution activity has been defined in a proposal of Royal Decree made by the Ministry of Industry, Tourism and Trade. One of the major changes to be introduced by the new model is that different rates of the demand growth will be used for different regions. According to the current legislation if the demand growth for the whole country was for instance 4%, then that value was applied to all distribution com-panies even if there were areas were the demand growth was higher. Reference grids will be used to compare different distribution com-panies according to the new model which will probably be applied from year 2008.
The costs recognized to the distribution companies are collected by the distribution companies and retailers by means of tariffs and access fees paid by the consumers. Those tariffs and access fees are sent to the regulatory body, Comisión Nacional de la Energía, CNE, who splits them into the different costs associated to the electricity system of which one is the distribution cost. The distribution costs represented year 2005 approximately 74% of the regulated costs. Other regulated costs are for example transmission costs and pe-manent costs defined as costs associated to the market operator (OMEL), the transmission system operator (REE) and the regula-tory body (CNE) among others.
Besides the state regulation there is a different legislation for each region which can establish different requirements for example re-garding quality of supply. This might create economical imbalance since the payment to the distribution companies is determined by the central government and not by the regional authorities.
1.1.5 Development of the Wind Power Sector in Spain
It is important to point out that the development of the wind power sector in Spain has taken place in a very different way than in other countries with large installed wind power capacity such as
Germany and Denmark. In Spain the population density in large areas with good wind resource is much lower than in Germany and Denmark. This has made it possible to build larger wind farms in Spain than in Germany and Denmark. In Germany and Denmark it has been smaller investors who have carried out this development, while in Spain the development has taken place through much larger investors such as electricity and construction companies. In Spain, approximately 60% of the wind power capacity is property of electric power companies. The fact that approximately 40% of the owners are not electrical companies might be a risk since the sector is getting more and more technical with requisites on production manage-ment and forecasting for example, therefore the non-electrical com-panies might sell their installations. Important owners are already (2007) selling their installations and there is taking place a con-centration of the sector.
The regulatory measures behind the great development of the wind
power sector in Spain during the last seven years, see Figure 1-5, areTPF
8
FPT
the payment scheme with feed-in tariffs and the law of the electricity sector 54/1997. The European Commission has published several reports in which it is recognized that the payment scheme of
feed-in tariffs is effective feed-in terms of feed-installed capacityTPF
9
FPT. The Law of the
electricity sector from 1997 established that in order to cover at least 12% of the primary energy demand with renewable energy sources by 2010 (equivalent to 29% of the electricity demand) a plan had to be elaborated. That Plan had to include political objectives for the different renewable energy sources and related techniques. These political objectives had to be taken into account when calculating the feed-in tariff and premium. The objective of 12% of the primary energy demand took into account the proposed recommendation in-cluded in the White Paper on Renewable Energies of the European Union.
TP
8
PT
According to several interviewed agents of wind power sector in Spain.
TP
9
PT
The support of electricity from renewable energy sources, Communication from the European Commission, COM (2005) 627 –final, Section 2.3.
http://ec.europa.eu/energy/res/biomass_action_plan/doc/2005_12_07_comm_biomass_elec tricity_en.pdf
SOU 2008:13 Spain
Figure 1-5 Development of the installed wind power capacity (MW) in Spain 2000–2006.
Source: AEE
The plan for renewable energies, “Plan de Fomento de las Energías
Renovables”TPF
10
FPT (PFER), was published in December 1999 by the
Institute for Energy Diversification and Saving, IDAE. This plan identified a technical potential for wind power in Spain in the range of 7,500–15,000 MW. The plan proposed an increase of 8,140 MW (compare with the capacity installed of 834 MW year 1998) and a wind power production of 19,536 GWh/year to year 2010. The target for the year 2006 was 5,550 MW installed wind power capacity. How-ever, by the end of year 2005 there were 10,028 MW installed wind power capacity, which means double as much as the target of the PFER for 2006.
The PFER was updated with the Plan de Energías Renovables,
PER, approved in the year 2005. The PERTPF
11
FPT
defines the political targets for the period 2005–2011. The political target for wind power established by the PER is 20,155 MW installed capacity by 2010.
During the years 1993–1994 the cost of capital (interest rate) was very high, about 16–17%, some years later this cost decreased and it happened at the same time as a stable regulatory frame was develop-ed which resultdevelop-ed in a great development of the wind power sector. The feed-in tariffs and premiums have been modified every fourth or fifth year. However, there have not been drastic changes since
TP 10 PT www.idae.es TP 11 PT
Plan de Energías Renovables en España 2005-2010, IDAE. http://www.mityc.es/NR/
all political parties have supported the development of renewable energies. The political stability has played a crucial role for the development of the wind power sector in Spain.
In Spain the development of the wind power sector goes in the direction of larger wind farms connected directly to the transmission grid. There are two reasons behind this development. The first reason is the technical development and the second reason is the available capacity in the transmission grid to transport the produced electric power from the connection points. The first wind farms from the year 1997 and 1998 were composed of wind turbines with a capacity of 600 kW connected to the distribution grid. Nowadays, the tur-bines have an installed capacity of around 2 MW which means that it is possible to connect significantly larger capacity in the same location. By connecting larger capacity, more electric power is ex-pected to be produced and therefore a larger income is exex-pected. This means that larger investments to connect the wind farm to the transmission grid can be made. However, since there is a limitation of 50 MW to get the highest payment (see Section 1.1.3), larger installations are divided into several 50 MW installations.
One reason for investing in larger wind farms is to take advantage of scale economies regarding for example the licensing procedure, since the number of licenses required are almost the same indepen-dently of the capacity to be installed.
The first wind farms were located at the mountain peaks but the technical improvements led to an increase of the efficiency of the wind turbines that made it possible to also build wind farms in other locations with less wind resource.
In Spain wind power developers have tried to utilize those loca-tions with best wind resource such as mountain chains in the North, Aragón and basins of the Ebro River concentrating the greatest number of wind farms in those areas.
Year 2001 there were about 3,200 MW installed wind power capa-city and the proportion of wind farms connected to the transmission and the distribution grid was very different compared to the
situa-tion in March 2007. By year 2001, only 10%TPF
12
FPT
of all wind farms were connected to the transmission grid while by March 2007, according to Figure 1-6, 58.68% of all wind farms were connected to the trans-mission grid. Most of the wind farms connected to the distribution grid are connected to the 132 kV level, see Figure 1-6.
TP
12
PT
Figure 1-6 Voltage levels at which the wind farms in Spain are connected by March 2007. 4.005,9 1.088,9 0,0 17,5 2.947,3 322,6 25,5 3.440,8 400 kV 220 kV 132/110 kV 66 kV 45 kV 30 kV 20 kV Desconocido
Potencia eólica puesta en servicio (MW) en el SEPE, según el nivel de tensión (kV) de conexión
6.953,3 4.895,2 58,68% 41,32% MW % RdT RdD Conexión a:
Source: REE, March 2007
The different regions have developed different policies regarding the development of the wind power sector. The region of Galicia has the largest amount of wind power capacity installed followed by Castilla León and Aragón while Andalucía, Cataluña, and Extremadura remain last in this development. There are regions where the environmental issues have stopped the development of the wind power sector like for example Cataluña. There have been different ways of allocating the connection capacity in the different regions to the different project developers such as tender procedure. Most of the regions in Spain compete to develop wind projects be-fore the national target of 20,155 MW installed capacity is reached.
The wind power sector has created approximately 35,000TPF
13
FPT
job opportunities in Spain. The regions have different requisites relating the creation of employment for giving the administrative licenses, i.e. the licenses for constructing, modifying, or closing wind farms. Wind power production gives increased incomes to the municipality where the installations are located since they have to pay a tax on economical activities of about 1% of the income of the installation.
TP
13
PT
This might play a role in increasing the local acceptance of wind power.
1.1.6 Possible Barriers for the Future Development of the
Wind Power Sector in Spain
According to the interviewed agents of the wind power sector in Spain the target of 20,155 MW installed wind power capacity is most likely to be fulfilled. However, it is more uncertain whether this capacity is going to be build by 2010 as stated in the political target in the PER. The reason behind a possible delay is not the lack of investment but the possible lack of transport capacity in the grid to transport the produced electric power. The construction of the required infrastructure takes long time to complete.
The bottleneck in the development of wind power projects have changed according to a project developer in Spain. In the earlier stage, the bottleneck was the administrative licensing issue while nowadays the bottleneck is the connection issue. In the PFER it was already established a target for wind power of approximately 10,000 MW to year 2010. Some of the reinforcement works in the transmission system, necessary to transport the electricity produced by those 10,000 MW, have been delayed. This means that even if there are investors, some projects cannot be materialized as con-sequence of the lack of capacity in the grid.
In the region of Castilla León, for example, there are project developers that have started to build wind farms but these will not be able to start producing electric power until the infrastructure between Castilla León and Madrid has been built.
1.2
Payment Scheme for Renewable Electricity
Production
After the Royal Decree 2818/1998 was approved electricity producers based on renewable energy sources with a capacity below 50 MW have the possibility to choose between two different payment options since. These options are:
• Fixed regulated feed-in tariff
• Market option (combination of the electricity market price together with a fixed premium).
However, solar producers have only the possibility to receive feed-in tariffs. Producers feed-in the special regime can freely choose pay-ment option but the decision taken is for at least one year.
Up to year 2004, the number of wind power producers choosing
the market option was very smallTPF
14
FPT. However, the publication of the
RD 436/2004 including an incentive for the market option and rising electricity prices led to a huge increase of wind power producers choosing the market option. The high electricity prices resulted in much higher payments than expected for the producers who had chosen the market option. This has led to one of the major changes introduced by the new legislation adopted in June 2007, RD 661/2007, namely the establishment of price caps and price floors for the payment to the producers included in the special regime choosing the market option. Those caps and floors secure a mini-mum income necessary to recover investment costs and limit the premium to zero when electricity prices exceed the cap value.
In order to illustrate how the market option is constructed let us look at an example of an on-shore wind power producer choosing the market option. Lets assume a market price of 3 c€/kWh, then the sum of the market price and the premium (see Table 1-1) is 3+2.93=5.93 c€/kWh. Since 5.93 is lower than the price floor for wind power which is 7.13, then the wind power producer receives the floor value. If we now assume a market price of 4.5 c€/kWh, then the wind producer receives the sum of the market price and the premium, i.e. 4.5+2.93=7.43 c€/kWh. If a market price of 6 c€/kWh is assumed, then the wind power producer receives the cap value of 8.49 c€/kWh since the sum of the market price and the premium (6+2.93=8.93) is larger than the price cap. Note that in this case the premiums received by the wind producer decreases. If the market price is larger than the cap value, i.e., 8.49 c€/kWh, then the wind power producer does not receive any premium but only the market price.
The retroactivity of the tariffs and premiums has been a very con-troversial issue. The new Royal Decree 661/2007 defines a transitory period until year 2012 after which installations have to go over to the new payment scheme established in the new legislation.
Electricity production from solar photovoltaic producers is grow-ing rapidly in Spain since year 2005. As mentioned earlier, solar photovoltaic producers have only the possibility to receive feed-in
TP
14
PT
tariff. There are three different feed-in tariffs for solar photovoltaic producers depending on the installed capacity as shown in Table 1-1. Unlike in Germany and Portugal there are no different feed-in tariffs depending on whether the solar panels are located on a build-ing or directly on the ground. The highest tariffs are paid to those installations which has an installed capacity under 100 kW. There-fore larger installations are divided in installations under 100 kW each having its own transformer. This makes the limit of 100 kW meaningless.
There is a direct connection between the political targets for each technology and the payment schemes defined in the new Law, RD 661/2007. This Law establishes that when 85% of the political target is reached, then the Secretary General of Energy will establish a period within which registered installations will have the right to receive the feed-in tariff or premium defined for that technology. The period will be of at least one year. Installations registered after the period defined by the Secretary General of Energy will receive, in case of choosing the feed-in tariff option, the final hourly market
priceTPF
15
FPT or, in case of choosing the market option, the market price
and complements of the corresponding markets where the producer participates. Despite that, these installations will be taken into account when defining the capacity targets for the Renewable Energy Plan for 2011–2020.
In the following, Table 1-1 shows the payment scheme for renewable electricity producers defined by the latest legislation pub-lished on May 2007.
TP
15
PT
In the final hourly market price it is included the market price (pool price) together with the prices of all other markets, intra-daily adjustment markets, balancing markets and capa-city payment. In July 2007 the final hourly price was 4.498 c€/kWh of which 88% was the pool price, 4 % the intra-daily market prices and balancing markets and 8% capacity pay-ment. See http://www.omel.es/es/pdfs/INFORME_MENSUAL_JUL_2007.pdf
Table 1-1 Payment scheme for renewable electricity production according to RD 661/2007. This payment scheme does not apply for in-stallations registered after the period defined by the General Secretary of Energy after 85% of the political target is reached. Political targets are given for each technology in brackets.
Group Subgroup Capacity Period Feed-in
Tariff c€/kWh Premium c€/kWh Cap c€/kWh Floor c€/kWh First 25 years 44.0381 ---- ---- ---- P≤ 100 kW Thereafter 35.2305 ---- ---- ---- First 25 years 41.7500 ---- ---- ---- 100 kW<P≤ 10 MW Thereafter 33.4000 ---- ---- ---- First 25 years 22.9764 ---- ---- ---- Photovoltaic (371 MW) 10<P≤ 50 MW Thereafter 18.3811 ---- ---- ---- First 25 years 26.9375 25.4000 34.3976 25.4038 b.1 Solar (871 MW) Thermal (500 MW) Thereafter 21.5498 20.3200 First 20 years 7.3228 2.9291 8.4944 7.1275 On-shore Thereafter 6.1200 0.0000 ---- ---- b.2 Wind (20155 MW) Off-shore ---- ≤ 8.43 16.40 ---- First 20 years 6.8900 3.8444 ---- ---- b.3 Waves, tides Thereafter 6.5100 3.0600 First 25 years 7.8000 2.5044 8.5200 6.5200 b.4 Hydro power P≤ 10 MW (2400 MW) Thereafter 7.0200 1.3444 First 25 years =6.60+1.2* ((50-P)/40) 2.1044 8.0000 6.1200 b.5 Hydro power10<P≤ 50 MW Thereafter =5.94+1.0 80*((50-P)/40) 1.3444 ---- ---- First 15 years 15.8890 11.5294 16.6300 15.4100 P≤ 2 MW Thereafter 11.7931 0.0000 First 15 years 14.6590 10.0964 15.0900 14.2700 b.6 Biomass b.6.1 energy crops P>2 MW Thereafter 12.3470 0.0000 First 15 years 12.5710 8.2114 13.3100 12.0900 P≤ 2 MW Thereafter 8.4752 0.0000 First 15 years 10.7540 6.1914 11.1900 10.3790 b.6.2 biomass from residues in the agricultural sector and gardening P>2 MW Thereafter 8.0660 0.0000
First 15 years 12.5710 8.2114 13.3100 12.0900 P≤ 2 MW Thereafter 8.4752 0.0000 First 15 years 11.8294 7.2674 12.2600 11.4400 b.6.3 biomass from residues in forestry sites P>2 MW Thereafter 8.0660 0.0000 First 15 years 7.9920 3.7784 8.9600 7.4400 b.7.1 biogas from landfills Thereafter 6.5100 0.0000 First 15 years 13.0690 9.7696 15.3300 12.3500 P≤ 500 kW Thereafter 6.5100 0.0000 First 15 years 9.6800 5.7774 11.0300 9.5500 b.7.2 biogas generated in digesters P>500 kW Thereafter 6.5100 0.0000 First 15 years 5.3600 3.0844 8.3300 5.1000 b.7 Biogas b.7.3 animal dung or liquid biofuels Thereafter 5.3600 0.0000 First 15 years 12.5710 8.2114 13.3100 12.0900 P≤ 2 MW Thereafter 8.4752 0.0000 First 15 years 10.5740 6.1914 11.1900 10.3790 b.8.1 biomass from industrial installations in the agricultural sector P>2 MW Thereafter 8.0660 0.0000 First 15 years 9.2800 4.9214 10.0200 8.7900 P≤ 2 MW Thereafter 6.5100 0.0000 First 15 years 6.5080 1.9454 6.9400 6.1200 b.8.2 biomass from industrial installations in the forestry sector P>2 MW Thereafter 6.5080 0.0000 First 15 years 9.2800 5.1696 10.0200 8.7900 P≤ 2 MW Thereafter 6.5100 0.0000 First 15 years 8.0000 3.2199 9.0000 7.5000 b.8 Biomass from the industrial sector b.8.3 black liquor from paper industry P>2 MW Thereafter 6.5080 0.0000
The values of the feed-in tariffs, premiums, incentives, caps and floors to be paid to power producers included in the special regime will be actualized annually with the consumer price index, IPC, minus 25 units up to December 2012 and minus 50 units thereafter. Renewable energy producers receive an incentive for consuming reactive power during low demand periods in which the circulation of reactive power, and therefore the losses in the lines, increases. At the same time they have to pay a penalization if they consume re-active power during peak load hours. The incentive or penalization is calculated as a percentage of a reference value that is updated
every year. The RD 661/2007 (article 29) established a reference value of 7.8441 c€/kWh and a percentage (annex V) that goes from -4% (penalization) to +8% (incentive).
Producers using renewable energy sources without storage capa-bilities such as wind power or solar will no longer receive capacity payment according to the RD 661/2007. Year 2006, the average capa-city payment for wind power producers, amounted to 4.81 c€/kWh. Other producers included in the special regime can receive capacity payment but only when choosing the market option.
Below, Table 1-2 shows the payment scheme defined by the RD 436/2004. As mentioned in Section 1.1.3, currently, most of the producers included in the special regime are regulated by the RD 436/2004. However, no later than year 2012 they have to change to the payment scheme defined by the new RD 661/2007, shown in Table 1-1.
Table 1-2 Payment scheme for renewable electricity production according to RD 436/2004. The reference tariff, TRF, for year 2004 wasTPF
16
FPT
7.2072 c€/kWh, for year 2005 it wasTPF
17
FPT 7.3300 c€/kWh, and for year 2006 it was equalTPF18FPT to 7.6588 c€/kWh.
Group Subgroup Capacity Period Feed-in Tariff
c€/kWh
Premium c€/kWh
(for all groups in this table except solar and b.8, the
formula is 0.40*TRF)
Market-incentive
(for all groups 0.10* TRF) First 25 years 5.75*TRF= 41.4414[2004] 42.1475[2005] 44.0381[2006] ---- ---- P≤100 kW Thereafter 4.60*TRF= 33.1531[2004] 33.7180[2005] 35.2305[2006] ---- ---- First 25 years 3.00*TRF= 21.6216[2004] 21.9900[2005] 22.9764[2006] 2.50*TRF= 18.0180[2004] 18.3250[2005] 19.1470[2006] 0.7207 [2004] 0.7330 [2005] 0.7659 [2006] Photovoltaic (150 MW) P>100 kW Thereafter 2.40*TRF= 17.2973[2004] 17.5920[2005] 18.3811[2006] 2.00*TRF= 14.4144[2004] 14.6600[2005] 15.3176[2006] 0.7207 [2004] 0.7330 [2005] 0.7659 [2006] First 25 years 3.00*TRF= 21.6216[2004] 21.9900[2005] 22.9764[2006] 2.50*TRF= 18.0180[2004] 18.3250[2005] 19.1470 2006] 0.7207 [2004] 0.7330 [2005] 0.7659 [2006] Solar (350 MW) Thermal (200 MW) Thereafter 2.40*TRF= 17.2973[2004] 17.5920[2005] 18.3811[2006] 2.00*TRF= 14.4144[2004] 14.6600[2005] 15.3176[2006] 0.7207 [2004] 0.7330 [2005] 0.7659 [2006] First 15 years 0.90*TRF= 6.4865[2004] 6.5970[2005] 6.8929[2006] 2.8829 [2004] 2.9320 [2005] 3.0635 [2006] 0.7207 [2004] 0.7330 [2005] 0.7659 [2006] Wind (13000 MW) On-shore P≤5 MW Thereafter 0.80*TRF= 5.7657[2004] 5.8640[2005] 6.1270[2006] 2.8829 [2004] 2.9320 [2005] 3.0635 [2006] 0.7207 [2004] 0.7330 [2005] 0.7659 [2006] TP 16 PT
RD 436/2004, disposicion adicional sexta.
TP 17 PT RD 2392/2004, article 2. TP 18 PT 1556/2005, article 2.
First 5 years 0.90*TRF= 6.4865[2004] 6.5970[2005] 6.8929[2006] 2.8829 [2004] 2.9320 [2005] 3.0635 [2006] 0.7207 [2004] 0.7330 [2005] 0.7659 [2006] From 5 to 15 years 0.85*TRF= 6.1261[2004] 6.2305[2005] 6.5100[2006] 2.8829 [2004] 2.9320 [2005] 3.0635 [2006] 0.7207 [2004] 0.7330 [2005] 0.7659 [2006] P>5 MW Thereafter 0.80*TRF= 5.7657[2004] 5.8640[2005] 6.1270[2006] 2.8829 [2004] 2.9320 [2005] 3.0635 [2006] 0.7207 [2004] 0.7330 [2005] 0.7659 [2006] First 15 years 0.90*TRF= 6.4865[2004] 6.5970[2005] 6.8929[2006] 2.8829 [2004] 2.9320 [2005] 3.0635 [2006] 0.7207 [2004] 0.7330 [2005] 0.7659 [2006] P≤5 MW Thereafter 0.80*TRF= 5.7657[2004] 5.8640[2005] 6.1270[2006] 2.8829 [2004] 2.9320 [2005] 3.0635 [2006] 0.7207 [2004] 0.7330 [2005] 0.7659 [2006] First 5 years 0.90*TRF= 6.4865[2004] 6.5970[2005] 6.8929[2006] 2.8829 [2004] 2.9320 [2005] 3.0635 [2006] 0.7207 [2004] 0.7330 [2005] 0.7659 [2006] From 5 to 15 years 0.85*TRF= 6.1261[2004] 6.2305[2005] 6.5100[2006] 2.8829 [2004] 2.9320 [2005] 3.0635 [2006] 0.7207 [2004] 0.7330 [2005] 0.7659 [2006] Off-shore P>5 MW Thereafter 0.80*TRF= 5.7657[2004] 5.8640[2005] 6.1270[2006] 2.8829 [2004] 2.9320 [2005] 3.0635 [2006] 0.7207 [2004] 0.7330 [2005] 0.7659 [2006] First 20 years 0.90*TRF= 6.4865[2004] 6.5970[2005] 6.8929[2006] 2.8829 [2004] 2.9320 [2005] 3.0635 [2006] 0.7207 [2004] 0.7330 [2005] 0.7659 [2006] Waves, tides Thereafter 0.80*TRF= 5.7657[2004] 5.8640[2005] 6.1270[2006] 2.8829 [2004] 2.9320 [2005] 3.0635 [2006] 0.7207 [2004] 0.7330 [2005] 0.7659 [2006]
First 25 years 0.90* TRF 6.4865[2004] 6.5970[2005] 6.8929[2006] 2.8829 [2004] 2.9320 [2005] 3.0635 [2006] 0.7207 [2004] 0.7330 [2005] 0.7659 [2006] Hydro power P≤10 MW (2400 MW) Thereafter 0.80*TRF= 5.7657[2004] 5.8640[2005] 6.1270[2006] 2.8829 [2004] 2.9320 [2005] 3.0635 [2006] 0.7207 [2004] 0.7330 [2005] 0.7659 [2006] First 25 years 0.90*TRF= 6.4865[2004] 6.5970[2005] 6.8929[2006] 2.8829 [2004] 2.9320 [2005] 3.0635 [2006] 0.7207 [2004] 0.7330 [2005] 0.7659 [2006] 10<P≤25 MW Thereafter 0.80* TRF 5.7657[2004] 5.8640[2005] 6.1270[2006] 2.8829 [2004] 2.9320 [2005] 3.0635 [2006] 0.7207 [2004] 0.7330 [2005] 0.7659 [2006] First 15 years 0.90*TRF= 6.4865[2004] 6.5970[2005] 6.8929[2006] 2.8829 [2004] 2.9320 [2005] 3.0635 [2006] 0.7207 [2004] 0.7330 [2005] 0.7659 [2006] Hydro power 10<P≤50 MW 25<P≤50 MW Thereafter 0.80*TRF= 5.7657[2004] 5.8640[2005] 6.1270[2006] 2.8829 [2004] 2.9320 [2005] 3.0635 [2006] 0.7207 [2004] 0.7330 [2005] 0.7659 [2006] First 20 years 0.90*TRF= 6.4865[2004] 6.5970[2005] 6.8929[2006] 2.8829 [2004] 2.9320 [2005] 3.0635 [2006] 0.7207 [2004] 0.7330 [2005] 0.7659 [2006] b.6 energy crops, biomass from residues in the agricultural sector, gardening, and forestry sites Thereafter 0.80*TRF= 5.7657[2004] 5.8640[2005] 6.1270[2006] 2.8829 [2004] 2.9320 [2005] 3.0635 [2006] 0.7207 [2004] 0.7330 [2005] 0.7659 [2006] First 20 years 0.90*TRF= 6.4865[2004] 6.5970[2005] 6.8929[2006] 2.8829 [2004] 2.9320 [2005] 3.0635 [2006] 0.7207 [2004] 0.7330 [2005] 0.7659 [2006] b.7 biomass from animal dung, biofuels and biogas Thereafter 0.80*TRF= 5.7657[2004] 5.8640[2005] 6.1270[2006] 2.8829 [2004] 2.9320 [2005] 3.0635 [2006] 0.7207 [2004] 0.7330 [2005] 0.7659 [2006] Biomass (3200 MW) b.8 biomass from industrial installations in the agricultural and forestry sector 0.80*TRF= 5.7657[2004] 5.8640[2005] 6.1270[2006] 0.3*TRF= 2.1622 [2004] 2.1990[2005] 2.2976 [2006] 0.7207 [2004] 0.7330 [2005] 0.7659 [2006]
Besides the feed-in tariffs, premiums and market incentives in Table 1-2, the RD 436/2004 establishes incentives/penalties for reactive power (annex 5) from 8% incentive to -4% penalty, incen-tives for fault-ride-through of 5% of the reference tariff (TRF) and capacity payment. The capacity payment applies only to those pro-ducers choosing the market option and year 2006 it amounted to 4.81 c€/kWh.
Below, Table 1-3 shows the payment scheme defined by the RD 2818/1998. There are currently very few producers regulated by the RD 2818/1998.
Table 1-3 Payment scheme for renewable electricity production according to RD 2818/1998.
Group Capacity Feed-in Tariff
c€/kWh Premium c€/kWh Solar P≤5kW (up to 50 MW) 39.6668 36.0607 P>5kW 21.6364 18.0303 Wind 6.6231 3.1613 Waves, tides 6.7313 3.2755 Hydro power P≤10 MW 6.7313 3.2755 Hydro power 10<P≤50 MW =3.2755* ((50-P)/40) Primary* Biomass 6.5090 3.0471 Secondary** Biomass 6.2866 2.8248
*All vegetables with a growing period no longer than one year. Those can be used directly or after a transformation procedure.
**Residues of the transformation of primary biomass such as biogas and biofuels.
Besides the feed-in tariffs or premiums specified in Table 1-3 pro-ducers regulated by the RD 2818/1998 receive/pay an incen-tive/penalty for reactive power (article 26). When the power factor is larger than 0.9 then the producer receives a complement and when it is lower than 0.9 the producer pays a penalty. The amount of the complement/penalty is established in the Royal Decree for tariffs each year.
The feed-in tariffs and premiums defined in the RD 2818/1998 are updated yearly with the variation of the average wholesale electri-city price.
1.2.1 Development of payment schemes
By comparing the payment schemes in the last three royal decrees on the special regime the following conclusions can be drawn: • Solar photovoltaic power production has experienced a great
in-crease regarding payment. Installations with a capacity below 5 kW have almost the same payment as 10 years ago but large installations have got a much higher payment according to the new legislation. A solar photovoltaic installation with an installed capacity of 150 kW received according to the RD 2818/1998 a payment of 21.6 c€/kWh and according to the new royal decree, RD 661/2007 a payment of 41.8 c€/kWh is received.
• Wind power producers choosing the feed-in tariff option receive slightly higher payment than 10 years ago but since 2004 the number of wind power producers choosing the market option has increased tremendously and during 2005 and 2006 they have received very high payments. However, the payment has been limited by the new legislation published on 2007 by a price cap of 8.5 c€/kWh which is 30% higher than the feed-in tariff wind power producers received 10 years ago.
• Electricity production from energy crops and biogas receive much higher payment according to the new legislation. An installation using energy crops with an installed capacity of 1.5 MW earlier received according to the RD 2818/1998 a payment of 6.5 c€/kWh and according to the new legislation, RD 661/2007 will receive a payment of 15.9 c€/kWh.
1.2.2 Agents Opinions on different Payment Schemes for
Renewable Electricity Production
According to several interviewed agents in the Spanish wind power sector, payment schemes based on market mechanisms such as green certificates, need price setting mechanisms capable of reflecting real investment costs in order to work as effective payment schemes. This is only possible in a wide and deep market where the participa-ting agents have equal access to the price relevant information. The wind power sector is still emerging and, according to the interviewed, is still not prepared for a payment scheme based only on market mechanisms. However, this kind of market-based payment schemes
can be adequate when the sector is more established. There is a risk with those market-based systems to end up paying more for the capacity than what it had been paid with a feed-in tariff system. An example mentioned by some of the interviewed agents in Spain is what has happened in the UK and Italy where the certificates have reached prices of 140–180 €/MWh, which is much higher than the feed-in tariff paid to renewable producers in Germany and Spain of 80–85 €/MWh.
1.3
Application Procedure for Access and
Connection to the Grid
The application procedure for the connection to the grid is defined in the Royal Decree 1955/2000 in its Title IV. There are two different procedures depending on whether the production installation is to be connected to the transmission system or to the distribution system. The procedures are outlined below.
Procedure for connection to the transmission system (RD 1955/2000 article 53 and 57)
1. The project developer sends the access application to the trans-mission system operator, TSO. The application has to include the information defined in the operating procedure 12.1 published
by the TSOTPF
19
FPT.
2. The TSO sends a report with the eventual anomalies or mistakes to the project developer so that those are corrected.
3. The project developer corrects the anomalies or mistakes within a month from the reception of the report of the TSO.
4. After receiving the correct access application, the TSO has two months to communicate the project developer on the access license depending on whether there is available capacity for the connection or not. If the TSO does not inform the project developer on time, then the project developer can appeal to the regulatory body CNE. If the project developer does not agree with the proposed connection point by the TSO then he can appeal to the CNE who has a period of three months to decide on the conflict. The TSO´s report on available capacity has a validity of six months.
TP
19
PT
5. The project developer sends the basic project and the program of execution to the transmission company in order to get the con-nection license.
6. The transmission company has to send within a month a report
to the TSOTPF
20
FPT
regarding the fulfillment of the technical require-ments as well as a copy of the basic project and the program of execution.
7. The TSO will write a report within a month.
8. The access and connection licenses can be processed at the same time but to get the connection license the project developer has to have the access license.
Project developers of installations which are to be connected to the transmission grid have to hand in a deposit of 2% of the cost of the whole installation (for example 2% of the cost of the wind farm) to the Ministry, MITYC according to the Law RD 1454/2005 which added a new article to the RD 1955/2000 (article 59 bis). That is a requisite to initiate the procedure for access and connection to the grid. That deposit is given back to the project developer when he/she gets the administrative license for the installation or when, due to reasons beyond his responsibility, the administrative license cannot be obtained.
However, the new legislation, RD 661/2007, modifies the amount of the deposit defined by the former Law, RD 1454/2005, which for the transmission system becomes:
• 500 €/kW for solar photovoltaics
• 20 €/kW for all other producers included in the special regime. Procedure for connection to the distribution system (RD 1955/2000 article 62, 63 and 66)
1. The project developer sends the access application to the operator of the distribution system, DSO, in the area. Each distribution company has an application model.
2. The DSO sends within 10 days a report with the eventual ano-malies or mistakes to the promoter so that those are corrected. 3. The promoter corrects the anomalies or mistakes within 10 days
from the reception of the report of the DSO.
TP
20
PT
As it was described in Section 1.1.1, Red Electrica de España, REE, is the Spanish TSO and the largest but not the only transmission company. Therefore, the transmission company and the TSO are referred to as two different entities even though in most of the cases they are the same entity, REE.
4. After receiving the correct access application, the DSO has 15 days to communicate the project developer on the access license depen-ding on whether there is available capacity for the connection or not. The report of the DSO on available capacity has a validity of six months. If the DSO does not inform the project developer on time, then the project developer can appeal to the Regulatory Body CNE. The DSO has to inform the TSO about access appli-cations for capacities larger than 10 MW (that is a change intro-duced by the RD 661/2007 in its annex XI. Earlier the limit was 50 MW or a capacity lower than 5% or 10% of the short-circuit capacity of the grid at the connection point for peak and low demand periods respectively). The TSO has to send a report on the capacity within two months. If the project developer does not agree with the proposed connection point by the DSO then he can appeal to the CNE who has a period of three months to decide on the conflict.
5. The project developer sends the basic project and the program of execution to the distribution company in order to get the connection license.
6. The distribution company, in case the connection can affect the transmission system as defined earlier in point 4, has to send within a month a report to the TSO regarding the fulfillment of the technical requirements as well as a copy of the basic project and the program of execution.
7. The TSO will write a report within a month.
8. The access and connection licenses can be processed at the same time but to get the connection license the project developer has to have the access license.
The environmental assessment of the projects is a part of the admi-nistrative licensing process and is a requirement to get the admini-strative license necessary to build the installations. The adminiadmini-strative license can be processed at the same time as the access and connec-tion licenses. The environmental assessment process takes in practice about six or seven months according to one Spanish project developer. The RD 661/2007 (disposicion final segunda) adds a new article to the RD 1955/2000, called article 66 bis. This new article defines a deposit to be paid by project developers of installations which are to be connected to the distribution grid. The amount of the deposit is:
• 500 €/kW for solar photovoltaics.
• 20 €/kW for all other producers included in the special regime. It is important to note that solar photovoltaic installations located in residential, commercial, service or industrial premises do not have to hand in the deposit defined in the list above. The payment of the deposit is a requisite to initiate the application procedure of access and connection to the distribution grid. That deposit is given back to the developer when the developer gets the administrative license for the installation or when, due to reasons beyond its responsi-bility, that administrative license cannot be obtained. Installations which do not need any administrative license for being built will get back the deposit when the installation has been definitively included in the register for special regime.
1.3.1 Definition of the Capacity of a Production Installation
The Law for the special regime establishes a capacity limit of 50 MW to receive the highest payment, see Figure 1-4: Factor for installa-tions using renewable energies with an installed capacity larger than 50 MW. In practice, installations larger than 50 MW are split into several installations each with installed capacity below 50 MW in order to receive the highest payment and make use of the locations with good wind resource. An example of this is the wind farms known as Maranchón I and IV with a capacity of 18 and 48 MW each. To the substations of these wind farms are also other wind
farms connected with a total capacity of 130 MWTPF
21
FPT
. Since the total capacity is 130 MW, it is also possible to access the transmission grid since it is necessary to have at least 100 MW to connect to the transmission grid (see Section 1.3.2 below). In that case the owners of the different installations make a joint application for the connec-tion to the grid. Each installaconnec-tion gets paid independently. Another advantage is to be able to own the substation and have control over it.
Different generating units are considered, according to the Law RD 2818/1998 (article 3), as one single installation when they inject their energy in the same transformer with a voltage output equal to the voltage of the grid to which they are connected. The capacity of
TP
21
PT
http://www.biomanantial.com/iberdrola-se-consolida-como-la-primera-empresa-eolica-del-mundo-a-398.html
the installation is the sum of the capacity of the individual gene-rating units. This definition has remained unchanged in posterior legislation. If different generating installations use the same connec-tion installaconnec-tions, then the definiconnec-tion described earlier in this para-graph will be understood relating to the transformer before the one that is used by the different installations. This means for instance that 30 wind turbines of 2 MW each will be considered as a 60 MW wind park if they use the same transformer to connect to the grid. If 15 turbines are connected to one transformer and the other 15 to another transformer, then there will be two installations of 30 MW each.
1.3.2 Permitting Entities
The operating procedure 13.1 published by the TSOTPF
22
FPT establishes
minimum capacity limits for the connection of a producing installa-tion to the transmission grid. Those limits are 100 MW for the con-nection to the 220 kV grid and 250 MW for the concon-nection to the 400 kV grid. These limits were applied even before this operating procedure was approved. The system operator REE has been flexible with the limit of 100 MW for the connection to the 220 kV grid. If for example a wind park with an installed capacity of 50 MW applied for connection to the 220 kV grid and had plans to later enlarge the capacity to 100 MW, then they have got access to the 220 kV grid.
It might sound confusing to combine the limit of 50 MW to get the payment for the special regime as the same time as the mini-mum capacity is 100 MW to connect to the transmission grid. In practice what is done is that several project developers make a joint application for connection to the transmission grid in order to reach the requisite on minimum capacity for the connection and at the same time receive the highest possible payment. To make the joint application the Law RD 661/2007 establishes the requirement of a node representative that is selected by the regional government or the competitive authority when several project developers ask on access to the transmission grid. It is usually the project developer that has been a longer time at the location or the one developing the largest installation that is selected by the authorities which com-municate the decision to the system operator and the transmission company. This speeds up the licensing process.
TP
22
PT
The administrative licenses, i.e., the licenses for construction, modifying or closing transmission installations are given by the Ministry. Those administrative licenses are public and are published in the State official bulletin, BOE. Administrative licenses for distri-bution installations are given by the regional authorities. The defini-tion of what is included in the transmission installadefini-tions and distri-bution installations can be found in article 5 of the RD 1955/2000. It is important to point out that according to that RD, producing installations, transformers to those installations, and connecting in-stallations such as power lines are included in neither the transmission nor the distribution grid. However, it is quite common for producers which are about to connect to the distribution grid, to give the power line and the position at the substation to the grid company (see Section 1.5).
The administrative license for generating installations with either an installed capacity over 50 MW, located in more than one munici-pality, or in the sea is a responsibility of the Ministry of Industry, Tourism and Trade through its Dirección General de Energía, DGE. This is established in the Royal Decree 661/2007 article 4.
The administration wants that project developers process the administrative licenses for the wind farm and the connecting line together. It can be a single dossier or several depending on whether the line is to be used by a single producer or by several. According to a Spanish project developer the negotiation with the owners of the land necessary to build a wind farm is usually fast while nego-tiations with the owners of the land necessary to build a connecting line are more difficult. When no agreement can be reached with the land owners then it is possible to expropriate the land if the installa-tions are declared by the administration as of public usefulness. The administrations use to require the project developers agreement with at least 50% of the involved owners in order to expropriate. Expro-priation facilitates considerably the construction of lines since they can be built even if no agreement is reached with all the land owners.