Department of Crop production ecology
Effects of nitrogen quality and quantity on
weed-crop competition
– a greenhouse experiment with Avena
sativa and Avena fatua
Lukas Hallberg
Effects of nitrogen quality and quantity on weed-crop
competition – a greenhouse experiment with Avena sativa and
Avena fatua
Effekter av kvävekvalitet och kvantitet på konkurrens mellan ogräs och gröda – ett växthusexperiment med Avena sativa och Avena fatua
Lukas Hallberg
Supervisor: Alexander Menegat, SLU, Department of Crop production ecology
Assistant supervisor: Elsa Lagerquist, SLU, Department of Crop production ecology
Examiner: Giulia Vico, SLU, Department of Crop production ecology
Credits: 30 credits
Level: A2E
Course title: Master thesis in Biology, A2E - Agriculture Programme - Soil/Plant
Course code: EX0898
Programme/education: Agriculture programme – Soil and Plant Sciences 270 credits
Course coordinating department: Department of Crop production Ecology
Place of publication: Uppsala
Year of publication: 2019
Cover picture: Avena sativa and Avena fatua from greenhouse experiment
before harvest. Lukas Hallberg, photo.
Title of series: Examensarbete / Institutionen för växtproduktionsekologi, SLU
Online publication: https://stud.epsilon.slu.se
Keywords: weed-crop competition, resource pool diversity, soil microbes, weed community
The intensification of agricultural activities has provided unprecedented increases in crop production. In the light of this development concerns have been raised about its negative environmental impact. High-input farm management has further reduced the weed diversity and shaped weed communities to consist of a few highly competitive weed species. Ecological theory and soil microbial processes presents another per-spective focusing on managing weeds with the use of different nutrient sources and crop diversity. The establishment of distinct resource pools in soil allow nutrients to be segregated between species and reduce weed-crop competition. The aim of this study was to investigate the influence of different nutrient sources in different quan-tities on competitive interactions between the weed species Avena fatua (wild oat) and Matricaria perforata (scentless chamomille) and the crop Avena sativa (oat) in-tercropped with the cover crop Trifolium resupinatum (Persian clover). The model plants were grown in a greenhouse in pots prepared with three soil substrates con-taining different nitrogen sources and quantities. A. fatua and A. sativa biomass and shoot height were statistically analysed in order to investigate the species responses to changes in nitrogen quality and quantity. A. sativa yield loss due to A. fatua com-petition were studied at four different A. fatua densities. The response to changes in soil nitrogen quality, nitrogen quantity and plant density were greater for A. sativa compared to A. fatua. Higher resource pool diversity increased the interspecific com-petition between A. fatua and A. sativa. The unresponsiveness of A. fatua to changing nutrient regimes and competition suggests that reinforced competition from the crop could be used to exhaust the weed’s energy reserves. Growth of T. resupinatum and
M. perforata was insufficient to influence A. sativa in the experiment.
Key words: weed-crop competition, resource pool diversity, soil microbes, weed
community
Abstract
Intensifieringen av jordbrukets aktiviteter har bidragit till en produktionsökning utan motstycke. Samtidigt har en oro kring dess negativa miljöpåverkan ökat i ljuset av denna utveckling. Det moderna lantbrukets stora tillförsel av insatsvaror har lett till en minskad mångfald av ogräsarter och format ett ogrässamhälle bestående av några få starkt konkurrenskraftiga ogräs. Ekologisk teori och mikrobiella markprocesser bidrar med ett annat perspektiv med fokus på ogräskontroll, utifrån val av närings-källor och ökad mångfald av grödor i växtföljden. Genom att etablera åtskilda pooler av resurser i marken möjliggörs en uppdelning av näringen mellan arter med en mins-kad konkurrens mellan ogräs och gröda som följd. Målet med denna studie var att utforska vilket inflytande olika näringskällor, med varierande näringsmängd, har på konkurrensen mellan ogräsarterna Avena fatua (flyghavre) och Matricaria perforata (baldersbrå) och grödan Avena sativa (havre) samodlad med mellangrödan Trifolium
resupinatum (persisk klöver). Modellväxterna odlades i växthus i krukor med tre
jordsubstrat innehållande olika kvävekällor samt olika mängd kväve. Biomassa och planthöjd från A. fatua och A. sativa registrerades och analyserades i olika modeller för att utreda arternas respektive känslighet för förändrad kvalitet av kväve och kvävemängd. Skördebortfall av A. sativa till följd av konkurrens från A. fatua stude-rades vid fyra olika planttätheter av A. fatua. Responsen av förändrad kvävekvalitet och kvävemängd samt planttäthet var större för A. sativa i jämförelse med A. fatua. En större diversitet av näringskällor ökade mellanartskonkurrensen mellan A. fatua och A. sativa. A. fatuas okänslighet gentemot förändrade näringsbetingelser och kon-kurrens antyder att en förstärkt konkon-kurrens från grödan kan användas till att uttömma ogräsets energireserver. Tillväxt av T. resupinatum och M. perforata var otillräcklig för att påverka A. sativa i försöket.
Nyckelord: grödkonkurrens, diversitet av näringskällor, markmikrober,
ogräs-samhälle
Konkurrensen om lättillgänglig gödsel mellan ogräs och gröda är stor. Genom att tillföra olika näringskällor och variera växtföljden kan en uppdelning av näringsre-surser ske i marken. Detta i kombination med en rikare ogräsflora kan bidra till att minska ogräsens negativa påverkan på grödor.
Att endast ett fåtal ogräsarter idag påträffas i många jordbruksmarker ses som ett framsteg i kontroll av ogräs. Faktum kvarstår att de kvarvarande ogräsen har fortsatt stor negativ påverkan och begränsar livsmedelsproduktionen. En ensidig växtföljd och ett kortsiktigt perspektiv på ogräskontroll med herbicider har format ett artfattigt men konkurrenskraftigt ogrässamhälle. I motsats till detta kan en ökad artrikedom av ogräs medföra minskad konkurrens gentemot grödor. Genom att bibehålla en rik ogräsflora kombinerat med tillförsel av näring från djur- och gröngödsling samt utö-kad mångfald av grödor i växtföljden förutspås en minsutö-kad konkurrens från ogräs. Denna förändrade skötsel leder till en etablering av olika näringspooler som inte är direkt tillgängliga för alla växtarter. Dessa pooler kan delas upp med hjälp av mikro-organismer i marken som samarbetar med olika växtarter och förmedlar näringen till dessa. Resultatet blir att gröda och ogräs inte konkurrerar om samma resurser och en större mängd ogräs kan tolereras i fält utan sänkt skörd. Målet med denna studie var att utforska vilket inflytande olika näringskällor, med varierande näringsmängd, har på konkurrensen mellan ogräsarterna flyghavre (Avena fatua) och baldersbrå
(Matri-caria perforata) och grödan havre (Avena sativa) samodlad med mellangrödan
per-sisk klöver (Trifolium resupinatum). Växterna odlades i växthus i krukor fyllda med tre olika jordtyper. Planthöjd mättes över tid och skördad biomassa vägdes för att analysera arternas känslighet mot förändrad kvalitet och mängd av kväve. I detta för-sök gick det inte att visa att jord med kväve från mer komplexa källor leder till mins-kad ogräskonkurrens. Gensvaret av förändrad tillväxt vid olika kvävekvalitet och mängd var större för havre jämfört med flyghavre. Flyghavrens okänslighet gentemot förändrade näringsbetingelser och konkurrens antyder att en förstärkt konkurrens från grödan kan utnyttjas för att uttömma ogräsets energireserver. Den persiska klö-vern och baldersbrån lyckades inte växa tillräckligt i experimentet för att påverka havren.
List of tables 8
List of figures 9
Abbreviations 10
1 Introduction 12
1.1 Aims and hypotheses 14
2 Background 16
2.1 Mechanisms explaining plant diversity and coexistence 16
2.2 Weed-crop nutrient competition 17
2.3 Plant-microbe nutrient mediation in soil 18
2.4 Cover crops and intercropping 20
2.5 Weed flora and diversity 21
3 Materials and method 23
3.1 Experimental design 23
3.2 Measurements 25
3.3 Data analysis 26
3.3.1 Surface response interaction analysis 26
3.3.2 Nitrogen quality and quantity analysis 27
3.3.3 Rectangular hyperbola model, additive design 27
3.3.4 Three parameter logistic growth model 29
4 Results 30
4.1 T. resupinatum and M. perforata interaction 30 4.2 Influence of soil nitrogen quality and quantity on A. sativa and A. fatua
biomass 32
4.2.1 Nitrogen quality 32
4.2.2 Nitrogen quantity 33
4.2.3 Nutrient use efficiency 35
4.3 A. sativa yield loss by A. fatua 35 4.4 A. sativa shoot height growth development 38
5 Discussion 42
5.1 Resource pool diversity 42
5.2 A. sativa and A. fatua response to nitrogen quality and quantity 43
5.3 T. resupinatum and M. perforata growth 45
5.4 Future research 46
6 Conclusion 48
References 49
Table 1. Nitrogen balance from analysis of mixed soil substrates A, B and C. 24 Table 2. Nitrogen content analysis of organic fertilisers added to soil substrates B
and C. 24
Table 3. Measurements made of the model plants Avena sativa, Trifolium resupinatum, Avena fatua and Matricaria perforata in the greenhouse
experiment at specific days after sowing (DAS). 26
Table 4. Full and reduced rectangular hyperbola models with estimated parameters explaining A. sativa shoot biomass yield loss (%) at low weed densities (I)
and high densities (A) for soil substrates A, B and C. 28
Table 5. Selection of rectangular hyperbola models explaining Avena sativa shoot
biomass yield loss (%). 36
Table 6. Differences in Avena sativa yield loss (%) between soil substrates at low Avena fatua densities (plants m-2) and shoot biomass (g) at 42 days after
sowing (DAS). 37
Table 7. The slope of Avena sativa and Avena fatua shoot height at 50% maximum shoot height (mm/day) with different soil substrates and A. fatua densities
(plants m-2) at 42 days after sowing. 38
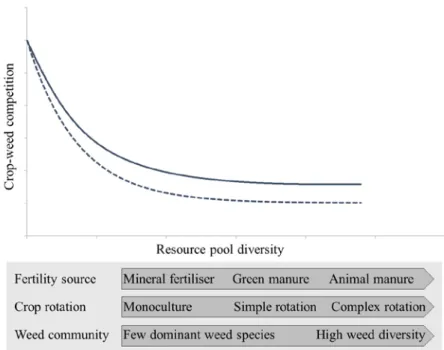
Fig. 1. Increasing resource pool diversity reduces the weed-crop competition. 14
Fig. 2. Experimental designs used in this study. 25
Fig. 3. Effect of (a) Trifolium resupinatum density (plants m-2) on Avena sativa shoot and root biomass (g) production at 42 days after sowing (DAS). 31
Fig. 4. Effect of Trifolium resupinatum density (plants m-2) on Avena fatua shoot
biomass (g) production at 42 days after sowing. 31
Fig. 5. A trend of higher Avena sativa shoot biomass (g) with increasing Avena fatua
density (plants m-2) in soil substrate A (NPK, N-min = 111.0 kg ha-1) compared to B (cow manure and NPK, N-min = 99.4 kg ha-1) at 42 days
after sowing. 33
Fig. 6. Avena sativa (a) shoot and (b) root biomass (g) increased with higher
nitrogen quantity in soil substrate A (NPK, N-min = 111.0 kg ha-1) compared to C (cow manure and compost, N-min = 54.5 kg ha-1) at 42
days after sowing. 34
Fig. 7. A trend of higher Avena sativa shoot biomass (g) in soil substrate A (NPK,
N-min = 111.0 kg ha-1) compared to C (cow manure and compost, N-min = 54.5 kg ha-1) across all Avena fatua densities (plants m-2) at 42 days after
sowing. 34
Fig. 8. Avena sativa shoot nutrient use efficiency (g kg-1 ha-1 N; NUE) responded to changes in nitrogen quantity at 42 days after sowing (DAS). 35
Fig. 9. Increasing (a) Avena fatua density (plant m-2) and (b) A. fatua shoot biomass (g) caused a higher Avena sativa shoot biomass yield loss (%) at 42 days
after sowing. 37
Fig. 10. Three parameter model with actual Avena sativa shoot height (mm) at
different Avena fatua densities (plants m-2) at 42 days after sowing (DAS). 39
Fig. 11. Avena sativa development stage (BBCH) was affected by the highest Avena fatua density (600 plant m-2) at 29, 35 and 42 days after sowing (DAS). 40
Fig. 12. A trend towards decreasing Avena sativa shoot chlorophyll content (SPAD)
with higher Avena fatua density (plants m-2) at 42 days after sowing. 41
AICc Akaike’s information criterion, bias-corrected
BBCH Biologische Bundesanstalt, Bundessortenamt and Chemical industry
DAS Days after sowing
GLMM Generalised linear mixed model
ICC Intra-class correlation coefficients
NUE Nutrient use efficiency
RMSE Root mean square error
RPDH Resource pool diversity hypothesis
Intensification of agricultural land use and production has since the 1960s pro-vided unprecedented increases in yield levels with the advent of modern agricultural techniques comprising high yielding cultivars, abundant use of mineral fertilisers, pesticides and irrigation (Foley et al., 2005). The success of what has been called the “Green Revolution” is challenged by increasing negative environmental impacts tied to modern farming methods. High-input agriculture have led to increasing greenhouse gas emissions, eutrophication of aquatic environments and reduced bi-odiversity above and below ground (Tilman et al., 2002). This affects the provision of ecosystem services that are the societal benefits that can be gained from ecolog-ical processes. It includes the production of natural resources and supportive ser-vices as nutrient cycling and soil formation (Tilman et al., 2002). Another major concern in high-input systems is the deterioration of soil health through erosion, nutrient leaching and loss of organic matter, all severely affecting soil biodiversity and fertility building processes (Brussaard et al., 2007; Tsiafouli et al., 2015). Re-garding preservation of soil fertility, the inherent challenge lies in the feat to de-crease soil disturbance and maintain soil biodiversity in intensively cultivated crop-ping systems, without jeopardising current yield levels.
Conservation agriculture constitutes an alternative way to sustain productivity without sacrificing above- and belowground biodiversity (Friedrich et al., 2012). It is guided by the principles of (1) reduced soil disturbance (2) permanent soil cover and (3) diverse cropping systems. However, reduced soil cultivation introduces ma-jor constraints in controlling weeds consistently, this is especially challenging to systems not using herbicides (Mirsky et al., 2012).
A small group of highly competitive weed species have gained an advantage from the management filters of undiversified crop rotations, intense soil cultivation and abundant application of herbicides (Storkey et al., 2012). The emphasis on short-term management has shaped a species poor weed flora that continues to exert a strong competitive pressure on crops, despite sustained use of herbicides (Gaba et al., 2016). A large body of knowledge exist in the field of applied weed control but
in the context of complex multi-species systems, Ward et al. (2014) perceives a need to broaden the focus of weed science and draw from wider ecological theory.
Several studies have indicated that crops in organic agricultural systems appear to be less sensitive to weed competition compared to corresponding conventional systems (Delate & Cambardella, 2004; Ryan et al., 2009; Ryan et al., 2010). Based on these finding, the resource pool diversity hypothesis (RPDH) predicts that a di-versity of resources forms niches that can be segregated through partitioning and in turn decrease weed-crop competition (Smith et al., 2010). This builds upon Reyn-olds et al. (2003) theory of soil microbes as key agents that drive nutrient partition-ing by mediation through specific plant-microbe associations. The formation of dis-tinct resource pools is considered to be greater in agricultural systems with a more diversified selection of crops providing different compositions of plant residues in soil. Cover crops are an important contributor to the establishment of increased nu-trient pool diversity as well as they are reducing the reliance on mineral fertilisers (Deguchi et al., 2007; Li et al., 2007).
Fertiliser inputs from animal and green manure influence the establishment of different resource pools where nutrients are bound in complex organic compounds requiring microbial mediation (Smith et al., 2010). Evidence in support of this model (Fig. 1) have been found in natural ecosystems that are rich in both above- and belowground biodiversity, such as forests and grasslands (Ceulemans et al., 2017; Luo et al., 2018; Phillips et al., 2013). In an agricultural context, experiments with biologically active soil inoculum from organic farms have shown to decrease weed-crop competition compared to soil from conventional farms (Johnson et al., 2017). MacLaren et al. (2018) broadened the scope of managerial options further by showing that the inclusion of sheep grazing in rotations together with crop sequence diversity influenced the number of nitrogen sources and suppressed weed abun-dance. The diversity of weed species was promoted and herbicide and fertiliser in-puts could be decreased in the study while sustaining high crop yields.
There is lack of evidence for the applicability of RPDH in less diverse cropping systems dominated by cereals and few optional break crops. Although the RPDH predicts less interspecific competition to occur when crops and weed species differ in nutrient acquisition traits, it has not been proven whether competition between morphologically similar crops and weed species still can be affected by diverse nu-trient pools (Smith et al., 2010). When weed-crop differences in nunu-trient root uptake are small, due to similarities in acquisition traits, it is unknown if the microbial me-diation still may segregate nutrients from distinct nutrient pools.
Fig. 1. Increasing resource pool diversity reduces the weed-crop competition. The resource partitioning
is dependent on plants’ nutrient acquisition traits. The solid line depicts the intensity of weed-crop competition between species with similar traits and the dashed line between species with different traits. The choice of fertiliser source and placement together with the choice of crop influence the establishment of resource pools as well as the weed community present in field. Figure adapted from Fig 1. & 2. in Smith et al. (2010).
1.1 Aims and hypotheses
The aim with this thesis was to (1) investigate if increased nitrogen pool diversity reduces weed-crop competition, assuming that nitrogen is the most limiting re-source. The competitive effect from two weed species was studied, one with nutrient acquisition traits similar to the crop and another weed species with divergent traits. (2) Further, the response to differences in nitrogen quantity and plant density was studied between the weed species and crop. This was tested with the hypotheses: H1 Increased nitrogen pool diversity reduces interspecific weed-crop competition
due to nutrient segregation in early growth stages.
H2 The model weed species’ production of biomass and competitive abilities are reduced in nitrogen limited conditions since small seeded plants are more sen-sitive to nutrient limitation.
H3 Increasing plant densities provoke a greater response in biomass and shoot height growth of the weed species, being more plastic compared to the crop.
Three different nitrogen sources were studied in the experiment, namely inor-ganic NPK fertiliser, cow manure and compost. The competitive interaction was investigated between weeds and crop in an intercropping system consisting of Avena sativa (oat, cv. Galant) as main crop and Trifolium resupinatum (Persian clover) as undersown crop. T. resupinatum is an annual clover and it was selected due to its high relative growth rate, early establishment and rapid covering of soil (Den Hol-lander et al., 2007). The model weed species in this study were Avena fatua (wild oat) and Matricaria perforata (scentless chamomille). A. fatua is a grass weed spe-cies similar to A. sativa in terms of development and nutrient acquisition traits and M. perforata represents a morphologically different broadleaved weed species.
2.1 Mechanisms explaining plant diversity and coexistence
The stable coexistence of many plant species observed in a variety of ecosystems has been studied extensively and is traditionally explained by the establishment of different niches (Gause, 1934). Spatio-temporal differences in resource use carve out distinct niche spaces that prohibits a certain species from outcompeting its neighbour (Li et al., 2014). This results in a situation where intraspecific competitive interactions becomes greater than interspecific competition. The strength of niche segregation as a concept, where a diversity of species coexist over time, is self-evident in the heterotrophic animal kingdom but it has remained less apparent in plant ecology (Silvertown, 2004). The main pathways in plants for resource acqui-sition are very similar among most species. Few opportunities for diversification exist since all plants rely on the same resources; light, water and mineral nutrients. Nonetheless, niche segregation in plant communities are observed and can be real-ised through differences in traits determining drought tolerance, rooting depth and canopy development (Silvertown, 2004).Nitrogen, is principally acquired in inorganic forms, either as reduced NH4+ or
oxidized NO3-, although plants in nitrogen limited environments also acquire amino
acids directly (Persson & Näsholm, 2001). In soil, nitrogen can be bound in a mul-titude of complex organic compounds such as proteins, chitin and nucleic acids. In order for plants to access these forms of nitrogen, microorganisms are required to degrade the organic compound and either directly mediate or release free NH4+
re-spectively NO3- (Reynolds et al., 2003).
Beyond niche segregation, the concept of facilitation is used to explain beneficial plant-plant interactions that allow plant coexistence and diversity by increasing available resources or suppressing other competitors and pathogens (Li, et al.,
2014). The establishment of positive plant relationships could increase nutrient ac-quisition in limited conditions and reduce interspecific competition. Facilitation oc-cur either directly between plants or indirectly with plant-pollinator interactions and associations with microbes carrying out nutrient mediation by means of nitrogen fixation and mycorrhizal interaction. It has proven to be difficult to experimentally distinguish facilitation from niche segregation since both occur simultaneously in plant ecosystems, both mechanisms are therefore included in the concept of com-plementarity. As an example, plant association with Arbuscular mycorrhizal fungi (AMF), that supply plants with phosphorus from unavailable sources, contain both elements of niche segregation and facilitation. Some species form plant-AMF asso-ciations and occupy a distinct niche while phosphorous is simultaneously facilitated to neighboring plants (Li et al., 2014).
2.2 Weed-crop nutrient competition
A general distinction between many agricultural crops and weed species is the difference in seed size (Harbur & Owen, 2004). The smaller sized weed seeds con-stitute a fundamental competitive disadvantage with less seedling energy and nutri-ent reserves at disposal. To overcome this, many weed species have adapted to a higher relative growth rate (RGR) compared to crops, this accelerated growth is made possible by a higher uptake of nutrients early in the growing season. Nutrients, and especially nitrogen, are important resources that strongly influence weed-crop competition. Weed seedlings commonly possess longer roots than crop seedlings and this feature enables a higher nutrient use efficiency and greater accumulation of nutrients (Harbur & Owen, 2004). The high nutrient levels commonly found in ag-ricultural fields have exerted a selection pressure towards weeds with effective nu-trient acquisition traits. Harbur & Owen (2004) asserts that more attention could be directed towards nutrient management as a tool in weed control strategies and avoid the exclusive focus on fulfilling crop nutrient requirements. A study in responses to increasing nitrogen levels showed that 15 weed species accumulated more shoot biomass and 8 weed species increased in root biomass compared to wheat (Black-shaw et al., 2003). This suggests that the strategy of solely supplying high levels of readily available nitrogen could fertilise weeds more than crops and might be inad-equate to increase crop competitiveness. This is not true for all combinations of crops and weeds, studies on maize and potato have demonstrated strengthened crop competition with higher nitrogen inputs (Tollenaar et al., 1994; Van Delden et al., 2002). However, it is proposed that high levels of applied nutrients primarily benefit weeds in situations where nutrients are the main limiting factor (Van Delden et al., 2002).
A higher RGR is not always an advantage in all situations, dependence on early nutrient acquisition renders weed species more sensitive to nutrient deficiencies than crops with larger seeds (Shipley & Keddy, 1988). This presents an opportunity to manage nutrient availability as a way to influence the weed abundance when other resources are non-limiting. Restrictions in nutrient availability early in the growing season can strongly influence weed-crop competition at later stages by suppressing the initial advantage of weeds’ rapid growth rates (Liebman & Davis, 2000). Dif-ferent fertilisation strategies have shown to affect early nutrient availability, among them are the placement of fertiliser in bands (Kirkland & Beckie, 1998), timing of fertilisation with split applications (Angonin et al., 1996) and the use of different nutrient sources such as manure, crop residues and compost (Liebman & Davis, 2000). Composted manure and crop residues from legumes show a similar effect of delayed nitrogen mineralisation since the nutrients are bound in organic material, requiring to be decomposed by microorganisms before made available (Deluca & Deluca, 1997; Varco et al., 1993).
Whether organic nutrient sources can reduce weed biomass by a slower release of available nutrients early in the season remains a debated issue. It is further im-portant to keep in mind that nutrients from organic sources may form a foundation for complementarity and reduce interspecific competition (Smith et al., 2010). Dyck et al. (1995) demonstrated that incorporation of leguminous green manure reduced weed biomass compared to mineral fertilisation. Additionally, Davis & Liebman (2001) presented evidence that certain weed species can be selectively suppressed by application of organic manure. Contradictory to their findings, Blackshaw et al. (2005) showed in 4-year trial that composted manure had a less suppressive effect on weed biomass and weed seedbank and reduced the wheat yield when compared to banded application of mineral fertiliser. Nitrogen accumulated with yearly appli-cations of composted manure, weed biomass increased over time since the slow re-lease of available nitrogen was carried over to the succeeding year but no infor-mation regarding shifts in weed species composition was provided. This indicates that no segregation of nutrient pools between weeds and crop occurred in the trial, given that the composition of the weed community remained the same.
2.3 Plant-microbe nutrient mediation in soil
Soil microorganisms constitutes the vast majority of all living organisms below-ground and display a diversity of functional roles (Bender et al., 2016). Bacteria and fungi together with nematodes, earthworms and arthropods are an integral part in supportive ecosystem services that can positively influence crop productivity by
regulating carbon and nutrient cycles, decomposition, soil formation and structure (Bommarco et al., 2013).
Competition for nutrients is not only restricted to interactions between plants, despite the flow of nutrients from soil via microorganisms to plants there is a strong initial competition for nutrients, particularly in the rhizosphere (Kuzyakov & Xu, 2013). There are temporal differences in nutrient acquisition between microorgan-isms and plants that follows the pattern of rapid utilisation of excessive carbon by microorganisms from root exudates. Microorganisms initially immobilise nutrients but the fast growth rate eventually leads to a depletion of carbon that starves the microorganisms around the roots. A flush of previously unavailable nutrients is then released and made accessible to plant root uptake. Thus, limited nutrient availability around the root stimulates the production of carbon compounds in the rhizosphere that in time yields available nutrients from dead microbial biomass. In search for available carbon substrates, microorganisms venture out of the rhizosphere to mine organic matter which in turn releases organically bound nutrients, constituting an influx of nutrients that can further feed the system. Key to this process are sapro-trophic fungi that contribute to soil formation and fertility by degrading soil organic material and mineralise organically bound nutrients (Kuzyakov & Xu, 2013.
At the center of the nitrogen cycle, diazotrophs are found fixating atmospheric N2 into plant available NH4+, either by Rhizobia in symbiotic association with
legu-minous plants or by non-associative free-living species such as Azospirillum (Ken-nedy et al., 1997). Plant availability and leaching of nitrogen is further regulated by soil microbes carrying out processes of nitrification and denitrification (Bender et al., 2016). Arbuscular mycorrhiza fungi (AMF) species can, apart from scavenge for and mediate phosphorous, intercept excessive flows of nutrients and reduce N2O
emissions derived from denitrification (Cavagnaro et al. 2015). Plant interactions with AMF are somewhat unspecific since a wide range of plant species successfully form associations with the fungi. It is more importantly the variation of the plants’ responses that differentiates the outcome and forms the basis for interspecific plant complementarity and facilitation (Eom et al., 2000).
These outlined soil biology processes, often overlooked in cultivated systems, collectively play a significant role in the productivity of plant ecosystems. Interfer-ence from land-use management commonly bypass and decrease the reliance on nutrient services, exchanging them with application of mineral fertilisers which in-creases the dependence on external fossil energy sources (Vitousek et al., 1997). Decreases in soil biodiversity, with lower abundance of functional groups, has been observed in regions across Europe with increasing land-use intensification (Tsiafouli et al., 2015). It has been argued that many functional groups may be re-dundant and that species richness as a measurement is less indicative of ecosystem functionality (Hunt & Wall 2002; Nielsen et al., 2011). Loss of soil biodiversity can
be compensated by other groups without altering the overall functionality of eco-systems, instead the community composition serves as stronger indicator for the function of soil processes. Wagg et al. (2014) has shown that organic decomposition and mediation of nutrients to aboveground biomass decline only when certain key groups such as mycorrhizal fungi or nematodes disappear. Ecosystem multifunc-tionality is to a certain extent positively correlated to high soil biodiversity and that the sensitivity to changes in function increases in simplified soil communities. This a condition usually met in intensively cultivated agricultural systems (Tsiafouli et al., 2015). A distinction can be made between the function of organic decomposi-tion, that remain less sensitive to changes in soil community composition and nar-row functions of mycorrhizal association, denitrification and nitrification that are more dependent on specific community composition (Schimel & Schaeffer, 2012). Soil organic carbon constitutes a key driver for soil microbial communities and a critical threshold for loss of ecosystem function has been suggested to exist in soils containing less than 2% soil organic carbon (Loveland & Webb, 2003).
2.4 Cover crops and intercropping
Cover crops are plants maintained as living ground cover that can be integrated in a cropping system either by cultivation between growing seasons or mixed with the main crop in an intercropping system (Hartwig & Ammon, 2002). The inclusion of cover crops offers substantial ecosystem services in agricultural systems with their capacity to reduce soil erosion and nutrient leaching as well as increasing soil organic matter. They further constitute an integral part in increasing the nutrient pool diversity by forming an additional source of organic nutrients that can be seg-regated between weed and crop (Deguchi et al., 2007; Li et al., 2007). Leguminous cover crops form associations with nitrogen-fixing Rhizobia-bacteria, constituting a source of organic nitrogen available to the succeeding crop when decomposed. (Hartwig & Ammon, 2002). Intercropping systems with leguminous species are known to overyield due to a more efficient use of nitrogen (Szumigalski & van Acker 2006). Although fixated nitrogen from symbiotic Rhizobia association is im-mobilised and restricted during the growth period to leguminous species, it indi-rectly reduces the competition for NO3- in soil. This results in increased nitrogen
availability for other non-leguminous species, known as the sparing effect (Szumi-galski & van Acker 2006). A study in intercropping with phosphorus limited condi-tions indicated that overyielding can be further explained by increased phosphorus availability (Li et al., 2007). The observed increase in phosphorus availability for the main crop was explained by interspecific interactions in the rhizosphere, leading
to the conclusion that phosphorus was directly facilitated and not partitioned due to differences in nutrient acquisition (Li et al., 2007).
Cover crops can influence the weed abundance negatively by occupying the same niche space as the weed community and replace weed species (Médiène et al., 2011). Germination of weed seeds can be suppressed by desiccated cover crops that intercept light and release inhibitory exudates of allelopathic compounds (Phatak, 1992). Competition from living and established cover crops can suppress the weed biomass through light, water and nutrient competition (Den Hollander et al., 2007). However, leguminous cover crops receive their nitrogen needs from Rhizobia sym-biosis and do not compete for this nutrient with weeds. The lack of selective com-petition by cover crops against specific plant species remains an inherent trade-off. Just as a cover crop may compete well against weed populations it can exert an equally strong negative effect on the harvested main crop, causing yield losses when grown simultaneously. A crucial aspect to this is the timing of emergence where the cover crop needs to be established in time to compete against early emerging weeds (Buhler et al., 2001). To avoid unwanted competition, the peak growth of the cover crop should be managed to not coincide with the time when the main crop is sensi-tive to competition (Bergkvist, 2003; Médiène et al., 2011). The significance of cover crops in weed competition is inconclusive and to some extent related to grow-ing conditions. Weed-cover crop competition is mainly determined by the biomass production ability of the cover crop and hence limited by the climatic conditions. Hartwig & Ammon (2002) reported that undersowing competitive clover species in corn can provide sufficient weed control, comparable to herbicide treatments. When growing and incorporating cover crops between crop seasons red clover showed a similar weed suppressive effect while oilseed radish and cereal rye increased weed biomass (Hill et al., 2016).
2.5 Weed flora and diversity
The choice of including two model weed species in this study, one morphologi-cally resembling the crop (A. fatua) and one different from the crop (M. perforata) is motivated by the tenet of increased weed diversity as a prerequisite for niche seg-regation (Smith et al., 2010). From a simplistic agronomical point of view, the dras-tic decline in weed species diversity seen over the last 50 years may appear as a feat of success in limiting the number of weed species present in field (Storkey & Neve, 2018).
Still, the remaining weed species in field are often highly competitive and con-tinue to limit crop yields. They have adapted to dominating crop rotations by retain-ing traits that are tolerant to control measures in short rotations and efficient at ac-quiring abundant nutrient resources (Gaba et al., 2016). Contrary to this, findings imply that high weed species richness is uncorrelated to more abundant weed bio-mass and may potentially reduce the overall weed-crop competition in field. This is corroborated by studies showing that an increased diversity of weed species may either reduce crop yield losses (Storkey & Neve, 2018) or have no negative effect on crop performance (Pollnac et al., 2009).
A weed community with species that possess a variety of functional traits occupy segregated niches that allow a spatio-temporal partitioning of resources (Silvertown, 2004). This functional differentiation, conceptualised as the complementarity effect, acts as a stabilising factor against the establishment of dominant species that in iso-lation might become strong crop competitors (Hooper et al., 2005). In such a diverse system, interspecific competition for the same resources diminishes. However, it requires an environment that contains elements for niche segregation, such as dif-ferent resource pools that are mediated separately to specific species (Smith et al., 2010). The diversity of a weed community can further be used as an indicator of the stability of the agricultural system and its breadth of niches (Fig. 1) (Storkey & Neve, 2018). It indirectly reveals the management history and the selection pressure from herbicide and fertilisation use, crop rotation and soil cultivation practices. Weed species diversity is consequently both affecting the competitive pressure in field and remains an emergent response to the management of the system (Hooper et al., 2005).
3.1 Experimental design
This experiment was conducted in a greenhouse at Ultuna, Swedish University of Agricultural Sciences. Loamy sand with <0.5% organic carbon and 5 kg N ha-1
(0.13 mg NO3-N 100g-1 dry substance) was used as base substrate for mixing three
soil substrates with different diversities of nutrient sources (Table 1). The three ni-trogen substrates used in the experiment were inorganic NPK fertiliser (YaraMila
PROMAGNA, 4.4% NO3-N, 6.6% NH4-N, 4.6% P and 17.6% K), cow manure
con-taining 4.9 kg N ton-1 and compost containing 9.11 kg N ton-1 (Table 1).
The target amount of total nitrogen in all soil substrates was 50 kg ha-1, with the
base substrate included. This constitutes 50% of recommended nitrogen application in spring cereals (Jordbruksverket, 2019) and is motivated by a moderate nutrient restriction necessary to study the effects of nutrient competition in a limited growth period. Substrate A was mixed with 45 kg N ha-1 inorganic fertiliser (YaraMila
PROMAGNA), substrate B with 20 kg N ha-1 cow manure and 25 kg N ha-1
inor-ganic fertiliser and substrate C with 20 kg N ha-1 cow manure and 25 kg N ha-1
compost (Table 2). Due to experimental error in the compost nitrogen analysis, soil substrate C was mixed with an insufficient amount of compost and ended up with half of the intended nitrogen content (Table 1). The aim with the soil substrates were changed to compare soil substrates A and B in regard to difference in nitrogen qual-ity and A and C to compare the difference in nitrogen quantqual-ity. Although a differ-ence in quality still existed between A and C it was assumed that the quantitative difference would have a stronger effect, obscuring the differences in quality. The inorganic fertilizer pellets were ground before incorporated in the top 2 cm soil layer to avoid an uneven distribution. Added amounts of nitrogen were calculated from pot surface area and no additional fertiliser was applied during the growth period. The measurements of the pots used in the experiment were 9 L, 27 cm in diameter
and 18 cm in height. Each pot contained 14 kg of the prepared soil substrates and were placed in the greenhouse to settle during a week. Samples of each mixed soil substrate were collected and total nitrogen content analysed. 3 replicates for all soil substrate were prepared. The pots were placed in a completely randomised design, covering the whole greenhouse. A temperature gradient existed in one direction with lower temperatures close to windows situated along one side of the greenhouse, this was accounted for by measuring the individual pot distances to the windows. The photoperiod in the greenhouse was set to 12 h light at 200 μE m2 s1 and the day/night
temperature was 25°C/10°C. The total amount of pots in the experiment were 162. 3 soil substrates * 2 weed species (A. fatua and M. perforata) * 9 densities * 3 rep-licates = 162.
Table 1. Nitrogen balance from analysis of mixed soil substrates A, B and C. Nitrogen forms measured
per 100 g dry weight (DW). A-B was compared in regard to nitrogen quality and A-C in regard to nitrogen quantity.
Soil substrate NO3-N (mg 100g-1 DW) NH4-N (mg 100g-1 DW) N-min (kg ha-1)
A (NPK) 0.78 0.53 111.0
B (NPK, cow manure) 0.70 0.47 99.4
C (Cow manure, compost) 0.56 0.08 54.5
Table 2. Nitrogen content analysis of organic fertilisers added to soil substrates B and C. Nitrogen
content measured from dry substance (DS).
Substrate DS (%) N-min (kg t-1 DS) NH4-N (kg t-1 DS)
Cow manure 26.0 4.90 1.6
Compost 38.5 9.11 0.6
Germination rate was derived from pre-germinating 100 seeds of each species in trays filled with soil base substrate. The trays were put in the greenhouse and wa-tered daily. Germinated seeds were counted and divided by 100. All pots were seeded with 28 seeds of A. sativa, the target density was 20 plants per pot. A. sativa seeds were sown in two rows with 12 cm row spacing at a depth of 3 cm. T. resupi-natum was seeded together with one weed species, either A. fatua or M. perforata, in a response model design with totally 9 plant density combinations (Fig. 2, left). The target plant densities for cover crop and weeds, both separate and mixed, were 150, 300, 600 plants m-2. When unmixed, T. resupinatum was sown with 11, 21 and
42 seeds, A. fatua with 18, 34 and 68 seeds and M. perforata with 32, 58 and 116 seeds per pot. Both cover crop and weed seeds were placed randomly in the pots. A. fatua was sown at a depth of 3 cm, the smaller seeds of T. resupinatum and M. perforata were sown at 0,5 cm. 0,5 kg of soil was added on top after sowing and the pots were watered daily with tap water. One week after sowing, A. sativa was
thinned to 20 plants per pot and the remaining species to their respective target den-sities. When studying the effect of increasing A. fatua plant densities against the fixed density of A. sativa, an additive experimental design was used (Fig. 2, right).
Fig. 2. Experimental designs used in this study. Surface response model (left) takes intra- and
inter-specific plant-plant competition into account, the cover crop (Trifolium resupinatum) and weed species (Avena fatua and Matricaria perforata) were grown mixed and unmixed. The additive design (right) were used to study the competitive effect from weed species by increasing densities of a competitor against the target species (Avena sativa).
3.2 Measurements
Non-destructive measurements were made at a weekly interval during a period of five weeks after emergence (Table 3). Five plants were sampled randomly from each pot for the measurements. Development stage was assessed for all species ac-cording to the BBCH scale (Meier, 1997). Shoot height was measured for A. sativa and A. fatua to determine the growth rate over time.
Measurement of chlorophyll content in the youngest developed leaves was made with a SPAD meter, measuring the index of relative chlorophyll content between -9.9 to 19-9.9, as an indicator for nitrogen accumulation in A. sativa and A. fatua.
Above- and belowground biomass of the four plant species was harvested 42 days after sowing (DAS) (Table 3). Shoots and roots were separated for all species except A. sativa and A. fatua since their roots grew into each other and became in-separable. The biomass was then dried at 80°C for 48h before weighing.
Table 3. Measurements made of the model plants Avena sativa, Trifolium resupinatum, Avena fatua
and Matricaria perforata in the greenhouse experiment at specific days after sowing (DAS). Non-de-structive measurements of shoot height (mm), development stage (BBCH) and chlorophyll content (SPAD) were done during growth period. The biomass dry weight (g) was weighed after harvest.
3.3 Data analysis
3.3.1 Surface response interaction analysis
A generalised linear mixed model (GLMM) using the glmer function in R (Bolker et al., 2009) was used to analyse the effect of (1) T. resupinatum density on A. sativa and A. fatua root and shoot biomass and (2) M. perforata density on A. sativa root and shoot biomass.
The model included soil substrate and weed or cover crop plant density as fixed factors and pot distance to windows as well as replicate numbers as random factors. Interactions between the fixed factors were analysed with a one-way analysis of variance test (Anova). Least square means of A. sativa shoot biomass (g) were cal-culated for each fixed factor level. Marginal R2 was calculated for each model, a
Species Parameters Measurements (DAS)
A. fatua treatment
A. sativa Shoot and root biomass (g DW) 42-43
Shoot height (mm) 8, 15, 22, 29, 35, 42
BBCH 8, 15, 22, 29, 35, 42
Chlorophyll content (SPAD) 35, 42
T. resupinatum Shoot and root biomass (g DW) 42-43
BBCH 8, 15, 22, 29, 36, 42
A. fatua Shoot biomass (g DW) 42-43
Shoot height (mm) 15, 22, 29, 35, 42
BBCH 15, 22, 29, 35, 42
Chlorophyll content (SPAD) 35
M. perforata treatment
A. sativa Shoot and root biomass (g DW) 41-42
Shoot height (mm) 8, 15, 22, 28, 36, 41
BBCH 8, 15, 22, 28, 36, 41
Chlorophyll content (SPAD) 36, 41
T. resupinatum Shoot and root biomass (g DW) 41-42
BBCH 8, 15, 22, 29, 36, 41
M. perforata Shoot and root biomass (g DW) 41-42
value that estimates the amount of variation that is explained by fixed factors (Nak-agawa & Schielzeth, 2013). Further, intra-class correlation coefficients (ICC) were determined, representing the amount of variation explained by random factors in hierarchical data (Nakagawa et al., 2017).
3.3.2 Nitrogen quality and quantity analysis
The effect of soil nitrogen quality and quantity on A. sativa root and shoot bio-mass with and without A. fatua competition was analysed with GLMMs using soil substrates as fixed factor. The effect was also studied on A. fatua shoot biomass. Pair-wise comparison of soil substrate A and B was made for nitrogen quality anal-ysis and soil substrate A and C for nitrogen quantity analanal-ysis.
A. sativa and A. fatua shoot nutrient use efficiency (NUE) per pot was calculated accordingly:
𝑆𝑆ℎ𝑜𝑜𝑜𝑜𝑜𝑜 𝑁𝑁𝑁𝑁𝑁𝑁 (𝑔𝑔/𝑁𝑁𝑁𝑁𝑁𝑁𝑁𝑁 𝑘𝑘𝑔𝑔 ℎ𝑎𝑎−1) = (𝐵𝐵/𝑁𝑁) (1) where B is the shoot biomass (g) and N the N-min (kg ha-1) content of the
respec-tive soil substrates. The shoot NUE was then analysed with a GLMM using soil substrate as fixed factor. Pot distance to windows, replicate numbers and T. resupi-natum density were included as random factors. The output of the GLMMs was analysed according to the procedure in surface response interaction analysis.
3.3.3 Rectangular hyperbola model, additive design
The following analyses considered the A. fatua treatment as an additive design with increasing A. fatua densities against a fixed A. sativa density (Fig. 2, right). The tested hypotheses were H1 and H2.
Harvested A. sativa shoot biomass (g) from each pot was converted into yield loss (%) caused by A. fatua competition that was calculated separately for each soil substrate:
𝑌𝑌𝑌𝑌 (%) = �𝑀𝑀 − 𝐵𝐵𝑀𝑀 � ∗ 100 (2)
where M is the mean of A. sativa shoot biomass (g) per pot, derived from all pots without A. fatua competition. B denotes the mean of A. sativa shoot biomass (g) from individual pots in competition with A. fatua. These calculations were made separately for each soil substrate in order to make them comparable since M for each soil substrate differed. The calculated yield loss was plotted in relation to A. fatua
density which indicated that a rectangular hyperbola function could be fitted to the data (Cousens, 1985):
𝑌𝑌𝑌𝑌 = � 𝐼𝐼 ∗ 𝑥𝑥
1 + �𝐼𝐼𝐴𝐴� ∗ 𝑥𝑥� ∗ 100 (3)
where I describes the yield loss increase (%) per unit of weed plant density, x, at the point where weed density approaches 0. A describe the yield loss increase (%) per unit of weed plant density at the point where weed density approaches ∞. The rectangular hyperbola model was fitted with the nls function in R to estimate I and A values corresponding to the yield loss data (Oliveira et al., 2018). One full model and three reduced models were produced (Table 4) and then compared using Akaike’s information criterion, bias-corrected for smaller sample sizes (AICc;
Equa-tion 4), to test statistically significant differences for I and A between the soil sub-strates (Hurvich & Tsai, 1991).
Table 4. Full and reduced rectangular hyperbola models with estimated parameters explaining A. sativa shoot biomass yield loss (%) at low weed densities (I) and high densities (A) for soil substrates
A, B and C.
Rectangular hyperbola model Estimated parameters
Full model I and A for each soil
Reduced 1 One I and A for all soils
Reduced 2 One I for all soils, A for each soil
Reduced 3 I for each soil, one A for all soils
𝐴𝐴𝐼𝐼𝐶𝐶𝑐𝑐 = −2 log(𝑙𝑙) + 2𝐾𝐾 ∗ (𝑁𝑁 − 𝐾𝐾 − 1)𝑁𝑁 (4)
l is the likelihood function, K the number of estimated parameters (A. fatua den-sity and soil substrate) and n the sample size. The best model is the one with the lowest AICc value, according to the criterion, and this was analysed with the
AIC-modavg package in R.
Goodness-of-fit was used to test the accuracy of the models by calculating the root mean squared error (RMSE):
where RSS is the residual sums of squares, n the number of data points and p the number of model parameters (Mayer & Butler, 1993). Another rectangular hyper-bola model was constructed with A. fatua shoot biomass as fixed factor according to aforementioned procedure.
3.3.4 Three parameter logistic growth model
A. sativa and A. fatua shoot height development was studied over time to inves-tigate the effect of increasing plant density as well as soil nitrogen quality and quan-tity between the species. A three parameter logistic growth model was constructed with the drm function in R (Ritz & Streibig, 2005) to study the A. sativa and A. fatua shoot height dynamics over time:
𝑓𝑓�𝑧𝑧, (𝑏𝑏, 𝑑𝑑, 𝑒𝑒)� =1 + exp {𝑏𝑏(log(𝑧𝑧) − log(𝑒𝑒))}𝑑𝑑 (6)
where z represents days after sowing (DAS) and parameter e the number of days to reach 50% of final A. sativa shoot height (mm) at harvest date 42 DAS. Parameter b represent the slope around e and d the maximum A. sativa shoot height (mm). One logistic curve of A. sativa shoot height with parameters b, d and e was fitted for each of the five A. fatua densities to determine the competitive effect on A. sativa height development.
In order to compare the b slopes between different A. fatua densities, the A. sa-tiva height was normalised accordingly:
𝑙𝑙𝑜𝑜𝑔𝑔 �𝑑𝑑 − 𝑦𝑦𝑦𝑦 � = 𝑏𝑏(log(𝑧𝑧) − log(𝑒𝑒)) (7)
where d represents the maximum shoot height and y the measured shoot height at respective points in time. The normalised shoot height attained a value between 0-1. Another three parameter logistic model was fitted using the normalised shoot height where the final height at 42 DAS was fixed to 1 in order to make the b pa-rameter comparable between different A. fatua densities and soil substrates.
Final A. sativa shoot height derived from the unnormalised model was analysed with a GLMM using soil substrate and A. fatua density as fixed factors. Pot distance to windows as well as replicate numbers were included as random factors.
4.1 T. resupinatum and M. perforata interaction
The competitive effect of T. resupinatum and M. perforata at four densities was studied on A. sativa root and shoot biomass production. T. resupinatum competition towards A. fatua shoot biomass was further investigated to determine its effect on the weed.
There was no evidence of any competitive effect from both T. resupinatum and M. perforata at densities 75, 150, 300 and 600 plants m-2 on A. sativa shoot or root
biomass production (Fig. 3). There was a significant difference between A. sativa root and shoot biomass production at the M. perforata density of 75 plants m-2 (Fig.
3b), indicating that the allocation of assimilate to shoots were greater at this partic-ular density. The same effect can be observed at T. resupinatum density of 75 plants m-2 (Fig. 3a), however, differences in shoot and root biomass did not occur at any
other M. perforata or T. resupinatum density. Low R2 values in both analyses
indi-cate that the fixed factors T. resupinatum and M. perforata density explained very little variation in A. sativa shoot biomass. The random factors Window distance and Replicate numbers explained little variation as well in the M. perforata analysis (Appendix, Table 2) and no variation at all in T. resupinatum analysis (Appendix, Table 1).
Fig. 3. Effect of (a) Trifolium resupinatum density (plants m-2) on Avena sativa shoot and root biomass (g) production at 42 days after sowing (DAS). Effect of (b) Matricaria perforata density (plants m-2) on A. sativa shoot and root biomass (g) production at 42 DAS. The lower and upper hinges correspond to the first and third quartiles and the line inside the boxes represent the median. ICC corresponds to intra-class correlation coefficients of the random effects Window distance and Replicate.
T. resupinatum density had no effect on A. fatua shoot biomass when both spe-cies were mixed at densities 150 and 300 plants m-2 (Fig. 4) The random factors
window distance and replicate numbers explained no variation in A. fatua shoot bi-omass analysis (Appendix, Table 3), consequently, the plant density of T. resupina-tum was excluded as a fixed factor in the following analyses with A. fatua and A. sativa.
Fig. 4. Effect of Trifolium resupinatum density (plants m-2) on Avena fatua shoot biomass (g) produc-tion at 42 days after sowing. Mean shoot biomass (g) in pots with T. resupinatum (c) and A. fatua (wo). Error bars signifies the standard deviation of the least square means.
R2: 0.179 ICC (Window): 0.011 ICC (Replicate): 0.002 R2: 0.108 ICC (Window): 0 ICC (Replicate): 0 R2: 0.851 wo75-c75 wo150-c150 wo150 wo300-c300 wo300 wo600
The germination of M. perforata was uneven and most pots did not reach the target densities. The first M. perforata seedlings started to emerge 4-6 days after A. sativa and T. resupinatum but the overall M. perforata emergence was protracted and extended to weeks after this. A. sativa can be considered to be the sole crop in the M. perforata treatment, uninfluenced by both M. perforata and T. resupinatum that were treated as random factors in the consequent analyses.
4.2 Influence of soil nitrogen quality and quantity on A.
sativa and A. fatua biomass
Effects on A. sativa and A. fatua biomass growth due to differences in soil nitro-gen quality was investigated between soil substrate A and B. Effects from differ-ences in soil nitrogen quantity were studied between soil substrate A and C. Soil A and B contained similar amounts of NO3-N and NH4-N (mg 100g-1 DW) (Table 1),
A was selected to represent the higher nitrogen fraction in all subsequent quantity analyses. A. sativa and A. fatua nutrient use efficiency (NUE) was studied to inves-tigate if soil quality or quantity as well as A. fatua density had an effect on the spe-cies biomass accumulation and shoot allocation.
4.2.1 Nitrogen quality
The response due to changes in soil quality was greater for A. sativa compared with A. fatua. A. sativa, when competing with A. fatua, responded with higher shoot biomass production in soil substrate A compared to B (Fig. 5; Appendix, Table 4). A. sativa shoot biomass in A and B was inverted when A. fatua increased in plant density, but no statistically significant interaction between soil substrates and A. fatua density was found (Appendix, Table 4). The fixed factors explained the vari-ation to some extent (R2: 0.403) as well as the random factors Window distance
(ICC: 0.4048) and Replicate number (ICC: 0.1478). There was no interaction be-tween Window distance and Replicate (Appendix, Table 4). T. resupinatum density as random factor explained no variation.
Fig. 5. A trend of higher Avena sativa shoot biomass (g) with increasing Avena fatua density (plants
m-2) in soil substrate A (NPK, N-min = 111.0 kg ha-1) compared to B (cow manure and NPK, N-min = 99.4 kg ha-1) at 42 days after sowing. Error bars signify the standard deviation of the least square means. ICC corresponds to intra-class correlation coefficients of the random effects Window distance and Replicate.
A. sativa shoot biomass production in monoculture was not affected by the qual-itative differences between soil substrate A and B (Appendix Fig. 1; Table 5). Fur-ther, the chlorophyll content in A. sativa shoots was not affected by the soil quality when competing with A. fatua (Appendix, Fig. 2; Table 6). Higher nitrogen pool diversity present in soil B did not increase shoot biomass production, shoot height or chlorophyll content in A. sativa.
A. fatua shoot biomass was not affected by the qualitative differences between soil A and B (Appendix Fig. 3; Table 7).
4.2.2 Nitrogen quantity
A. sativa shoot and root biomass production in monoculture increased with higher nitrogen levels present in soil A compared to soil C (Fig. 6). There was a significant difference in both root and shoot biomass between soil A and C (Appen-dix, Table 8, 9) but the low R2 values in both analyses show that very little of the
variation could be explained by the soil substrates as fixed factor (Fig. 6). Window distance as random factor explained more variation (ICC: 0.1554) in the shoot anal-ysis (Fig. 6a).
R2: 0.403
ICC (Window): 0.4048 ICC (Replicate): 0.1478
Fig. 6. Avena sativa (a) shoot and (b) root biomass (g) increased with higher nitrogen quantity in soil
substrate A (NPK, N-min = 111.0 kg ha-1) compared to C (cow manure and compost, N-min = 54.5 kg ha-1) at 42 days after sowing. The lower and upper hinges correspond to the first and third quartiles and the line inside the boxes correspond to the median. ICC corresponds to intra-class correlation coefficients of the random effects Window distance and Trifolium resupinatum density.
A. sativa shoot biomass production in competition with A. fatua was higher in soil A compared to C across all A. fatua plant densities (Fig. 7; Appendix Table 10). Most of the variation was explained by the fixed factors (R2: 0.491) although all
random factors had some influence (Fig. 7).
A. fatua shoot biomass was not affected by differences in nitrogen quantity (Ap-pendix, Fig. 4; Table 11). The response to changes in soil quantity was greater for A. sativa compared with A. fatua.
Fig. 7. A trend of higher Avena sativa shoot biomass (g) in soil substrate A (NPK, N-min = 111.0 kg
ha-1) compared to C (cow manure and compost, N-min = 54.5 kg ha-1) across all Avena fatua densities (plants m-2) at 42 days after sowing. Error bars signify the standard deviation of the least square means. ICC corresponds to intra-class correlation coefficients of the random effects Window distance,
Trifo-lium resupinatum density and Replicate.
R2: 0.070
ICC: (T. resupinatum density): 0.0359 R2: 0.066
ICC: (Window): 0.1554
R2: 0.491
ICC (Window): 0.1365
ICC (T. resupinatum density): 0.0946 ICC (Replicate): 0.0819
4.2.3 Nutrient use efficiency
A. sativa shoot NUE was higher in the nitrogen limited soil substrate C compared to A (Fig. 8a; Appendix, Table 12). A high R2 (0.725) indicated that the variation in
A. sativa shoot NUE was well explained by the soil substrates as fixed factors (Fig. 8a). A. fatua shoot NUE showed a tendency to increase in nitrogen limited soil sub-strate C compared to A (Fig. 8b; Appendix, Table 12). There was a statistically sig-nificant difference between the soil substrates (p <0.001) but the variation of A. fatua shoot NUE was not sufficiently explained by soil substrates as fixed factor (R2: 0.110). The random factor T. resupinatum density had greater influence on the
variation (ICC: 0.4018). The comparison of soil substrate A and C contains elements of both quantitative and qualitative differences but the difference in nitrogen content can is assumed to be of a greater influence than the quality. This further underline that A. sativa is more responsive to changes in nitrogen quantity compared with A. fatua.
Fig. 8. (a) Avena sativa shoot nutrient use efficiency (g kg-1 ha-1 N; NUE) responded to changes in nitrogen quantity at 42 days after sowing (DAS). (b) Avena fatua shoot NUE (g kg-1 ha-1 N) was unaf-fected by soil nitrogen quality and quantity at 42 DAS. Soil substrate C (cow manure and compost, N-min = 54.5 kg ha-1) compared with A (NPK, N-min = 111.0 kg ha-1) and B (cow manure and NPK, N-min = 99.4 kg ha-1). The lower and upper hinges correspond to the first and third quartiles and the line inside the boxes correspond to the median. ICC corresponds to intra-class correlation coefficients of the random effects Trifolium resupinatum density and Replicate.
4.3 A. sativa yield loss by A. fatua
The competitive ability of A. fatua against A. sativa was studied with an additive experimental design where A. fatua density increased towards a fixed A. sativa den-sity. The effect of nitrogen quality on A. sativa shoot yield loss (%) from A. fatua competition was studied between soil substrate A and B and the effect nitrogen quantity was studied between soil substrate A and C. The yield loss of A. sativa
R2
: 0.725
ICC (T. resupinatum density): 0.2108 ICC (Replicate): 0.0063
R2: 0.110
shoot biomass was analysed with two rectangular hyperbola models, one using A. fatua density and the other A. fatua shoot biomass as fixed factors. In the models, the I parameter represents the yield loss (%) per unit of increasing A. fatua density or shoot biomass at the point where these factors approach 0. This yield loss adheres to situations where the weed starts to appear in field. The A parameter represents the yield loss (%) per unit of increasing A. fatua density or shoot biomass at the point where A. fatua density approaches ∞. This yield loss applies to situations where the weed is dominating at high densities in field.
When comparing the full and reduced rectangular hyperbola models the reduced model 3, with separate I values for each soil and one A value for all soils, resulted in the lowest AICc value for both A. fatua density and shoot biomass (Table 5). This
indicated that there was a significant difference between soil substrates for parame-ter I but not A. The goodness-of-fit test with Root mean square error (RMSE) fol-lowed the same trend, the reduced model 3 had the lowest value and was the most accurate model to explain A. sativa shoot yield loss (Table 5). In reduced model 3 model, four parameters were estimated, three I parameters for each soil substrate and one A for all soil substrates.
Table 5. Selection of rectangular hyperbola models explaining Avena sativa shoot biomass yield loss
(%) due to Avena fatua density (plants m-2) and shoot biomass (g) based on biased-corrected Akaike’s
information criterion (AICc) and root mean square error (RMSE). Parameter I correspond to A. sativa
yield loss (%) at low A. fatua densities and parameter A at high A. fatua densities.
A. fatua density A. fatua shoot biomass
Model Parameters AICc RMSE AICc RMSE
Full model I and A for each soil
613.24 1.178 613.07
Reduced 1 One I and A for all soils
609.16 1.186 404.14 1.443
Reduced 2 One I for all soils
A for each soil
609.11 1.167 400.79 1.363
Reduced 3 I for each soil, one A for all soils
608.73 1.164 399.75 1.350
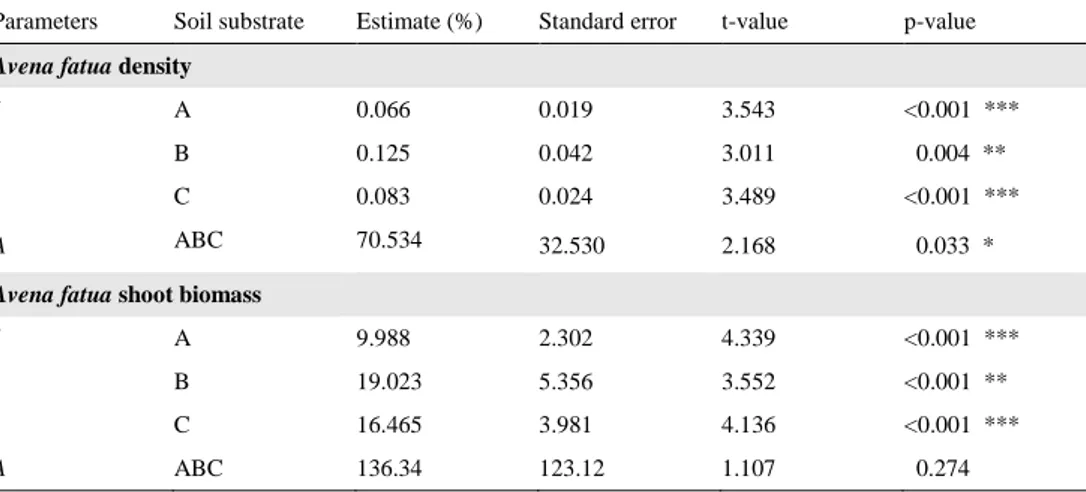
The yield loss of A. sativa shoot biomass increased with higher A. fatua plant densities and A. fatua shoot biomass (Fig. 9). At low A. fatua densities and shoot biomass (I), A. sativa shoot yield loss (%) was higher in soil B with higher nitrogen pool diversity compared to soil A, according to estimates from the reduced 3 rec-tangular hyperbola model (Fig. 9; Table 6). When comparing nitrogen quantity at low A. fatua densities and shoot biomass (I), A. sativa shoot yield loss (%) was higher in soil C with lower nitrogen content compared to soil A (Fig. 9; Table 6). At high A. fatua densities and shoot biomass (A) neither nitrogen quality or quantity
affected A. sativa shoot yield loss (%), the estimated A parameter was the same for all soil substrates (Table 6).
Fig. 9. Increasing (a) Avena fatua density (plant m-2) and (b) A. fatua shoot biomass (g) caused a higher
Avena sativa shoot biomass yield loss (%) at 42 days after sowing. Soil substrate B (cow manure and
NPK) showed the highest yield loss when A. fatua density and shoot biomass increased with one unit from 0 (I). No differences between soils were found when A. fatua density and shoot biomass ap-proached infinity (A).
Table 6. Differences in Avena sativa yield loss (%) between soil substrates at low Avena fatua densities
(plants m-2) and shoot biomass (g) at 42 days after sowing (DAS), denoted with parameter I. No
dif-ference in A. sativa yield loss (%) between soil substrates at high A. fatua densities (plants m-2) and
shoot biomass (g) at 42 DAS, denoted with parameter A. Parameter I and A estimated with reduced 3 rectangular hyperbola model.
Parameters Soil substrate Estimate (%) Standard error t-value p-value
Avena fatua density
I A 0.066 0.019 3.543 <0.001 ***
B 0.125 0.042 3.011 0.004 **
C 0.083 0.024 3.489 <0.001 ***
A ABC 70.534 32.530 2.168 0.033 *
Avena fatua shoot biomass
I A 9.988 2.302 4.339 <0.001 ***
B 19.023 5.356 3.552 <0.001 **
C 16.465 3.981 4.136 <0.001 ***