Faculty of Natural Resources and Agricultural Sciences
Occurrence and fate of organic
micropollutants (OMPs) in Lake Mälaren
Anna-Lena Rehrl
Master’s Thesis in Environmental Science • 30 ECTS
EnvEuro • Environmental Sciences in EuropeDepartment of Aquatic Sciences and Assessment Uppsala, 2019
Occurrence and fate of organic micropollutants (OMPs) in Lake
Mälaren
Anna-Lena Rehrl
Supervisor: Oksana Golovko, SLU Uppsala,
Department of Aquatic Sciences and Assessment Assistant supervisor: Ao.Univ.Prof Andreas Paul Loibner, BOKU Wien,
Institute of Environmental Biotechnology Examiner: Lutz Ahrens, SLU Uppsala,
Department of Aquatic Sciences and Assessment
Credits: Level: Course title: Course code:
Programme/education:
Course coordinating department:
Place of publication: Year of publication: Cover picture: Online publication: Keywords: [30] credits
Second cycle, A2E
Independent Project in Environmental Science EX0431
EnvEuro – Environmental Sciences in Europe Department of Aquatic Sciences and Assessment
Uppsala 2019
Anna-Lena Rehrl
https://stud.epsilon.slu.se
multi-residue method, UPLC-MS/MS, SPE, occurrence, organic micropollutants, pharmaceuticals, Lake Mälaren, surface water, seasonality
The main objective of this study is to investigate the occurrence and fate of organic micropollutants (OMPs) in surface water in Lake Mälaren over one year, including their seasonal variations, correlations between compounds, spatial and vertical distri-bution. The water samples were enriched with solid phase extraction (SPE) and sub-sequently analyzed by ultra-high pressure liquid chromatography tandem mass spec-trometry (UPLC-MS/MS). The applied multi-residue method, consisting of OMPs with a wide range of physico-chemical properties was earlier optimized and then as-sessed regarding its performance. From 122 tested target compounds, 74 obtained a good relative recovery (60-145%) and 50 were detected at least once above limit of quantification (LOQ), which ranged from 0.010 and 10 ng/L. The highest detected concentration was found for valproic acid (2600 ng/L) and lamotrigine (140 ng/L). The locations Ekoln and Västeråsfjärden were identified to be most affected by OMPs pollution. Seasonal patterns were observed for numerous OMPs and 7 com-pounds occurred without seasonal fluctuations. Only a few vertical distribution pat-terns and concentration gradients were observed, for instance, the deepest sampling depth (30m) from Ekoln showed considerable higher concentrations than the upper sampling depths in February. A strong positive correlation was found for carbamaz-epine and lamotrigine, but also for other OMPs. Two industrial chemicals, tolyltria-zole and tris(2-butoxylethyl)phosphate showed very good analytical performance pa-rameters and were detected frequently and it is recommended to incorporate these compounds more regularly in future analysis. No correlations between water chem-istry were observed. To the best of our knowledge, this study is the first one to report the occurrence and distribution of OMPs representing such wide physico-chemical properties, including industrial chemicals, in a Swedish lake.
Keywords: multi-residue method, UPLC-MS/MS, SPE, occurrence, organic
mi-cropollutants, pharmaceuticals, Lake Mälaren, surface water, seasonality
It’s a matter of common knowledge, that most of our surface water resources are not as clean as they should be. Organic micropollutants (OMP) constitute a group of sub-stances which are more and more of emerging concern due to their ubiquity in the environment and their potential toxicological hazard. Usually the concentrations of these compounds are very low ranging from ng/L to µg/L, which can be also ex-pressed as parts per trillion (ppt) and parts per billion (ppb), respectively. For pur-poses of clarity one ppm is for example one single black sheep among one billion sheep. The unique properties of OMPs can lead to negative effects for aquatic organ-isms, plants and humans in even such small concentrations. In general, OMP encom-pass many different kinds of substances such as pharmaceuticals, personal care prod-ucts, pesticides, perfluoroalkyl substances (PFASs), parabens and industrial chemi-cals. Usually the primary source for those substances to enter the water are effluents of wastewater treatment plants, which are simply not able to remove these kinds of substances effectively. The information about the occurrence of substances in a spe-cific surface water body is important to understand the behavior of these substances, potential hotspots where most of them can be found and to identify priorities for fu-ture actions. The subject of this study was Lake Mälaren, which is the third biggest lake in Sweden and the major drinking water source in the Stockholm area. Water samples from eleven different sampling locations and eight different sampling months (from April ’17 to April ’18) were analyzed regarding 50 different OMPs that are widely used in large amounts and are known for possible negative effects in the environment.
All detected concentrations were below estimated acute toxic concerns, however not much is known about long-term subtle negative effects and effects when sub-stances are interacting with each other. Some OMPs were found regularly to almost constant concentration levels during the entire year, while most of the OMPs show seasonal fluctuations which can be traced back to different usage rates (e.g. antide-pressants, are a group of pharmaceuticals which are consumed more often in the win-ter time than during summer) and different elimination rates of OMPs at the wastewater treatment plan during the year. The sampling locations Ekoln and Väs-teråsfjärden are most polluted which is due to the close proximity to densely popu-lated areas and the outlet of a wastewater treatment plant. In February the highest concentrations were found at the bottom of the lake at Ekoln (30 m sampling depth), which assumingly causes a higher risk of exposure for those fish which stay there during winter time. To the best of our knowledge, some industrial chemicals were never analyzed before in Lake Mälaren and surprisingly, two of them (tolyltriazole and tris(2-butoxylethyl)phosphate) showed very similar patterns of occurrence com-pared to, for example, the two pharmaceuticals carbamazepine and lamotrigine,
which are frequently analyzed and detected in the water. Knowing this, helps to as-sess the risk that these two industrial chemicals pose. The findings of this study con-tribute to a better understanding of the behavior of OMPs in surface water and pro-vide a sound basis for further research.
List of tables 7
List of figures 8
Abbreviations 10
1 Introduction 13
1.1 Background 13
1.1.1 Occurrence of OMPs in the aquatic environment 14 1.1.2 Sources, pathways and removal efficiency 15
1.1.3 Natural attenuation process 16
1.2 Limitations of the study 16
2 Materials and Methods 17
2.1 Chemicals and consumables 17
2.2 Selected compounds 18
2.3 Study site and sample collection. 18
2.4 Sample preparation 20
2.5 Instrumental analysis 21
2.6 Method performance 22
2.7 Statistical analysis 24
3 Results and Discussion 25
3.1 Method performance 25
3.2 Occurrence of OMPs 31
3.2.1 OMP concentrations 31
3.2.2 Spatial distribution 34
3.2.3 Seasonal variations 37
3.2.4 Vertical distribution in the water column 43
3.3 Correlations between OMPs 44
3.4 Correlations between OMPs and water chemistry of Lake Mälaren 48
4 Conclusion and outlook 49
References 51
Acknowledgements 59
Appendix 1 61
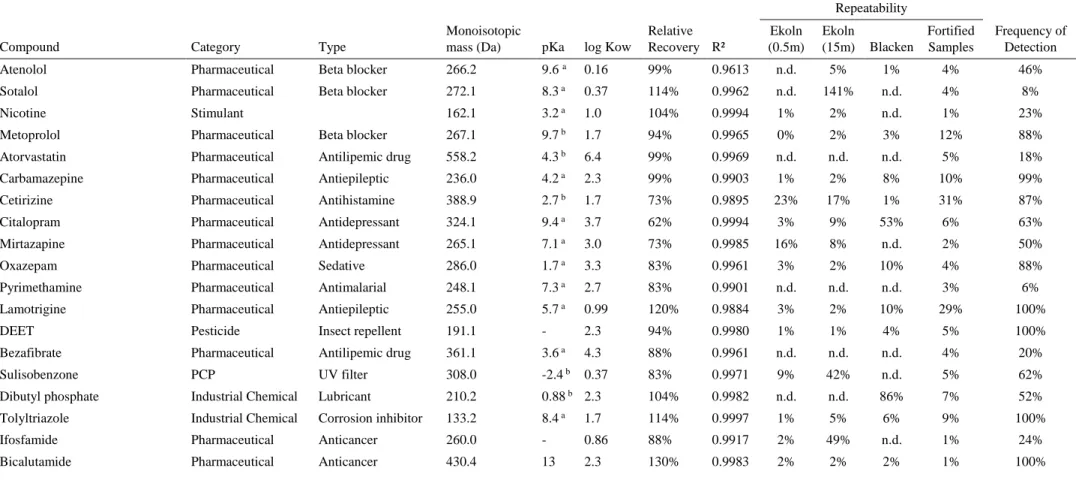
Table 1. Physico-chemical properties, relative recovery, coefficient of determination R², repeatability of duplicates and frequency of detection of positive analytes. In total 84 samples were analyzed. (pKa: acid dissociation constant; log Kow: water partition coefficient) 28 Table 2. Differences of sampling locations regarding sum of concentrations and the
absolute number of OMPs detected above LOQ of total 50 OMPs. All values constitute average values from the two sampling months
September ’17 and April ’18. 36
Table 3. Correlations between compounds according to PLS analysis by statistical program JMP. Only the best possible statistical significant correlation for each OMP is presented. Reciprocal best correlations between OMPs are
marked with * 47
Table A1. Average, maximum and minimum LOQ's from positive compounds 61 Table A2. Matrix effect of positive compounds. Negative values imply suppression,
positive values enhancement. 62
Table A3. Relative recovery rate and linearity (R²) of compounds with good relative recovery (60%-145%) that were not detected above LOQ or excluded. 63 Table A4. Precise sampling information showing labels, location, depth and
sampling date 64
Table A5. Additional information about compounds showing CAS-number, molecular formula, charge and hydrophobicity. Charge and hydrophobicity were derived from pKa and Kow, respectively. Charge: 0=neutral, 1=anionic,
2=cationic) 65
Figure 1. Sampling on the 11th of November 2017. Skarkolmen Uppsala. 18 Figure 2. Map of Mälaren showing the sampling sites, incoming streams and the
theoretical division of Lake Mälaren in six basins (A-F) (Sonesten et al.,
2013). 19
Figure 3. Set-up of filtering unit. 20
Figure 4. Set-up of SPE, showing the cartridges, loaded reservoirs, valves,
stock-cocks and manifold. 21
Figure 5. Top 20 highest detected OMPs throughout the entire sampling period of one year. The figure shows the maximum detected concentration, the medium concentration and the frequency of detection of the specific compound. In total 84 samples were analyzed. 32 Figure 6. Vertical distribution of water temperature for different locations throughout
the sampling period 37
Figure 7. Top 20 highest detected OMPs during winter sampling events. The figure illustrates the highest detected concentration and median concentration in winter. Seasonal detection frequency indicates how often a specific compound was detected in the winter months and total frequency of detection is associated to the entire sampling period. (n=17) 38 Figure 8. Top 20 highest detected OMPs during spring sampling events. The figure illustrates the highest detected concentration and median concentration in spring. Seasonal detection frequency indicates how often a specific compound was detected in the spring months and total frequency of detection is associated to the entire sampling period. (n=33) 39 Figure 9. Top 20 highest detected OMPs during summer sampling events. The
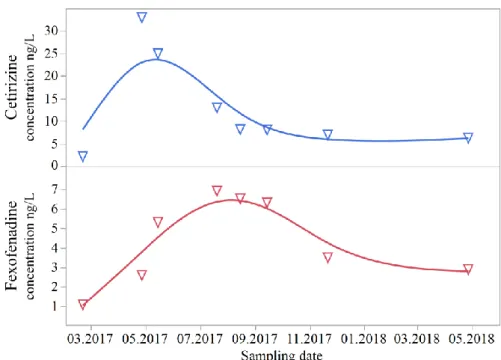
figure illustrates the highest detected concentration and median concentration in summer. Seasonal detection frequency indicates how often a specific compound was detected in the summer months and total frequency of detection is associated to the entire sampling period. (n=35) 39 Figure 10. Seasonal trend of detected concentrations for the two antihistamines
cetirizine and fexofenadine. 41
Figure 11. Summary plot of PCA analysis indicating correlations between variables: A) Score plot B) Loading plot. (Abbreviations: E=Ekoln;
V=Västeråsfjärden; S=Skarven, SV=Svinnegarnsvicken. Numbers constitute the sampling month: 2=February; 4.1=April’17; 4.2=April’18; 5=May, 7=July; 8=August; 9=September; 11=November. For overview purposes, only relevant sample points are labelled at the score plot, excluding those from less polluted sampling locations (e.g. Görväln,
Galten)). 45
Figure 12. Linear relationship of carbamazepine and lamotrigine at different
sampling locations [in ng/L] 70
Figure A2. Home-made cartridges for SPE, showing the different composition of the sorbent materials. Developed by Gago-Ferrero et al. (2015b). 71
ARF Average Response Factor
APPI Atmospheric Pressure Photoionization BAM Dichlorobenzamide
BCF Bioconcentration Factor C Concentration
CEC Critical Environmental Concentrations DEET Dietyltoluamide
DWP Drinking Water Plant EP Emerging Pollutant
EQS Environmental Quality Standards ESI Electrospray Ionization
EU European Union
GAC Granulated Activated Carbon GF/F Glass Microfiber Filters
H-ESI Heated Electrospray Ionization IC Industrial Chemical
IS Internal Standard
Kow Water Partition Coefficient
LOQ Limit of Quantification LC Liquid Chromatography MQ Milli-Q Water
MS Mass Spectrometry MST Matrix Matching Standard
NSAID Non-Steroidal Anti-Inflammatory Drug OMPs Organic Micropollutants
OTC Over-The-Counter PC Principle Component
PCA Principle Component Analysis PCP Personal Care Product
PFASs Perfluoroalkyl Substances pKa Acid Dissociation Constant PLS Partial Least Square PP Polypropylene
RC Regenerated Cellulose
SMHI the Swedish Meteorological and Hydrological Institute SPE Solid Phase Extraction
SRM Selected-Reaction Monitoring TAED Tetraacetylethylenediamine
UPLC-MS/MS ultra-high pressure liquid chromatography tandem mass spec-trometry
1.1 Background
Organic micropollutants (OMPs) – also often referred as emerging pollutants (EP) – are a group of compounds that encompass pharmaceuticals, industrial chemicals (IC), personal care products (PCP), pesticides, parabens, perfluoroalkyl substances (PFASs) and others (Luo et al., 2014). OMPs are to a high extent of anthropogenic origin, however can occur naturally as well. They can be detected in various envi-ronmental matrixes in trace concentrations ranging from few ng/L to several µg/L, namely in water, sediments, soil and biota (Nikolaou et al., 2007). Furthermore, their fate and transport are complex and dependent on numerous factors, such as production, consumption/usage, disposal, transport, removal, transformation, re-sistance etc.
In general, emerging contaminants comprises three categories of compounds: they were just recently developed and therefore newly introduced into the environ-ment or they were just recently detected although they are already present in the environment for some unknown time or they were only just recently identified as being potentially hazardous for the environment and/or humans (Houtman, 2010). The common feature shared by these compounds is their ubiquitous nature and the absence of guidelines and standards which are adopted to regulate their discharge into the aquatic environment (Houtman, 2010; Luo et al., 2014). Regulations only exist in a compromised level: The European Union (EU) “watchlist”, a EU-wide monitoring mechanism that addresses 10 substances/groups of substances and envi-ronmental quality standards (EQS) that exist only for a very limited number of com-pounds (Barbosa et al., 2016). From a national perspective, the Swedish regulatory framework merely touches upon pesticides and PFAS’s in drinking water (Tröger
et al., 2018). The fact, that the majority of about 3000 different substances, used in
already only human medication in the EU, are not regulated and usually have a ten-dency to be environmental persistent and biological active gives rise to considerable
toxicological concern (Fent et al., 2006). Adverse effects that are frequently associ-ated with the occurrence of OMP’s in the aquatic environment are the antibiotic resistance of microorganisms, acute or chronic toxicity, negative effects to non-tar-get organisms, uncertainties regarding transformation products and metabolites and endocrine disrupting effects (Daughton & Ternes, 1999; Pérez-Fernández et al., 2017).
Extensive studies targeting OMPs in surface water, in particular, lake basins, are limited. This is also the case for Lake Mälaren, Sweden’s third biggest lake which is also an important natural drinking water resource, where long-term regular mon-itoring programs exist (Fölster et al., 2014), but comprehensive data about OMPs are not available.
The sheer amount of OMP, their multi-facetted behaviors and complex correla-tions of environmental factors underline the challenge to depict fate and transport of OMP’s in surface water. In spite of numerous analytical advances, analysis of trace compounds in environmental matrices are still challenging regarding its relia-bility, simplicity, duration, sensitivity and selectivity (Fedorova et al., 2014).
This study aims to provide a comprehensive data set from a one-year sampling period at different locations and sampling depths for Lake Mälaren and moreover to contribute to the ongoing assessment of the possible environmental hazards of OMPs.
The main objectives of this study are:
- To optimize a multi-residue method, based on a single solid-phase-extrac-tion (SPE) protocol followed by UPLC-MS/MS for the analysis of OMPs in surface water
- To investigate the occurrence of 50 OMPs in Lake Mälaren over one year. - To investigate seasonal changes, spatial and vertical distributions of OMP
concentrations in Lake Mälaren over one year.
- To study correlations between compounds and water chemistry of Lake Mälaren.
1.1.1 Occurrence of OMPs in the aquatic environment
A comprehensive understanding of the spatial and temporal occurrence of OMPs is essential to identify compounds that require greater attention. By incorporating compound and environmental matrix specific properties, conclusions regarding a compound’s behavior in the environment can be drawn and will therefore facilitate and contribute to future decision-making for defining quality standards and regula-tions. Exposure and effects of OMPs can only then accurately be evaluated if pro-found knowledge about fate and transport is acquired (Andreozzi et al., 2003).
Car-bamazepine, diclofenac, ibuprofen and caffeine are some of the most frequently de-tected compounds in surface waters (Luo et al., 2014). Bezafibrate, metoprolol, iopromide, tramadol, erythromycin, azithromycin and clarithromycin are additional compounds usually being associated with a ubiquitous presence in surface water (Fent et al., 2006; Ebele et al., 2017; Yang et al., 2017).
1.1.2 Sources, pathways and removal efficiency
There are different ways for OMP’s to enter the environment; in general, one can differentiate between point and diffuse sources. Point sources are single locations that are clearly distinguishable from other pollution sources, whereas diffuse sources are rather elusive and are characteristic for broad geographical scales (Lap-worth et al., 2012). Examples for this are on the one side industrial effluents, hospi-tal effluents, wastewater and sewage treatment plants, waste disposal sites, septic tanks and on the other side storm-water/urban runoffs, agricultural runoffs due to application of sewage sludge, leakages from sewer systems (Lapworth et al., 2012; Li, 2014). The major identified pathway of introducing OMPs into the aquatic en-vironment is the effluent of wastewater treatment plants (WWTP) consisting of pro-cessed influents from domestic, municipal and/or industrial systems (Daughton & Ternes, 1999; Choi et al., 2008; Loos et al., 2013). While the final effluent is dis-charged into surface waters, the remaining residual sludge is either disposed at land-fills, which can for instance lead to percolation into groundwater, or used as ferti-lizer and applied to agricultural lands, where roffs into water bodies are not un-likely (Daughton & Ternes, 1999; Ebele et al., 2017). Some pharmaceuticals and personal care products (PCPs) may be released directly into aquatic bodies via im-proper disposal of unused medication or recreational activities such as bathing or swimming (Daughton & Ternes, 1999; Yang et al., 2017).
Usually, conventional WWTPs are not designed for the purpose of removing OMPs, which is why OMPs are often still present in the effluent (Zorita et al., 2009). Whether and how much a compound is removed does not only depend on the design of a treatment plant but also on the physico-chemical properties and the frequency of introduction of the compounds – some compounds may not be degraded at all or only very slow (Yang et al., 2017).
Differences within the single steps of water treatment and their respective mech-anisms – primary, secondary and tertiary – are apparent. Several studies investigated this and suggest that removal efficiency is insufficient for primary treatment, whereas secondary treatment is already much more effective and tertiary treatment the most promising option (Altmann et al., 2014; Luo et al., 2014; Falås et al., 2016). An example of tertiary treatment is the incorporation of granulated activated carbon (GAC) filters or ozonation into the operating. When GAC filters are used –
as it is the case in the drinking water plant (DWP) at Lake Görväln – regular regen-eration or replacement are important to ensure continuous high levels of removal of OMPs (Tröger et al., 2018). Luo et al. ascertained wide compound-specific varia-tions in the OMPs removal efficiency for WWTPs ranging from 12.5% to 100% (Luo et al., 2014). Despite additional treatment, some compounds might still occur in drinking water in usually low concentrations, well below acute toxicity levels (Luo et al., 2014; Tröger et al., 2018).
1.1.3 Natural attenuation process
Once entered the aquatic environment, the concentration of OMPs is expected to decrease with increasing distance to the point of discharge, due to dilution and nat-ural attenuation mechanisms (Vieno et al., 2005; Daneshvar et al., 2010b). Here, sorption and biodegradation are essential processes. However, also photodegrada-tion is a key factor for natural attenuaphotodegrada-tion. The rate of photodegradaphotodegrada-tion relies on the strength of solar irradiation and on the presence of photosensitizer acting sub-stances to enable photodegradation in the first place (Fent et al., 2006). Although natural attenuation mechanisms contribute to a steady decrease of OMP concentra-tions, spatial distribution and detection in big water compartments, such as Lake Mälaren, is not detained.
1.2 Limitations of the study
Some OMPs are undergoing transformation through wastewater treatment or human extraction so that there are eventually modified and unchanged OMPs discharged (Azzouz & Ballesteros, 2013). Modified OMPs, so-called transformation products might pose an even higher risk to the environment and humans than the parent com-pounds. To date, knowledge about occurrence and toxicology of transformation products is limited. The present study does not focus on these transformation prod-ucts of OMPs.
Due to the vast amount of target analytes, not every single compound will be addressed specifically and compared with concentrations presented in the literature. In the course of this thesis, some compounds of particular interest are discussed more deeply.
2.1 Chemicals and consumables
For chemical analysis, ultrapure water was generated by a Milli-Q (MQ) Advantage Ultrapure Water purification system and filtered through a 0.22 µm Millipak Ex-press membrane and an LC-Pak polishing unit (Merk Millipore, Billercia, MA). Methanol, acetonitrile, ammonium acetate, formic acid, ammonia and ethyl acetate of high analytical grade were acquired from Sigma-Aldrich (Sweden).
All analytical standards used for analysis were of high purity grade (>95%). Na-tive standards (n=122) originate from Sigma-Aldrich (Sweden). Isotopically labeled standards (IS) (n=26) for the target compounds were obtained from Wellington La-boratories (Canada), Teknolab AB (Kungsbacka, Sweden), Sigma-Aldrich and To-ronto Research Chemicals (ToTo-ronto, Canada). Detailed information about internal and native standards can be found elsewhere (Rostvall et al., 2018).
Several consumables were used in the present study, mainly for sample prepara-tion. For SPE empty polypropylene (PP) tubes (6 mL) and sorbent materials Sepra ZT (Strata-X), Sepra ΖΤ-WCX (Strata-X-CW) and ΖΤ-WAX (Strata-X-AW) were acquired from Phenomenex (Torrance, USA). The sorbent material Isolute ENV+ and the frits (20 μm, 6 mL) were obtained from Biotage (Ystrad Mynach, UK). The samples were filtered using a glass microfibre filter (grade GF/F, Whatman, thick-ness 0.42 mm, pore size 0.7 μm) and regenerated cellulose syringe filters (RC) of 15 mm diameter and 0.2 μm pore size purchased from Millipore (Cork, Ireland) and Phenomenoex(Torrance, CA, USA), respectively, were used.
2.2 Selected compounds
In total 122 compounds were evaluated in the present study, consisting of 80 phar-maceuticals, 19 industrial chemicals, 7 personal care products, 3 pesticides, 3 vita-mins, 3 parabens, 2 artificial sweeteners, 2 stimulants, 1 contrast medium, 1 opioid and 1 isoflavone. The pharmaceuticals cover several different therapeutic groups, such as analgesics, anesthetics, antibiotics, anticancer, antidepressants, antidiabet-ics, antidiarrhoeal, antifungals, antihistamines, antihypertensives, antilipemic agents, antimalarials, antipsychotic, antisecretory agent, beta blockers, diuretics, nonsteroidal anti-inflammatory drugs (NSAID) and sedatives.
The multiresidual approach of this study was based on a method developed in the Department for Aquatic Sciences and Assessment SLU, which focused on an array of OMP’s that were chosen due to their high annual consumption and wide scope of application in the private sector and their continuing concern about their possible adverse effect on humans and aquatic organisms.
This target screening method was optimized by testing 35 additional compounds on a triple-stage quadrupole mass spectrometer MS/MS TSQ QUANTIVA (Thermo Fisher Scientific). A compound was incorporated in the method if the instrument was able to ionize the compound and its fragments could therefore be determined in order to quantify and qualify the compound. This is essential to avoid false positive identification of compounds (Krauss et al., 2010). Additionally, the chromatograph-ical column had to be able to separate the target compounds from endogenous sub-stances with similar retention times and the LOQ shouldn’t be too high. Out of the 35 tested compounds, 21 were added to the final analytical method.
2.3 Study site and sample collection.
Mälaren Lake is the third biggest lake in Sweden. It is the major supply for drinking water production in the Stockholm area and at the same time a receiving water body for several wastewater
treat-ment plants (Swedish EPA, 2017). The lake is enclosed by Stockholm to the east, Uppsala to the north and Västerås to the west. The Mälaren area is con-sidered as one of the fastest economically expanding re-gions in Sweden and at the same time, Stockholm has the
Figure 1. Sampling on the 11th of November 2017. Skarkolmen Uppsala.
greatest increase in population increase in Europe (11% in the next five years) (WssTP, 2013).
The lake’s surface area is 1140 km², maximum depth is about 64 m and the water residence time is 2.8 years (Wallin et al., 2000; Daneshvar et al., 2010a). The sur-rounding area is characterized by 57% forest area, 20% agricultural area and 11% water bodies (Sonesten et al., 2013). The lake basin has a branched structure which entails various bays of different shapes and depths (Willén, 2001; Moore et al., 2008). This allows to divide the lake into different basins and to regard it separately. There are 12 incoming rivers to Mälaren: Arbogaån, Hedströmmen, Köpingsån, Kolbäcksån, Eskilstunaån, Svartån, Sagån, Råckstaån, Örsundaån, Fyrisån, Märstaån and Oxundaån (from west to east) (Sonesten et al., 2013). The map (figure 2) gives a good overview of the described sampling site.
Eight different sampling events were conducted in the course of this study, starting in February 2017 and followed by April, May, July, August, September, November and April 2018. In total, 11 sampling points were part of the study: Galten, Blacken, Västeråsfjärden, Granfjärden, Svinnegarnsviken, Ulvhällsfjärden, Prästfjärden, S. Björkfjärden, Ekoln, Skarven and Görväln. However, the sampling sites varied slightly during the sampling period, and only 5 locations were consistently collected throughout most of the period: Ekoln, Galten, Görväln, Skarven and Väster-åsfjärden. Usually, surface water (0.5m) were collected for the different locations,
Figure 2. Map of Mälaren showing the sampling sites, incoming streams and the theoretical division of Lake Mälaren in six basins (A-F) (Sonesten et al., 2013).
with the exception of Ekoln, Görväln and in one occasion Prästfjärden, which were sampled for three different depths (0.5 m, 15 m, 30 m or 40 m). The appendix table A4 contains a detailed list of the exact sampling points of this study.
2.4 Sample preparation
Water samples were taken as grab samples in 1 L PP-bottles during the period from February 2017 to April 2018. Sampling bottles were rinsed three times before being filled. In total, 84 samples were ana-lyzed. All samples were stored at 8°C at the Depart-ment for Aquatic Sciences and AssessDepart-ment at SLU. Detailed information about the sampling sites, dates and location can be found in table A4 in the in ap-pendix.
For the SPE analysis, 500 mL of the aliquots were used. Before extraction, all samples including blanks were vacuum filtered to remove suspended solids and avoid subsequent clogging during SPE. The glass microfiber filter used (grade GF/F, Whatman, thickness 0.42 mm, pore size 0.7 µm) were burned at 400°C for four hours before use. By thoroughly shaking the samples before the filtration it was en-sured to obtain homogenized samples. The filtration unit was cleaned with MQ water and methanol be-tween different samples. The instrumental setup of the filtering unit is shown in Figure 2.
As the extracted samples will be used for a following study focusing on non-target screening, the extraction materials chosen for the present study needed to be compatible with the subsequent method and support it. The combined results of the present target-based study and the nontarget analysis allow a holistic environmental risk assessment (Gago-Ferrero et al., 2015a). Due to this reason, SPE was conducted with home-made cartridges following the method developed by Gago-Ferrero et al. (2015a; b). For the purpose of covering a broad range of compounds and enabling their enrichment, four different powder materials were selected and mixed together (200 mg X, 150 mg Isolute ENV+, 100 mg X-AW and 100 mg Strata-X-CV) (Gago-Ferrero et al., 2015b). An illustration of the composition of a car-tridge can be found in figure A2 in the appendix.
The samples were spiked with the IS mix (50 ng/ per sample aliquot before SPE).
In the first step of SPE extraction, cartridges were conditioned (by gravity) in two steps by adding 6 mL of methanol and 6 mL of MQ water into the reservoirs. Reservoirs got loaded and the flow rate was adjusted to roughly one drop per second by means of vacuum. Another 6 mL of MQ was added after all the aliquot ran through and the cartridges were dried under
vacuum for 20 min.
The eluate is collected in plastic tubes after adding 4 mL of methanol/ethyl acetate (1:1) containing 2 % ammonia directly into the car-tridge, followed by 2 mL of methanol/ethyl ac-etate (1:1) containing 1.7 % formic acid. This step was done under gravity.
To decrease the volume of the extract, nitro-gen stream is applied until a volume of approx-imately 1 mL is reached, then transferred to an amber glass vial, rinsed 3 times with methanol and evaporated again to exact 500 µL. Analytes are vortexed and 500 µL of MQ water is added before analysis.
The set-up of the SPE extraction including manifold, adapters, stop-cocks, reservoirs and vacuum outlet is shown in figure 3.
2.5 Instrumental analysis
The need to analyze complex sample matrixes with unknown interferences, such as environmental samples, is widely met with coupling a separation technique with an identification and quantification method, represented by chromatography and mass spectrometer (MS).
For liquid chromatography (LC), the two key elements for the separation of com-ponents in the sample are a liquid mobile phase in which the analytes are diluted, and a stationary phase represented by the column (Skoog et al., 2017). The physical-chemical properties of a compound determine its characteristic retention time, which is needed to identify it – the polarity of a compound plays a pivotal role in this process. The choice of column considerably affects the resolution and run time in LC.
Before the analysis in the mass spectrometer, the compounds need to be ionized. Electrospray ionization (ESI) is a rather soft liquid-phase ion source which has a
Figure 4. Set-up of SPE, showing the car-tridges, loaded reservoirs, valves, stock-cocks and manifold.
very high sensitivity to the concentration of a compound and works in an appropriate way in combination with LC (Hoffmann & Stroobant, 2007).
A commonly used method for target analysis is the triple quadrupole mass spec-trometer, which however exhibits restrictions for suspect and non-target screening (Krauss et al., 2010). The operating principle can be described in a three-step pro-cess involving two stages of mass analysis (MS/MS). Firstly, a mass spectrometer filters a precursor ion, which is then dissociated into fragments within the collision cell and lastly the resulting product spectrum is analyzed by the second mass spec-trometer (Hoffmann & Stroobant, 2007).
The samples were analyzed by a DIONEX UltiMate 3000 ultra-high pressure liquid chromatography (UPLC) system (Thermo Scientific, Waltham, MA, USA) coupled to a triple quadrupole mass spectrometer (MS/MS) (TSQ QUANTIVA, Thermo SCIENTIFIC, Waltham, MA, USA). An Acquity UPLC BEH-C18 column (Waters, 100 mm × 2.1 i.d., 1.7 µm particle size from Waters Corporation, Man-chester, UK) was used as an analytical column. Injection volume was 10 µL for all samples. A heated electrospray ionization (H-ESI) was used to ionize the target compounds. The spray voltage was set to static: positive ion (V) 3500. Nitrogen (purity >99.999%) was used as a sheath gas (50 arbitrary units), auxiliary gas (15 arbitrary units) and sweep gas (2 arbitrary units). The vaporizer was heated to 400°C and the capillary to 325°C. Two selected reaction monitoring (SRM) transitions were monitored for all analytes. The mobile phase consisted of MQ with 5 mM ammonium acetate and acetonitrile. The flow rate was 0.5 mL/min and run time was 15 min having switched positive and negative electrospray ionization modes.
The above-mentioned ionization conditions were set as tuning conditions for the SRM of individual compounds. The tuning was performed with an infusion of 1
µg/mL solution of each analyte into the stream of the mobile phase (300 mL/min of
MQ water + 5 mM ammonium acetate/acetonitrile, 50/50). The tube lens voltage and collision energy of the two most abundant transitions were optimized.
The chromatography data acquisition mode was performed in a positive and neg-ative mode using selected-reaction monitoring. Xcalibur software (Thermo Fisher Scientific, San Jose, CA, USA) software was used for optimizing the instrument methods and running of samples. The obtained data were evaluated using Trace-FinderTM 3.3. software (Thermo Fisher).
2.6 Method performance
The performance of the method was assessed with regard to its linearity, LOQs, relative recovery, precision, blanks and matrix effect.
For testing the linearity of the method, a ten-point calibration curve in the con-centration range from 0.01 ng/L to 250 ng/L was created. For each separate analysis, the calibration curve was measured twice, at the beginning and at the end of the sequence to check instrumental stability. The linearity of the calibration curve was validated by calculating the coefficient of determination R².
Instrumental LOQ’s were calculated as one half of the lowest calibration point in the calibration curve where relative standard deviation of average response factor (ARF) was < 30% (in some cases one or two points at low concentration levels had to be removed). LOQs for each analyte in each sample were calculated by using the peak area of the lowest calibration point in the calibration curve. Average, minimum and maximum values of LOQ of the particular analytes can be found in table A1 in appendix.
The relative recovery, also known as trueness, verifies the performance of the extraction method (SPE, UPLC-MS/MS). This is done by spiking a known concen-tration of target analytes into the water samples (100 ng/sample) and correlate it with the detected concentration after extraction and analysis – so-called fortified samples.
The precision of the method is evaluated by the repeatability of the study. For this purpose, duplicates were conducted for every tenth sample. The values allow the comparison of the analysis within a batch of samples and between different batches. The repeatability is calculated by the ratio of standard deviation of the du-plicates and the average detected concentration of the compounds times 100. Opti-mal repeatability rates are lower that 30%.
Quantification of the target compounds is done by using an internal standard (IS) calibration model. An optimized quantification of the analytes was established by combining four calibration curves and hence, to smooth possible outliers.
As the mass and retention time of a compound is relevant for the detection by UPLC-MS/MS, the optimal approach would be to use an isotopically labeled form for each of the target compounds, as it is stated in the Commission Decision 2002/657/EC (European Commission, 2002). For target compounds that could not be matched with a specifically designed IS due to restricted commercial availability, a surrogate IS needed to be selected. This was the case in particular for the newly tuned compounds. The chosen IS should reflect the physical-chemical properties, retention time and categorial grouping of the compound as much as possible. This step is also essential to obtain acceptable recovery rates for the compounds.
A mix of endogenous substances, such as proteins, lipids, minerals, salts and others can considerably affect the extraction and analysis. This phenomenon is com-monly termed matrix effect. The resulting effect of ion suppression or enhancement were taken into consideration by matrix matching standards (MST). As the matrix effect can differ with the different compositions of the samples, the MST’s were
chosen in such way that the most frequent locations Ekoln, Görväln, Skarven, Gal-ten and Västeråsfjärden were covered and could be therefore assigned to the respec-tive sample. For Ekoln and Görväln MST values for the different depths were de-termined and were incorporated as an average value in the calculation of real con-centrations of the samples. Those samples that are not directly presented by a cor-responding MST from the respective location, the real concentrations were calcu-lated by using the MST with the highest matrix effect.
Matrix-matched standards were prepared from water samples spiked with ISs at concentration levels of 50 ng per sample and native compounds at concentration levels of 100 ng per sample after extraction. The peak area/IS ratio determined in non-spiked samples was subtracted from the peak area/IS ratio in matrix-matched standards to achieve the matrix-affected response factor. Additionally, matrix ef-fects were calculated and are presented in table A2 in the appendix. Negative values are associated with ion suppression whereas positive values are associated with ion enhancement.
To exclude any concerns of contamination and evaluate possible memory ef-fects, each batch of analysis was conducted with two blanks, MQ water and tap water, which were filtered, extracted, eluted and analyzed in the exact same way as the samples. PP-bottles and SPE reservoirs were rinsed three times with methanol; adapters, stop-cocks from the SPE and needles from the evaporation step were ul-trasonicated twice for 15 min. All analytical work was conducted while wearing gloves.
Method performance parameters (R², repeatability; relative recovery) are shown in table 1 in paragraph 3.1.
2.7 Statistical analysis
The statistical program JMP from SAS institute was used for data analysis, graphical processing and statistical tests, notably principle component analysis (PCA) and partial least square (PLS) analysis. In addition, the spreadsheet program Microsoft Excel was used to calculate concentrations and data analysis. For maximum, median and average values, only concentrations >LOQ were used.
3.1 Method performance
In the present study, 122 compounds were evaluated in the course of SPE and UPLC-MS/MS. In spite of prior tuning, throughout the analysis it became apparent, that 11 compounds were not able to be analyzed in a qualitative and quantitative way. These 11 substances consist of 6 ICs, 4 pharmaceuticals and one PCP. Reasons for omission became mostly clear during acquiring the data via the software Trace-Finder. No clearly detected peaks, no sufficient chromatographic separation, a lack of ionization of the compound to determine a qualitative and quantitative fragment or high variability in the results, no linear response of the calibration curves were the main reasons for excluding those compounds. Due to their vast diversity, knowledge about industrial chemicals, their behavior and analytical protocols for their determination in environmental samples is limited or lacking completely – as it is the case of sebacic acid, tetraethylene glycol, dibutyl thiourea, tetraacetyleth-ylenediamine (TAED), mono-n-butylphosphoric acid and 4-dodecylbenzenesul-fonic Acid. Three of the omitted compounds are part of the EU-Watchlist: the two macrolide antibiotics azithromycin and erythromycin and the UV-filter 2-ethyl-hexyl-methoxycinnamate. The difficulties to analyze these compounds are well known in the literature. Instead of the chosen UPLC-MS/MS set-up of the present study, variations in the sample preparation, liquid phase, ion source, column etc. will achieve considerable different results (Pérez-Fernández et al., 2017). For in-stance, using atmospheric pressure photoionization (APPI) instead of H-ESI as an ion source will yield much better outcomes for some compounds (Lindberg et al., 2014).
For 74 OMPs of the remaining 111 OMPs the method was suitable by obtaining a relative recovery within the range of 60% to 145%, thus leading to the exclusion of 23 pharmaceuticals (including clarithromycin, the third macrolide antibiotic on
the EU-Watchlist), 6 ICs, 4 PCPs, 3 vitamins and 2 artificial sweeteners due to un-acceptably low recovery rates and therefore restrictions in their quantification. For 22 OMPs the recovery rate was under 60% with ricinoleic acid having the lowest recovery rate of 3%, for 13 OMPs the recovery rate was above 145% with oleic acid having the highest recovery rate of 624%, and 3 times no recovery rate was obtained as the LOQs were too high. 15 additional compounds are within the range of 40% to 160%. The bad recovery rates of the 23 OMPs imply that using the described method is not appropriate and different methods, more targeted towards their spe-cific analysis requirements, are needed.
As the target analytes of the present study are quite heterogeneous and cover a wide range of physico-chemical properties, finding conditions that attain acceptable chromatographic behaviors to adequately quantify the compounds is a complicated matter (Grabic et al., 2012). For instance, different mobile phases can improve the chromatographic performance regarding reduced peak tailings and better resolu-tions for some compounds considerably – for some compounds the effect may, how-ever, entail the complete opposite (Baker & Kasprzyk-Hordern, 2011). Whatever condition is chosen, it is an issue that constitutes a compromise for the analytes in terms of sensitivity and selectivity but ultimately seeks a good overall performance (Huntscha et al., 2012). The choice of sorbent material for SPE is essential to attain good recovery rates (Baker & Kasprzyk-Hordern, 2011; Pérez-Fernández et al., 2017). Not only were the powder sorbents used in the present study originally cho-sen for a non-target analysis, but also do home-made cartridges entail a certain un-certainty as a 100% homogeneity of the cartridges cannot be guaranteed. Investigat-ing factors like the applied temperature durInvestigat-ing the evaporation step, vials, sample volumes, filters being used, are important to consider to achieve optimized recovery rates (Baker & Kasprzyk-Hordern, 2011). SPE related issues are partially discussed in Gago-Ferrero et al. (2015a; b) For future analysis a method adaptation is recom-mended, in particular regarding the choice of cartridges for SPE extraction.
Individual LOQs for each compound in each sample are summarized in average, minimum and maximum values and are presented in table A1 in the appendix for only the 50 OMPs which were detected at least once above the LOQ and not re-moved for some other reason (see paragraph 3.2.1). The same applies to repeatabil-ity and linearrepeatabil-ity. Those compounds which attained good recovery rates, however were not detected above LOQ are listed in table A3 in the appendix including re-covery rates and linearity.
The range for the LOQsaverage for the 50 OMPs reaches from 0.010 to 5.0 ng/L
(median 0.090 ng/L), for LOQsmin from 0.0070 to 3.9 ng/L (median 0.062 ng/L) and
for LOQsmax from 0.020 to 10 ng/L (median 0.26 ng/L). For four compounds LOQs
ibuprofen (LOQaverage = 5.0 ng/L), valproic acid (LOQaverage = 3.6 ng/L) and
3-(4-methylbenzylidene)camphor (LOQaverage = 3.3 ng/L).
The instrumental analysis of the present study shows good linearity for the ma-jority of compounds (R² > 0.980), with the exception of atenolol (R² = 0.961) and irbesartan (R² = 0.975).
Sample duplicates with high frequencies of detection are the most suitable ones to show the repeatability of the used method. For this reason, only duplicates from Ekoln, Västeråsfjärden, Blacken and fortified samples are presented in table 1. Looking at the fortified samples, only one analyte exceeded the 30%, namely lido-caine (55%). Lidolido-caine, however, showed good repeatability rates for the other du-plicates. Besides that, 88% of the duplicates show a good precision (<30%) of the SPE analysis.
Matrix effects are presented in table A2 in the appendix and show a good com-parability of the different sampling points. High ion suppression or enhancement of an analyte in one of the sampling sites is usually reflected in the other sampling sites as well. No evident deviation for any of the matrix matching samples was observed, so that assigned MSTs for the calculated concentrations are approved. Seemingly arbitrary behaviors arise for: atenolol, bicalutamide, clozapine, irbesartan, amitrip-tyline, valproic acid and venlafaxine. In most cases, the deviating matrix effect stems from Västeråsfjärden, or occasionally from Ekoln. Greater polluted water in conjunction with the proximity to a large city likely contains more matrix com-pounds that might explain the alteration in detected concentrations of analytes.
Some studies suggest correlations between polarity and molecular weight of the compounds with matrix effects (Cappiello et al., 2010). However, no evident corre-lations could be found. Considerable high matrix effects were obtained for daidzein (range -170% to 349%), di-(2-ethylhexyl)phosphoric acid (range -101% to 122%) and lamotrigine (range -246% to 280%, Görväln 2018: 21%). For venlafaxine, there is an outlier value (437%) for MST Ekoln, although all the matrix effects of the other sampling points range from -8% to 41%.
17 industrial chemicals were tested in the course of this study. Although several IC were priorly tuned on the method and some of them even incorporated into the method, it became apparent that the method is rather unfitting due to largely not acceptable recovery rates and high variability in the results. Only 7 IC had a good recovery and from those 4 IC were detected above the LOQs. ICs were not part of the original developed analytical method. To my best knowledge, for some com-pounds an analytical protocol for their determination in environmental samples is not yet known.
Table 1. Physico-chemical properties, relative recovery, coefficient of determination R², repeatability of duplicates and frequency of detection of positive analytes. In total 84 samples were analyzed. (pKa: acid dissociation constant; log Kow: water partition coefficient)
Repeatability
Compound Category Type
Monoisotopic
mass (Da) pKa log Kow
Relative Recovery R² Ekoln (0.5m) Ekoln (15m) Blacken Fortified Samples Frequency of Detection
Atenolol Pharmaceutical Beta blocker 266.2 9.6 a 0.16 99% 0.9613 n.d. 5% 1% 4% 46%
Sotalol Pharmaceutical Beta blocker 272.1 8.3 a 0.37 114% 0.9962 n.d. 141% n.d. 4% 8%
Nicotine Stimulant 162.1 3.2 a 1.0 104% 0.9994 1% 2% n.d. 1% 23%
Metoprolol Pharmaceutical Beta blocker 267.1 9.7 b 1.7 94% 0.9965 0% 2% 3% 12% 88%
Atorvastatin Pharmaceutical Antilipemic drug 558.2 4.3 b 6.4 99% 0.9969 n.d. n.d. n.d. 5% 18%
Carbamazepine Pharmaceutical Antiepileptic 236.0 4.2 a 2.3 99% 0.9903 1% 2% 8% 10% 99%
Cetirizine Pharmaceutical Antihistamine 388.9 2.7 b 1.7 73% 0.9895 23% 17% 1% 31% 87%
Citalopram Pharmaceutical Antidepressant 324.1 9.4 a 3.7 62% 0.9994 3% 9% 53% 6% 63%
Mirtazapine Pharmaceutical Antidepressant 265.1 7.1 a 3.0 73% 0.9985 16% 8% n.d. 2% 50%
Oxazepam Pharmaceutical Sedative 286.0 1.7 a 3.3 83% 0.9961 3% 2% 10% 4% 88%
Pyrimethamine Pharmaceutical Antimalarial 248.1 7.3 a 2.7 83% 0.9901 n.d. n.d. n.d. 3% 6%
Lamotrigine Pharmaceutical Antiepileptic 255.0 5.7 a 0.99 120% 0.9884 3% 2% 10% 29% 100%
DEET Pesticide Insect repellent 191.1 - 2.3 94% 0.9980 1% 1% 4% 5% 100%
Bezafibrate Pharmaceutical Antilipemic drug 361.1 3.6 a 4.3 88% 0.9961 n.d. n.d. n.d. 4% 20%
Sulisobenzone PCP UV filter 308.0 -2.4 b 0.37 83% 0.9971 9% 42% n.d. 5% 62%
Dibutyl phosphate Industrial Chemical Lubricant 210.2 0.88 b 2.3 104% 0.9982 n.d. n.d. 86% 7% 52%
Tolyltriazole Industrial Chemical Corrosion inhibitor 133.2 8.4 a 1.7 114% 0.9997 1% 5% 6% 9% 100%
Repeatability
Compound Category Type
Monoisotopic
mass (Da) pKa log Kow
Relative Recovery R² Ekoln (0.5m) Ekoln (15m) Blacken Fortified Samples Frequency of Detection
Bisoprolol Pharmaceutical Antihypertensive 325.4 9.3 b 1.8 99% 0.9975 5% 2% 1% 4% 76%
Clozapine Pharmaceutical Antipsychotic 326.1 3.6 a 3.4 78% 0.9880 12% n.d. n.d. 2% 19%
Diazepam Pharmaceutical Sedative 284.0 3.3 a 2.7 88% 0.9835 29% 28% 23% 3% 37%
Fexofenadine Pharmaceutical Antihistamine 501.7 8.8 b 2.8 83% 0.9918 7% 1% 2% 6% 86%
Caffeine Stimulant 194.1 10 a -0.07 99% 0.9985 3% 9% 4% 1% 100%
Tramadol Pharmaceutical Analgesic 263.1 9.4 a 3.0 109% 0.9954 6% 3% 7% 4% 82%
Valsartan Pharmaceutical Antihypertensive 435.2 3.8 b 3.7 109% 0.9982 n.d. n.d. n.d. 7% 18%
Codeine Pharmaceutical Opiate 299.1 8.2 a 1.3 78% 0.9979 n.d. n.d. n.d. 1% 10%
Oxycodone Opioid 315.1 8.9 a 0.66 78% 0.9981 15% 8% n.d. 13% 25%
2,2'-Dimorpholinyldiethylether Industrial Chemical Process regulator 244.2 - -1.3 83% 0.9995 19% n.d. n.d. 8% 19%
Diclofenac Pharmaceutical NSAID 295.0 4.2 a 4.0 88% 0.9972 n.d. 24% n.d. 10% 37%
Ethylparaben Paraben Preservative 166.0 8.3 a 2.5 109% 1.0000 n.d. n.d. n.d. 6% 11%
Propylparaben Paraben Preservative 180.0 8.4 a 3.0 94% 0.9990 n.d. n.d. n.d. 0% 42%
Methylparaben Paraben Preservative 152.0 8.4 a 2.0 104% 1.0000 n.d. n.d. n.d. 1% 33%
Furosemide Pharmaceutical Diuretic 330.0 4.3 b 2.3 88% 1.0000 n.d. n.d. n.d. 1% 21%
Diltiazem Pharmaceutical Antihypertensive 414.1 7.7 a 2.8 88% 0.9976 n.d. n.d. n.d. 1% 10%
Ibuprofen Pharmaceutical NSAID 206.1 4.4 a 3.8 78% 0.9979 n.d. n.d. n.d. 7% 2%
Irbesartan Pharmaceutical Antihypertensive 428.2 3.5 b 5.3 94% 0.9753 2% 1% 1% 1% 62%
Propranolol Pharmaceutical Beta blocker 259.1 9.5 a 2.6 125% 0.9986 33% 16% 2% 1% 52%
Repeatability
Compound Category Type
Monoisotopic
mass (Da) pKa log Kow
Relative Recovery R² Ekoln (0.5m) Ekoln (15m) Blacken Fortified Samples Frequency of Detection Acetaminophen Pharmaceutical Analgesic 151.0 9.4 a 0.46 94% 0.9939 n.d. n.d. n.d. 14% 1%
Amitriptyline Pharmaceutical Antidepressant 277.1 9.4 a 5.0 109% 0.9966 n.d. n.d. n.d. 6% 14%
Valproic acid Pharmaceutical Antiepileptic 144.1 4.6 a 3.0 114% 0.9992 n.d. n.d. 141% 13% 43%
Venlafaxine Pharmaceutical Antidepressant 277.2 9.3 b 3.3 83% 0.9992 11% 16% n.d. 2% 71%
Daidzein Isoflavones 254.1 - 2.6 94% 0.9642 n.d. n.d. n.d. 2% 8%
Di-(2-ethylhexyl)phosphoric acid
Industrial Chemical Solvent Extraction 322.2 - 6.1 104% 0.9959 n.d. n.d. 2% 10% 18% Tris(2-butoxylethyl) phosphate Industrial Chemical Flame retardants 398.5 - 3.8 94% 0.9997 18% 4% n.d. 0% 76%
3-(4-Methylbenzylidene)cam-phor
PCP UV filter 254.2 - 5.9 62% 0.9995 n.d. n.d. n.d. 27% 4%
Fluoxetine Pharmaceutical Antidepressant 309.1 10 b 4.7 114% 0.9880 n.d. n.d. n.d. 7% 1% a experimental pKa, b theoretical pKa
3.2 Occurrence of OMPs
3.2.1 OMP concentrations
Out of the 74 OMPs with good relative recovery, 58 compounds were detected at least once above the limit of quantification.
Laurilsulfate was removed despite a good recovery rate. It was detected only once in one of the duplicates which results in an unacceptable repeatability value of 141%. Despite of good repeatability in the fortified samples, the high variability of the concentrations of samples, the repeatability and LOQs (variance 119%) led to the decision to remove the compound.
This also applies for the plasticizer Tributyl citrate acetate in a similar way. Low relative recovery (62%), unacceptable repeatability and high variability in concen-trations led to its omission.
Antibiotics and antifungals had to be removed as well. Six pharmaceuticals be-long to this group: metronidazole, metronidazole-OH, sulfamethoxazole, trime-thoprim, clindamycin and climbazole. The compounds were omitted due to stability issues of internal and native standards. As it is suggested in literature (Ort et al., 2010), freshly prepared standard mixed are crucial to obtain reliable results. Unfor-tunately, this was not assured.
Comprehensive monitoring studies focusing on OMPs in surface water are rare, especially with regard to lake basins. As river water is usually more directly affected by WWTPs effluents and dilution differs in terms of magnitude, a comparison of the obtain concentrations of the present thesis with other studies is impeded.
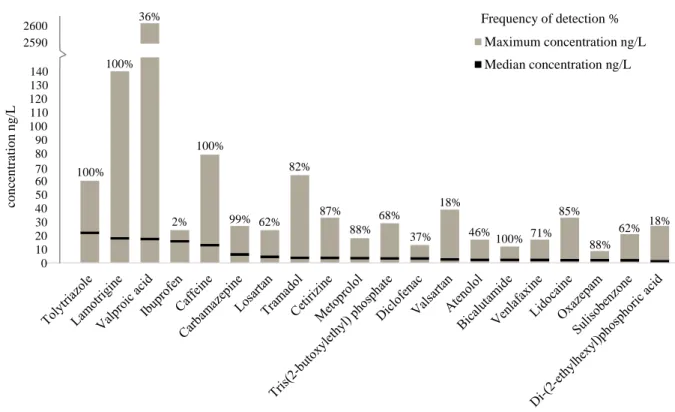
Five analytes were found in all sampling points: DEET, lamotrigine, bicalutam-ide, tolyltriazole and caffeine. Very high frequencies of detection (>80%) above LOQs were also obtained for carbamazepine (99%), metoprolol (88%), oxazepam (88%), cetirizine (87%), fexofenadine (86%), lidocaine (85%) and tramadol (82%). The highest detected concentrations (> 100 ng/L) were found for valproic acid and lamotrigine. Figure 4 illustrates the 20 compounds found with the highest concen-trations, their median concentration and frequency of detections. Due to the long sampling period, some compounds have considerable fluctuating concentrations,
with occasional high concentrations. To place less weight on these very high con-centrations, median instead of average concentrations were chosen to be displayed. In general, the median is less affected by outliers and has advantages in particular when the distribution of a data is not symmetrical.
Carbamazepine, valproic acid and lamotrigine are the most frequently prescribed antiepileptics, accounting for 72% of initiating monotherapies in Sweden; with an increasing trend to lamotrigine (Bolin et al., 2017). Since the physico-chemical properties of lamotrigine and carbamazepine are very similar, both antiepileptics, their behavior and occurrence usually go hand in hand (see paragraph 3.3). Numer-ous studies evince the low elimination rates of carbamazepine in WWTP (Li, 2014; Ebele et al., 2017). Neither sorption, biodegradation nor photodegradation seems to achieve good removal outcomes (Fent et al., 2006). Maximum (27 ng/L and 140 ng/L) and median (6.2 ng/L and 18 ng/L) detected concentrations for carbamazepine and lamotrigine, respectively, are within usually expected ranges. A sampling event in Lake Mälaren conducted by Daneshvar et al. (2010a) detected higher concentra-tions by roughly 8 orders of magnitude for carbamazepine (Daneshvar et al., 2010a).
100% 100% 2% 100% 99% 62% 82% 87% 88% 68% 37% 18% 46% 100% 71% 85% 88% 62% 18% 36% 0 10 20 30 40 50 60 70 80 90 100 110 120 130 140 2590 2600 co n ce n tratio n n g /L Maximum concentration ng/L Median concentration ng/L Frequency of detection %
Figure 5. Top 20 highest detected OMPs throughout the entire sampling period of one year. The figure shows the maximum detected concentration, the medium concentration and the frequency of detection of the specific compound. In total 84 samples were analyzed.
Valproic acid is the compound found with the highest concentrations ranging from 2.1 ng/L to 2600 ng/L with the median concentration 17.5 ng/L. Information about biodegradation and removal efficiency are inconsistent. According to the website TOXNET, bioconcentration in aquatic organisms is unlikely due to a bio-concentration factor (BCF) of 3 (TOXNET), whereas at the same time valproic acid was observed to change social interactions between zebrafishes (Zimmermann et
al., 2015), however, the Stockholm County Council determines the environmental
risk of valproic acid as insignificant but also states the uncertainty of the assessment due to lack of data (Stockholm County Council, 2014). No clear conclusion regard-ing the toxicological effect of valproic acid in Lake Mälaren can be drawn.
The ubiquitous nature of caffeine is not surprising, as it is widely known that caffeine is simply found everywhere; its concentration can even reach up to a few
µg/L (Sousa et al., 2018). In that perspective, the highest detected concentration of
79 ng/L and median concentration of 13 ng/L are acceptable.
Similar holds true for the insect repellent DEET (diethyltoluamide) which is quite usually found in high frequencies in surface water (Sandstrom et al., 2005). Maximum (8.3 ng/L) and median concentrations (1.95 ng/L) are low.
According to Daneshvar et al., metoprolol is “the most sold beta-blocker in Upp-sala”, and annual sales are more than twice as much as the beta-blocker atenolol (Daneshvar et al., 2010a). Maximum concentration is 18 ng/L, median concentra-tion 5.23 ng/L. These results are well comparable to the concentraconcentra-tions found by Daneshvar et al. (2010a) in Lake Mälaren; also regarding maximum and median concentrations found for atenolol, which are just slightly lower. The reason for this seems to be differences in removal efficiencies of WWTPs and excretion ratios of parent compound or metabolites (Daneshvar et al., 2010a).
Tramadol is an analgesic drug used for moderate to severe pain relieve (WHO, 2014). It is mainly present in soluble form as volatilization and sorption are expected to be low (Rúa-Gómez & Püttmann, 2012). Maximum detected concentration found was 64 ng/L and median concentration 3.8 ng/L, which is acceptable when compar-ing it to detected concentrations in river water in UK which exceeded scompar-ingle µg/L (Baker & Kasprzyk-Hordern, 2011). Tramadol is occasionally termed as a mild-opioid, similar to codeine (Olsson et al., 2017). It’s potential for dependency is con-sidered low (WHO, 2014), however, growing abuse rates among young adults are of rising concern (Olsson et al., 2017). Just recently in January 2018, a local Swe-dish newspaper reported the confiscation of great amounts of tramadol in Uppsala and that smuggling of tramadol increased strongly (Lindqvist, 2018). This indicates that Lake Mälaren might be affected by increasing tramadol consumption rates and the compound should be part of future monitoring programs.
Tolyltriazole is a corrosion inhibitor frequently used in dishwasher detergents and in vehicle/aircraft antifreezing products; it belongs to the group of benzotriazole
and is associated with high solubility in water, low biodegradability as well as low sorption abilities (Giger et al., 2006). Maximum detected concentration is 60 ng/L (Ekoln 30 m, Feb ‘17) and median concentration is 22 ng/L. This is below the con-centration found in Swiss lakes, with ranges up to a few µg/L, however, its high frequency of detection is well in agreement with studies investigating river water (Giger et al., 2006; Wang et al., 2016). Nearby located airports – Arlanda airport is situated to the east of Lake Mälaren – may considerably contribute to the occurrence in surface water (Giger et al., 2006). The high and frequent detected concentrations in surface water raise the question about its presence in drinking water. This was confirmed by Janne et al. and Wang et al. (2011; 2016).
Bicalutamide is next to ifosfamide one of the antineoplastic drugs detected in Lake Mälaren. Methotrexate was not detected. Bicalutamide is an antiandrogen used for 79% of prostate cancer treatment in Sweden and said to be difficult to biodegrade (Besse et al., 2012; Grundmark et al., 2012) which explains the continuous detection in all the sampling points. A maximum concentration of 12 ng/L and median con-centration of 2.3 ng/L is tolerable and seems not to raise high toxicological concerns (Besse et al., 2012; Santos et al., 2017).
For 34 of 51 compounds, maximum detected concentrations were compared with predicted critical environmental concentrations (CEC) calculated by Fick et al. (2010). CECs facilitate a quick and simplified approach to evaluate the potential of individual compounds to cause adverse pharmacological effects at certain water concentrations. This methodology is based on the correlation of plasma concentra-tion in exposed fish with human therapeutic plasma concentraconcentra-tions (Fick et al., 2010). All maximum concentrations were well below the CECs. However, no CEC values were available for some of the most frequent and highest detected com-pounds, for instance, DEET, nicotine, sulisobenzone, tolyltriazole, valproic acid, the three parabens and for the other industrial chemicals.
None of the detected concentrations represent an acute risk for humans or fauna according to current states of knowledge. However, high insecurities regarding chronic toxicity, adverse effects on non-target organisms and synergistic effects still remain and should not be disregarded.
Additional information for the 50 OMPs regarding CAS number, molecular for-mula, charge and hydrophobicity is shown in table A5 in the appendix.
3.2.2 Spatial distribution
In total 11 different sampling locations distributed around Lake Mälaren were part of the study: Ekoln, Skarven, Görväln, Västeråsfjärden, Blacken, Prästfjärden, Svinnegarnsviken, Granfjärden, Ulvhällsfjärden and Södra Björkfjären. Only 5
lo-cations, including different sampling depths for two of the lolo-cations, were consist-ently collected throughout most of the period: Ekoln (0.5 m, 15 m, 30 m), Görväln (0.5 m, 15 m, 40 m), Västeråsfjärden (0.5 m), Galten (0.5 m), Skarven (0.5 m).
For a better understanding of the results, it is important to point out, that there are considerable differences between the sampling locations regarding the residence time of the water, incoming flow rates, surrounding land use, volume and depth.
Depending on the residence time, some basins are more prone to higher concen-trations of pollutants than others, due to limited self-cleaning abilities and different background levels of substances (Sonesten et al., 2013). These self-cleaning abili-ties are somewhat at the same time basin dependent natural attenuation mechanisms. In the course of this, the volume and depth of a basin are relevant factors since the extent of larger bottom areas interacting with the surface water, the extent of wind and waves having an impact and the process of sedimentation do affect biodegrada-tion, sorption and photodegradation (Wallin et al., 2000).
For various purposes, Mälaren is divided into 6 theoretical basins (see figure 2). The westernmost and smallest basin Galten in terms of volume receives about 46% of the incoming water and has therefore the shortest residence time together with the easternmost basin, which is where Mälaren and its outlet is linked with the Baltic sea (theoretical turnover rate is between 0.5 – 1 month) (Sonesten et al., 2013). Väs-teråsfjärden, Blacken and Granfjärden form together the second biggest basin in terms of volume and have a theoretical water turnover rate of roughly 7 months. The biggest basin is represented by Svinnegarnsviken, Ulvhällsfjärden, Prästfjärden and S. Björkfjärden and is characteristic for the longest residence time with 1.8 years. Ekoln and Skarven form the most northern basin with a residence time of 1.2 years, which leaves the last basin Görväln with a residence time of roughly 5 months (Wallin et al., 2000).
There are two main flow directions of the water in Mälaren: one coming from the west moving to the east and the other coming from the north and continuing to the south. The ultimate mixing of those masses occurs at Görväln (Wallin et al., 2000).
The sampling sites Västeråsfjärden and Ekoln are most closely located to big cities and are therefore subject to rather direct pollution. In contrast, Görväln, Galten and Skarven are rather remote areas. The water for the drinking water plant is with-drawn at Görväln, which is approximately 50 km away from Ekoln.
Only two sampling months, namely September ’17 and April ’18, covered all 11 different sampling locations that were part of the study, the spatial distribution of OMPs in the entirety of Mälaren was addressed in only these two months. In general, differences between locations were shown in different concentration levels and dif-ferent absolute numbers of OMPs that were detected of the total 50 analyzed OMPs at a specific location.