CURRENT THEMES
IN IMER RESEARCH
NUMBER 6
Quantitative Indicators of Diversity: Content or Packaging?
Kvantitativa mångfaldsindikatorer: Innehållsförteckning
eller paketering?
Per Broomé
Inge Dahlstedt
Tobias Schölin
IMER • MIM MALMÖ 2007CURRENT THEMES IN IMER RESEARCH
is a publication series that presents current research in the multidisciplinary fi eld of International Migration and Ethnic Relations. Articles are published in Swedish
and English. They are available in print and online (www.bit.mah.se/MUEP).
MALMÖ UNIVERSIT Y SE-205 06 Malmö
Sweden tel: +46 46 665 70 00
CURRENT THEMES
IN IMER RESEARCH
NUMBER 6
Quantitative Indicators of Diversity: Content or Packaging?
Kvantitativa mångfaldsindikatorer: Innehållsförteckning
eller paketering?
Per Broomé
Inge Dahlstedt
Current Themes in IMER Research
Number 6
editorial board Björn Fryklund, Maja Povrzanovi ´c Frykman, Anne Sofie Roald
editor-in-chief Björn Fryklund
published by Malmö Institute for Studies of Migration, Diversity and Welfare (MIM) and School of International Migration and Ethnic Relations (IMER), Malmö University, 205 06 Malmö, Sweden
© Malmö University & the authors 2007 Printed in Sweden
Holmbergs, Malmö 2007
ISSN 1652-4616 / ISBN 978-91-7104-072-5 Online publication, www.bit.mah.se/muep
CONTENTS
PER BROOMÉ, INGE DAHLSTEDT, TOBIAS SCHÖLIN
Quantitative Indicators of Diversity: Content or Packaging?
Introduction
Diversity and Organisational Tools Theoretical Starting Points
Measuring Possibilities
Creating Three Quantitative Dimensions Method and Material
Methods
The Total Dimension
The Role-model Dimension
The Services Dimension
Representation and Different Types of Services
Ethnicity in Breif
Material
The City of Malmö and the City Administration – numbers in short Diversity in the City Administration of Malmö
The Total Dimension
Connection to the Workplace
The Role-Model Dimension The Services Dimension Concluding Discussion
More Like Packaging – fi nal refl ections
5 5 6 7 8 9 9 10 11 11 13 14 18 19 24 24 29 31 34 38 41
ACKNOWLEDGEMENT NOTES
REFERENCES APPENDIX
SAMMANFATTNING
Kvantitativa mångfaldsindikatorer: Innehållsförteckning eller paketering?
ABOUT THE AUTHORS
43 43 44 47 55 59
QUANTITATIVE INDICATORS OF DIVERSITY:
CONTENT OR PACKAGING?
Per Broomé, Inge Dahlstedt, Tobias Schölin
This study explores the possibilities of measuring diversity in organisations. In the fi rst section of the study we develop three quantitative dimensions of diversity: the Total Dimension that measures horizontal and vertical representations, the Role-model Dimension that measures representation at the top level of the organisation, and the Services Dimension that measures the organisation’s ‘diversity sensitivity’. These three dimensions or measures were developed and critically discussed before being tested on Malmö city’s administration, i.e. the central offi ce and the health and social service supply.
KEYWORDS: diversity, organisation, indicators, representation, Malmö
Introduction
Diversity and Organisational Tools
According to the dominant literature on organisational diversity, a number of steps have to be taken in order to “do” or organise diversity. These steps include measuring the number of “differences” in the organisation, leading diversity, educating with regard to diversity issues and creating and setting good examples. Organisational change toward the so-called multicultural organisation is crucial to diversity work (Cox 1993, cf. Mlekov & Widell 2003). According to one model organisational change should be as follows: 1) leadership, 2) research and measuring, 3) education, 4) reviewing the organisational culture, 5) follow-up and 6) evaluation of the change.
It is important to have specific tools when organising diversity, however, and these can be of various kinds, such as educational tools, evaluation tools, tools for follow-up, as well as indicators used to measure diversity in different ways. Measuring tools are important for several reasons, although it can be difficult to decide which measures are necessary in the organisation unless one comprehends how diffe-rentiated the organisation is. It is also of importance to know whether the leadership is functional. The question is, however, how these measures are to be conducted, what tools should be used and, perhaps more importantly, what exactly is being measured?
This short introduction brings us to the aim of this article, which is to develop and problematise quantitative measurements of diversity,
and to reflect on the substance of these measurements. Theoretical Starting Points
Diversity can be discussed from a quantitative as well as a qualitative perspective. Both these perspectives can arguably be connected with the concepts of structure and process in an organisational context. Westin (2001) argues that the concept of diversity per se can be seen as both a means and as an end. In applying the first the concept includes being a means to counter-act segregation. The latter, diversity as an end, entails that the concept is seen as something good in itself, a state of value in its own right. This is found in, for example, the funda-mental ideas of some liberal philosophers (cf. Roth 1996).
Westin (2001) discusses the concept of diversity and its quantitative and qualitative meanings. Quantitative diversity (the main focus of this article) deals with the proportions in relation to each other, such as the number of people of foreign descent in relation to those of Swedish descent. Quantitative diversity can also be understood in structural terms (cf. Omanovic 2003). This structural understanding of diversity arguably has an economic (historical) basis. It concerns the search for economic (and other soft-economic factors such as level of education and demography etc) explanations for, e.g. labour market segregation (Omanovic 2003, cf. Bevelander et al. 1997). The quantitative struc-tural view of diversity is, fundamentally, a type of head count, where explanations are sought for quantitative differences in, for example, employment between different groups. If the quantitative dimension can be seen as head counting, then the qualitative dimension may be seen as seeking an understanding beyond counting. Thus, in the quali-tative dimension, other factors are the main focus. Examples of these can be relationships, constructions or criticisms. The common denomi-nator here is process, as opposed to structures (cf. Omanovic 2003, Alvesson & Billing 1999 and 2000, Westin 2001). Let us therefore examine the three different examples of processes.
Firstly, when it comes to relationships an understanding of the roles that, for example, gender or ethnicity play in organisational relational processes of differentiation, is fundamental. Secondly, when focusing on constructions, one must strive to comprehend how diffe-rences are constructed and what meaning is assigned to these construc-tions (cf. Alvesson & Billing 1999 and 2000, Omanovic 2003). Lastly, the critical example is often based on a post-structural critique. It is concerned with placing our own time in a historical context and seeing historical structures in the light of current situations (Omanovic
2003). A good example of the critical school is the post-colonial critique which, somewhat simplified, is concerned with how former geo-political boundaries are applied to a current situation to create an understanding of processes of differentiation between groups and individuals.
This somewhat short, theoretical briefing aims to create an under-standing of the quantitative as well as the qualitative dimensions of the concept of diversity. The purpose of the above section is also to illustrate that in this article we will be mainly concerned with the intersection between quantity and quality, or if you so wish, between structure and process.
Measuring Possibilities
Many of the empirical indicators can be used relatively easily by many organisations, such as many of the public organisations discussed here. Small and medium sized companies, on the other hand, may need to limit the indicators in different ways.
Most of the indicators can be given a quantitative form by the use of statistics, polls and survey data. It is necessary that the instruments are general and comparable if they are to facilitate comparisons over time, between different sections of an organisation or between organisations. In this article we will deal exclusively with quantitative indicators in the sense that individuals form the basis of the measurements (we are, in other words, counting heads). While attitudes and activities are also quantifiable, they fall outside the scope of this article.
Quantitative analyses of the type undertaken in this article are generally results’ analyses, that is to say, they are to be related to the aims of diversity as set out in the organisation’s policy or plan. Malmö City administration’s “Plan for Diversity” (Plan of Measures to Promote Integration in the City Administration of Malmö) was unani-mously accepted by the City Council on the 16th December 1999. A
number of goals were set out in the Plan for Diversity, which the City administration is obliged to work towards. The goals that are relevant here are described in current research on diversity (see Broomé 2004, Kalonaityte 2004, Rönnqvist 2004, Schölin 2004). The first goal of interest here is that the City administration, both as a whole and in its functional parts, should reflect the population of the city. Secondly, the organisation should set an example and act as a role model concerning work on diversity. Finally, the services of the city should be changed as the population of the city changes, so as to guarantee good services to the population. In dealing with this, we chose to study the central office and the health and social service production.
There are two possible ways of studying the implementation of a policy. One is to study the results over a period of time, that is to say, before and after the measures spelled out in the policy are implemented, in order to see whether they lead in the direction of goal fulfilment. The other is either to compare the organisation with a similar organi-sation or with a part of the same organiorgani-sation where measures have not been taken, for example, a different City administration where no comparative work on diversity has been undertaken. Neither “before and after” studies nor comparative analyses fall exactly within the scope of this article, even though it will be possible to use the indicators constructed and tested on the City administration for these purposes. Instead we are interested in what the common goals, such as “reflecting the population” and “set an example” really mean when translated into quantitative indicators in an actual case. How can such an aim be specifically stated?
Creating Three Quantitative Dimensions1
The aforementioned goals for diversity can be interpreted/measured in at least three quantitative dimensions. Firstly, the goals can be seen from the perspective of the total dimension. The total dimension measures both the horizontal and vertical representation in the organisation. It contains measures of differences in the distribution of income between various groups and differences between various groups in connection to the work place in terms of different contracts of employment. This dimension answers the questions: How well is group X represented in different income groups? What does the connection to the work place look like for group X? Our analysis will consider inequalities of income distribution between different groups as well as how large a percentage of the various groups are undertaking temporary work, or temping, for an hourly fixed rate. Secondly, we look at what the goals can be understood as meaning, and to what extent the different groups are represented at the organisation’s top levels, the role model dimension. The role model dimension can be understood as calculating the proba-bilities of individuals of different ethnic groups of the population of Malmö:
1) holding specific positions and
2) attaining certain professional levels in the City’s administration. The role model dimension is illustrated by calculations of the income elite in the organisation of the City administration of Malmö. The probability or ‘chances’ that an individual from a specific ethnic group will be part of the income elite, taking into account factors such as
age, gender and level of education, will be calculated. By ‘income elite’ we mean those 1,200 people in the organisation that are receiving the highest salaries.
Thirdly, the goals can mean the representation of different groups in the City administration – both the organisation as a whole and its different sections – in relation to the population of the city, what we refer to as the Services dimension. The dimension measures what one might refer to as “diversity sensitivity” in the resource allocation of different groups. It can be measured by computing the relation between the ethnic representation of various service providers and the composition of the population. Thus, it can be estimated how well the staff reflects the population in the fields of, for example, healthcare, education and care. Further motivation for the services dimension is found in the City administration’s aim to reflect the city’s population as described in the Plan for Diversity (Broomé 2004, Kalonaityte 2004, Rönnqvist 2004, Schölin 2004, Broomé et al. 2004).
Method and Material
Methods
As a rule, diversity plans or policies include criteria for the evalu-ation of diversity with regard to three separate aspects. These aspects are representation, i.e. the reflection of the immigrated part of the population; the spread in the organisation with reference to positions, salaries etc; and the categorisation of immigrants so that backgrounds are broken down into regional groups (for instance Non-Europeans). In the assessment and review of the plan for diversity other compo-nents may also be included: measuring attitudes concerning diversity and indicators of activities such as seminars, discussions and education that aim to implement the policy. Indicators of management, invol-vement, role modelling, ideas on development, selection processes and indicators of union participation might also be included.
In the following analysis, the workforce of Malmö as it is repre-sented among the employees of the City administration will be studied. The population and the employees will be divided into categories according to, for example, country of birth, gender or income. The method employed in the analysis of the aforementioned three dimen-sions entails calculating the different categories’ distribution in the organisation as well as their probability of achieving, for example, a certain salary. Distribution relates to percentage amounts, while probability relates to the chance of an individual with a specific set of characteristics, for example, reaching a certain salary, also measured in percentages.
The Total Dimension
The Total Dimension is calculated in three different stages. Firstly, we calculate the median and maximum income for the various groups of employees. Secondly, we divide the employees into three income groups: the 20 percent of the employees with the lowest wages, the 20 percent that earn the highest wages and the 60 percent in between. If there are no differences in the income distribution between the groups, each separate group will have the allocation 20, 20 and 60 percent. Finally, by means of a logistic regression model we calculate the proba-bility of a number of constructed ‘standard persons’ being part of the highest income group. In the logistic regression model we are given a value (a log odds, see the Appendix) for each individual variable’s effect on the probability of belonging to the highest income group. Using these values it is possible to calculate the probability for, for example, a 51 year old Swedish woman with a university degree to belong to the highest income group. Where a logistic regression has been done, regions rather than nations have been considered in order to attain significant results. The log odds and the significant values are presented in their entirety in the Appendix.
The Total Dimension deals with the representation of different groups in the organisation. For this reason it is important to discuss the concept of representation, particularly as this concept is ambiguous and different interpretations yield different results.
While the concept of representation is first and foremost associated to political life it also has other meanings in the sense that a text can be a representation. In his definition of the concept, Stuart Hall (1997) points out that representation is about the connecting of meaning and language to culture:
Representation means using language to say something meaningful, or to represent, the world meaningfully, to other people. […] Representation is an essential part of the process by which meaning is produced and exchanged between members of a culture. It does involve the use of language, of signs and images which stands for or represents things (Hall 1997:15).
According to this interpretation, representation involves the concept of creating images in its widest sense. The problems of representation become very clear when an organisation uses the idea of reflecting the composition of the population in the composition of its staff as a driving force for ethnic diversity. One simply wants the organisation to stand for something else. This is also the meaning of the concept of representation as found in The Swedish National Encyclopaedia (http://www.ne.se/): “something that means something else”.
Representation, as was pointed out above, is mainly a political democratic idea with a long tradition and usage in Sweden. Representation has, for example, recently been discussed in connection with recruitment to colleges and universities. In this context repre-sentation refers to those recruited to colleges and universities having different social backgrounds in order to guarantee that personal experiences differ from those of ‘normal’ people’s experiences. And, of course, that people with different backgrounds have equal rights and equal access to colleges and universities.
The Role-model Dimension
The Role-model Dimension is measured by categorising the 1,200 people receiving the highest salaries in the City administration into a group referred to as the “income elite”. We chose the number of 1,200 people because there are approximately 1,000 managers in the administration of the local government of Malmö. It is a therefore way of accounting for these 1,000 managers, particularly as we have no specific information regarding position within the organisation. Firstly, we will establish the number of individuals from each group included in the income elite and thereafter calculate the probability that a number of ‘types’ will be part of this group.
The Role-model Dimension is constructed assuming that it is important that there are people from every group in the top layer of the organisation and that these individuals function as role-models for other members of the group. The assumption is that these people lead the way for others in that specific group in that they see that it is possible to reach a high position.
Another way of interpreting the Role-model Dimension is to regard the organisation as a whole as a role-model which can guide other organisations. That is to say, the organisation has a high number of employees born in various countries and these people also hold leading positions within the organisation.
Thus, it is possible to interpret the Role-model Dimension in different ways. In our work we have used the first presented inter-pretation. However, it is important to show how the measurement is interpreted when utilising this indicator.
The Services Dimension
The Services Dimension measures how well the staff composition of the City administration reflects the composition of the population and the particular needs of different groups. The measures are calculated in the following manner. Firstly, the relative size of each group is computed, for example, 71.1 percent of Malmö’s work force was born
in Sweden. Secondly, the same calculations are made for employees of the City administration of which 82.6 percent were born in Sweden. Thirdly, we divide the number of employees born in Sweden with the population born in Sweden minus one, (82.6/71.1) – 1 = 0.16. As a result we get a number that is between –1 and upwards, where 0 means that the number of employees with Swedish background perfectly reflects the population. A negative number means an under-represen-tation of this group in the organisation, and a positive number means an over-representation.
This indicator dimension builds on an assumption that the best service is created and provided within the same ethnic group. This assumption is worth contemplating as it is somewhat problematic. The problem concerns how service and ethnicity may be understood.
The National Encyclopaedia of Sweden defines the concept of
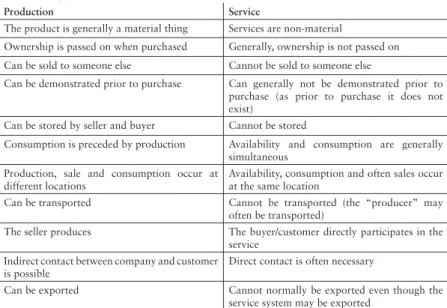
service as “[…] part measure or activity conducted in the purpose of serving customers, part control and maintenance of, for example, machinery”. What then characterises service in the sense of serving clients? In brief, services are non-material products that cannot be sold to any one else, nor can they be demonstrated as they do not usually exist prior to the purchase. Furthermore, services cannot be stored; production and consumption take place simultaneously in both time and space. More importantly, the client directly participates in the production and direct contact is often necessary (see Table 1).
Table 1: Typical differences between the production industry and service suppliers.
Production Service
The product is generally a material thing Services are non-material
Ownership is passed on when purchased Generally, ownership is not passed on Can be sold to someone else Cannot be sold to someone else
Can be demonstrated prior to purchase Can generally not be demonstrated prior to purchase (as prior to purchase it does not exist)
Can be stored by seller and buyer Cannot be stored
Consumption is preceded by production Availability and consumption are generally simultaneous
Production, sale and consumption occur at different locations
Availability, consumption and often sales occur at the same location
Can be transported Cannot be transported (the “producer” may often be transported)
The seller produces The buyer/customer directly participates in the service
Indirect contact between company and customer is possible
Direct contact is often necessary
Can be exported Cannot normally be exported even though the service system may be exported
Services presume some form of social interaction; if there is no provider and no recipient there are no services. Grönroos (1996) argues:
Due to the characteristics of the service – abstraction, activity and common production and consumption – the clients’ experience of quality largely arises during the common consumption and production in immediate contact with the production resources inclusive of the co-consumers (Grönroos 1996:31).
This means that in order to understand the concept of services in practice we must also understand the social interaction that arises between provider and recipient.
Representation and Different Types of Services
Here representation denotes the horizontal allocation of ethnic resources in the staff (rather than any hierarchical representation) that is analysed in the role model dimension. One can articulate this as competence. The representation of minorities is seen as the competence to provide services. Representation is predicted to provide possibilities of good social interaction and thereby better, or at least adequate, services to people of different ethnic backgrounds.
The largest groups of the population of Malmö are those born in Sweden, which accounts for 71 percent, and those born in the former Yugoslavia, which account for about four percent (Table 2). What is not shown in Table 2 is that the 50 smallest groups2 together make up
0.1 percent of the city’s population. This naturally raises the following questions: Is it relevant to speak in terms of services with regard to all groups of the population, or merely the largest? Is it possible to measure the service capacity/representation for the smallest groups of the population? Is it possible for an organisation such as the City administration to create representation and thereby services for all groups of the population?
Measuring the representation of larger groups of the population, such as the Swedish, Yugoslavian and Polish groups, is relatively simple since they consist of a larger number of individuals in both the population and the organisation. The problems arise when we measure the representation of smaller groups of the population or the groups of ‘others’, such as ‘the other Nordic countries’, referred to in Table 2. The category thus created becomes highly problematic; due to a forced merging of backgrounds the category becomes meaningless. We can speak of a categorical arbitrariness where the will to measure is far greater than the possibility to create meaningful categories.
There are a number of different ethnic groups in the former Yugoslavia that, we can assume, do not regard themselves as Yugoslavs
but, for example, Kosovo-Albanians, which actualises another problem of representation. Is it the country of birth or the subjectively experienced dimension - the ethnicity - that is relevant?
Will Kymlicka (1995) in his book on multicultural citizenship points to the fact that there are about 184 countries on planet Earth, while there are some 5,000 ethnic groups distributed over these 184 countries. Kymlicka attempts to get to the heart of the problem. What is it we speak of when we mention ethnic diversity? What is it we really measure when we attempt to measure representation and link this with services? One important dimension of the discussion about
represen-tation is what kind of services the population need and which services are offered by the City administration. A good many deal of the services offered by a City administration involve the exercise of authority, such as issuing permits for construction projects, rather than providing pure services in the form of care for the elderly. In many cases the line between exercising authority and supplying services is rather vague. This distinction is important from a representational perspective, however. A fundamental assumption in the exercise of authority is that it is based on equal treatment, the rule of law and the integrity of the civil servant in relation to group-specific interests, for example, in the form of ethnic or other representations in the population. A relevant question to ask regarding government services is: If everyone is to be treated equally, is it at all interesting or even relevant to discuss the matter in terms of ethnicity or any other representation?
The question of representation can seem more relevant when it comes to the question of service supply and availability. Competence in exercising authority is based on knowledge of different laws and rules, which are to be applied in the individual case. Competence in services supply also involves other components, not just knowledge that has to do with the contents of the services but also other knowledge and skills relating to social interaction, such as language skills and cultural competence. Even though a representational strategy may seem desirable, difficulties remain in matching a diverse population with a diverse staff. For example, how is a representative match to be made between pupils and teachers in a class of students from 20 different countries? Reaching a representative point of view would seem to be almost impossible for the organisation to manage and carry through.
Ethnicity in Brief
In some ways the concept of ethnicity concerns the classification of people (Eriksen 1993:12, Barth 1981:200 in O’Dell 2002). The word ethnicity stems form the Greek word ethnos, and springs from the concept of ethnikos that originally meant heathen (Eriksen 1993:12).
During Antiquity the point of ethnicity was that only “the others” could have an ethnicity. Ethnicity was, so to speak, a principle of exclusion. The concept retained this meaning up to the mid-1800s, when the term then started to move towards the concept of race. The current meaning of ethnicity stems from the mid-1960s. The term ethnicity then took on a new meaning: “the positive feelings of belonging to a cultural group” (Spoonley 1993 in Guibernau & Rex 1997, Eriksen 1993:12). Today the concept has the meaning of belonging, identity, a common culture, history and common traditions. Ethnologist Tom O’Dell (2002) argues that there are pros as well as cons to using the concept of ethnicity in this fashion. The advantages he points to are based in the constructionist meaning of the concept. From this perspective the term is connected with the construction of identity. Ethnicity from this perspective becomes something that we constantly construct and reconstruct through lived experience. However, this positive feeling of belonging is often perceived as both static and unchangeable through, for example, stereotyping and essentialising, which according to O’Dell is one of the drawbacks of the ethnicity concept.
Do, then, the tables in the next section list identities? The sponta-neous answer would be no. With the statistical data available today, and that we use here, it is only possible to identify countries of birth, not ethnicity. Consequently, the foundation that these measures of diversity are based on can be criticised. Rather than speaking of diversity in the sense of ethnicity, we speak of diversity in the sense of country of birth. This is not necessarily negative, but it is an important point to make. It could be claimed that the quantifiable data is almost of an anecdotal character. This means that although it may be important for individuals to be able to relate to their place of birth, the country of origin is not of conclusive importance for ethnicity. Moreover, country of birth should not be conclusive for a person’s identity, if identity is a construction that is constructed and reconstructed during a person’s life span.
Certain other problems arise, as we have mentioned earlier, when we measure the representation of small groups in an organisation such as the City administration. The statistician is forced to add the groups together, sometimes to the extent that the categories created are anything but representative. This is the case with our category “the 50 smallest population groups” made up of countries of birth from all continents. Such categorisation neither reflects a personal construction of identity nor the existence of clear and separate ethnicities in terms of belonging. It is easier to associate to older concepts of ethnicity, such as “heathens” or “the others”, or possibly to some other meaningless categorisation.
Discussing concepts of ethnicity and culture involves a number of different risks. This does not only concern simple categorisations. Fundamentally, it is identities, or rather constructions of identity, that are discussed in these concepts. A hands-on categorisation of identities can lead to a static view of these identities. The danger of this is that identities are presented as non-changeable and essential, which cannot be empirically shown. On the contrary, it is our opinion that identities change continually and by processes (cf. Ehn & Löfgren 2001, Roth 1996). In the section below we want to connect the above discussion around services, representation and ethnicity with an organisational praxis in order to show the real problems of ‘head counts’.
When we speak of ethnic diversity in terms of services it can be interesting to look at one of the more ‘service burdened’ activities of the administration. In these activities the discourse on services becomes extra clear and relevant. One example of this is the ‘Council for Diversity in Professional Life’ which writes that “the schools, health care and public services of the future must be able to answer to the needs of a society with a diversity of people from different countries and cultures” (Rådet för mångfald i arbetslivet, 2002).
In the next section we will show that there are differences in the ethnic representation of the educational and care sectors in different boroughs of Malmö (see Table 13). As long as we restrict our discu-ssion to the largest groups there are few (methodological) problems; counting heads and representation are relatively easy to measure and discuss. However, the problems accumulate when analysing the smaller groups, such as the 50 smallest groups which together amount to 185 people. These are in turn represented by four employees. According to the services discourse these four people are expected to improve the services for 185 people, which can only be recognised as highly proble-matical. The question that must be posed is how to interpret this. Is it even a relevant interpretation? According to the services discourse it is indeed, but as a practical problem it must be regarded as a highly dubious interpretation.
A number of interesting and relevant questions can be posed. Does an increased representation of people of foreign origin lead to better services? Does the quality of relations increase due to the improved representation of groups of foreign origin?
Social interaction is an important part of all personal services – including care. This was also concluded by the White Paper on Treatment in the Care Sector.3 In this investigation considerable
short-comings in the treatment of handicapped people were acknowledged. Many felt humiliated, controlled and questioned, especially in their contacts with different authorities. The White Paper argues that these
deficiencies are partly due to a gap between expectations and reality, but that these deficiencies also have political causes. Regardless of the causes of these deficiencies we can, with the aid of the investigation in the White Paper, conclude that personal treatment is an important factor in the care of both elderly people and people with some kind of handicap. This treatment can also be linked with ethnic diversity. An increased diversity in the care organisations might lead to a better treatment of individuals of different ethnic background. But, and this is an important but, can this be shown or proven statistically? In the statistics that we have used the answer is “no”. We can illustrate the under-representation of a number of different population groups in the City administration’s care organisations, but cannot claim or assume that this has consequences for the care of the elderly. Is it possible to draw any conclusions about good or otherwise treatment from statistics and quantitative measures? At best the answer to that can only be extremely hesitant. ‘Counting heads’ says very little or even nothing about how differences are constructed (for a discussion on gender and organisation from a constructivist perspective, see Alvesson and Billing 1999).
There are real problems of matching in, for example, the case of the four employees in the organisation that represents the 50 smallest population groups. The question is partly whether the match is necessary for good organisational services capability, and partly what such a match might lead to? The first part of the question hints that good treatment (read good services) is only possible if there is a successful ethnic representation. But what is there to say that good services cannot be provided over or between ethnic groups? A good guess is that good services or treatment between different ethnic groups is relatively quickly identified or communicated. Ethnic and cultural differences are a question of ethnic and cultural identities. An exagge-rated ethnic match can lead to an essentialist view of ethnicity where ethnicity is seen as non-changeable, or as ‘ethnification’.
There are also problems of integrity in care, and these can be summed up in the concept of anonymity. According to the law on healthcare (Hälso- och sjukvårdslagen 1982:763) clients should be guaranteed anonymity and thus be treated with confidentiality. We can only speculate on what might occur if employees of different ethni-cities were given increased scope to manoeuvre in handling clients of the same ethnicity. If we look at the five or ten largest groups in the city and at the administration the problems are small, but if we look at the 50 smallest groups or even the 100 smallest groups of the population we can discern greater complications. What happens if a
person is cared for by a person from the same ethnic group? These groups are not particularly large in Malmö and we can therefore assume that strong bonds and knowledge of each other exist in these groups. In cases like this could the organisation guarantee the mainte-nance of personal confidentiality?
Material
The material used in this study is data on Malmö’s population between the ages of 20 and 64, i.e. the city’s workforce, taken from Statistics Sweden’s LOUISE database, as well as the council’s data on employees of the local government of Malmö collected during the autumn of 2001. SCB has connected the anonymous personal infor-mation from the City administration of Malmö to a selection of data in the LOUISE database (see Bakgrundsfakta till Arbetsmarknads- och
Utbildningsstatistiken LOUISE, 2002).
The variables from LOUISE used here are age, gender, education, country of birth, year of immigration, employment and largest source of income. The variable age is taken as being the age on 31st of
December each year, in our case, the 31st of December 2001. Education
is measured by means of SUN, Swedish Educational Nomenclature, which supplies information about the duration and orientation of the education. This article will only consider the duration of the education.
Country of birth is registered according to the principle that a person’s country of birth is documented with the name of the country/ state at the time of the person’s birth, even if this name is later changed or the state ceases to exist. This becomes relevant in cases such as former Yugoslavia, i.e. all those born prior to the division of Yugoslavia belong to former Yugoslavia. Those born after the country’s division belong to either of the new state of Bosnia-Herzegovina.
We have selected 14 countries that we analyze further; all other countries are categorized into regions like “Other Africa”. These regions are created in accordance to SCB’s categorization of regions. One of the regional categorizations are “Other EU”, here we use the definition EU15. For a complete table of the countries and categoriza-tions see table A1 in Appendix.
The most recent year of immigration counts as the year of immigration. The employment variable builds on data collected during the month of November. In order to count as gainfully employed a person must have performed paid work of at least one hour per week during November. Income is taken as the largest source of income as registered in the employment register.
As always there are shortcomings in the statistics, one example being the employment variable which is based on a one month survey. This may mean that the material includes people who are registered as not gainfully employed but still work within the City administration of Malmö.
The City of Malmö and the City Administration – numbers in short
In 2001, the population of Malmö, Sweden’s third largest city, was 259,597. The age composition of the population forms an age pyramid with the top made up of a smaller number of elderly people and a base of a larger number of youths. During the same year, 64 percent of the population, or 157,873 citizens, were part of the labour force; that is to say between 20 and 64 years of age.
The largest employer in Malmö is the City administration, and during the year in question the organisation had 21,947 employees distributed over 23,747 positions (circa 2,000 people thus held more than one position in the organisation). During the same year, the city as a whole had 134,000 positions.
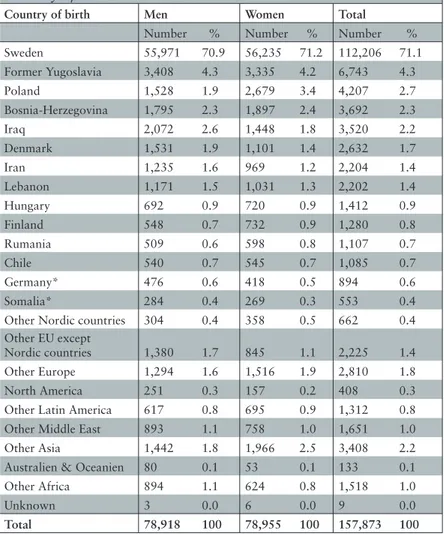
Table 2 gives an overview of Malmö’s workforce in 2001. The largest countries, plus Germany and Somalia, are accounted for separately, while the others are accounted for regionally. Close to 30 percent of the working population in Malmö were of foreign origin, from 161 different countries. The largest groups of people of foreign origin were from Former Yugoslavia (see above the discussion concerning the statistical problems of categorisation with reference to country of birth), Poland, Bosnia-Herzegovina and Iraq. The large number of people of foreign origin in Malmö both makes and has made the city an interesting object of study (cf. Bevelander et al. 1997, 2002a and 2002b, Broomé 2004, Kalonaityte 2004, Ristilammi 1994 and 2003, Andersson et al. 2004, Rönnqvist 2004, Stigendal 1999, Schölin 2004).
It is clear that Malmö is a segregated city (Stigendal 1999), not only in terms of housing, but also in terms of the labour market; of having or not having a job. Table 3 shows that 65 percent of men and 63 percent of women in the workforce are gainfully employed. People born in Sweden have the highest employment frequency with 74 percent and 73 percent respectively. People of Iraqi origin have the lowest employment frequency with 21.5 percent and 10.8 percent respectively, and Somali origin people represent 22.2 percent and 21.2 percent respectively. The highest percentage of employment among immigrated groups is seen among the people of Finnish, German origin and Latin American origin.
Table 2: Population 20-64 year (the work force) in Malmö. Country of birth and Gender.
Country of birth Men Women Total
Number % Number % Number % Sweden 55,971 70.9 56,235 71.2 112,206 71.1 Former Yugoslavia 3,408 4.3 3,335 4.2 6,743 4.3 Poland 1,528 1.9 2,679 3.4 4,207 2.7 Bosnia-Herzegovina 1,795 2.3 1,897 2.4 3,692 2.3 Iraq 2,072 2.6 1,448 1.8 3,520 2.2 Denmark 1,531 1.9 1,101 1.4 2,632 1.7 Iran 1,235 1.6 969 1.2 2,204 1.4 Lebanon 1,171 1.5 1,031 1.3 2,202 1.4 Hungary 692 0.9 720 0.9 1,412 0.9 Finland 548 0.7 732 0.9 1,280 0.8 Rumania 509 0.6 598 0.8 1,107 0.7 Chile 540 0.7 545 0.7 1,085 0.7 Germany* 476 0.6 418 0.5 894 0.6 Somalia* 284 0.4 269 0.3 553 0.4
Other Nordic countries 304 0.4 358 0.5 662 0.4 Other EU except
Nordic countries 1,380 1.7 845 1.1 2,225 1.4 Other Europe 1,294 1.6 1,516 1.9 2,810 1.8
North America 251 0.3 157 0.2 408 0.3
Other Latin America 617 0.8 695 0.9 1,312 0.8 Other Middle East 893 1.1 758 1.0 1,651 1.0 Other Asia 1,442 1.8 1,966 2.5 3,408 2.2 Australien & Oceanien 80 0.1 53 0.1 133 0.1
Other Africa 894 1.1 624 0.8 1,518 1.0
Unknown 3 0.0 6 0.0 9 0.0
Total 78,918 100 78,955 100 157,873 100
* Germany represents an old immigrant group in Sweden. This group also has a relatively stable position in the Swedish labour market. Somalia represents a new immigrant group in Sweden with a weak position in the labour market.
Malmö’s largest employer is the City administration; in 2001 the organisation had 21,947 employees. Despite the fact that the City administration has been the object of considerable academic attention, the organisation as a whole is not well studied, although some evalua-tions and studies of specific parts have been conducted (cf. Broomé 2004, Kalonaityte 2004, Rönnqvist 2004, Schölin 2004).
Table 3: Percentage of employed in the work force in Malmö. Country of birth and Gender.
Men Women
Country of birth Percent Percent
Sweden 74.1 73.0 Former Yugoslavia 45.1 40.1 Poland 52.4 51.9 Bosnia-Herzegovina 47.0 40.2 Iraq 21.5 10.8 Denmark 33.4 42.1 Iran 44.8 38.1 Lebanon 31.0 11.8 Hungary 46.0 45.8 Finland 54.0 63.3 Rumania 52.3 50.3 Chile 55.0 49.5 Germany 60.3 52.2 Somalia 22.5 21.2
Other Nordic Countries 58.6 55.9 Other EU except Nordic countries 49.6 45.9
Other Europe 49.8 43.4
North America 45.8 38.9
Other Latin America 53.3 50.8
Other Middle East 33.8 19.0
Other Asia 43.4 39.5
Australia & Oceania 41.3 37.7
Other Africa 39.9 34.1
Total 65.0 63.5
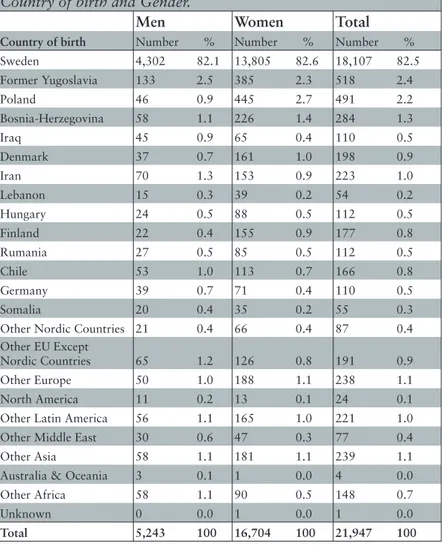
It can be seen from Table 4 that of all the employees in the City administration in 2001, approximately 76 percent were women. Thus, the City administration is an organisation strongly dominated by women. Employees of Swedish origin also emphatically dominate the organisation, with 82.5 percent of the employees being of Swedish origin. As in the population of Malmö, the two largest groups are of Yugoslavian and Polish origin. The fact that more women than men are employed in the organisation holds for all groups, except those of Australian origin.
Table 4: Employed in the City administration of Malmö. Country of birth and Gender.
Men Women Total
Country of birth Number % Number % Number %
Sweden 4,302 82.1 13,805 82.6 18,107 82.5 Former Yugoslavia 133 2.5 385 2.3 518 2.4 Poland 46 0.9 445 2.7 491 2.2 Bosnia-Herzegovina 58 1.1 226 1.4 284 1.3 Iraq 45 0.9 65 0.4 110 0.5 Denmark 37 0.7 161 1.0 198 0.9 Iran 70 1.3 153 0.9 223 1.0 Lebanon 15 0.3 39 0.2 54 0.2 Hungary 24 0.5 88 0.5 112 0.5 Finland 22 0.4 155 0.9 177 0.8 Rumania 27 0.5 85 0.5 112 0.5 Chile 53 1.0 113 0.7 166 0.8 Germany 39 0.7 71 0.4 110 0.5 Somalia 20 0.4 35 0.2 55 0.3
Other Nordic Countries 21 0.4 66 0.4 87 0.4 Other EU Except
Nordic Countries 65 1.2 126 0.8 191 0.9
Other Europe 50 1.0 188 1.1 238 1.1
North America 11 0.2 13 0.1 24 0.1
Other Latin America 56 1.1 165 1.0 221 1.0
Other Middle East 30 0.6 47 0.3 77 0.4
Other Asia 58 1.1 181 1.1 239 1.1
Australia & Oceania 3 0.1 1 0.0 4 0.0
Other Africa 58 1.1 90 0.5 148 0.7
Unknown 0 0.0 1 0.0 1 0.0
Total 5,243 100 16,704 100 21,947 100
In Table 5 we can see the representation of different groups in the organisation as a whole. The measurements in the table are constructed in such a way that a positive number symbolises that a group is over-represented and conversely, that a negative number indicates that a group is under-represented. Zero means that the relative size of the group is the same in the organisation and the city. The table shows that both men and women born in Sweden are over-represented in the organisation. Other over-represented groups are men born in Chile,
Table 5: Representation for the City administration as a whole (Percentage of employees divided by percentage of population minus one). Country of birth and Gender.*
Country of birth Men Women Total
Sweden 0.2 0.2 0.2 Former Yugoslavia -0.4 -0.5 -0.4 Poland -0.5 -0.2 -0.2 Bosnia-Herzegovina -0.5 -0.4 -0.4 Iraq -0.7 -0.8 -0.8 Denmark -0.6 -0.3 -0.5 Iran -0.2 -0.3 -0.3 Lebanon -0.8 -0.8 -0.9 Hungary -0.4 -0.4 -0.4 Finland -0.4 0.0 0.0 Rumania -0.2 -0.4 -0.3 Chile 0.4 0.0 0.1 Germany 0.2 -0.2 -0.2 Somalia 0.0 -0.3 -0.3
Other Nordic countries 0.0 -0.2 0.0 Other EU except Nordic countries -0.3 -0.3 -0.4
Other Europe -0.4 -0.4 -0.4
North America -0.3 -0.5 -0.7
Other Latin America 0.4 0.1 0.3
Other Middle East -0.5 -0.7 -0.6
Other Asia -0.4 -0.6 -0.5
Australia & Oceania 0.0 -1.0 -1.0
Other Africa 0.0 -0.4 -0.3
*Men and women are compared separately, which in some cases leads to signifi cant differences between their respective representational measurement and the total measurement for the group, see for example Chile and Finland.
Germany and Other Latin America. When it comes to women, only those born in Sweden are over-represented, while all other groups are under-represented, except women born in Chile and Finland where we see a perfect match. Finally, we can see that men born in Somalia, Other Nordic countries, Australia & Oceania as well as Other Africa have also achieved the perfect match. The groups showing the most severe under-representation are men and women born in Iraq, Lebanon, Other Middle East and women from Australia.
Diversity in the City Administration of Malmö
The Total Dimension
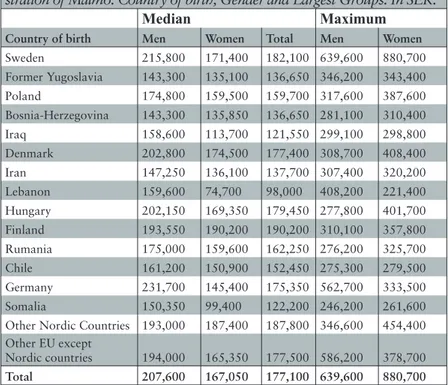
As mentioned above, the total dimension is made up of two parts, income and connection to the work place. Table 6 presents the median and maximum income for different groups and is divided according to gender.
Table 6: Median and Maximum income in the City admini-stration of Malmö. Country of birth, Gender and Largest Groups. In SEK.
Median Maximum
Country of birth Men Women Total Men Women
Sweden 215,800 171,400 182,100 639,600 880,700 Former Yugoslavia 143,300 135,100 136,650 346,200 343,400 Poland 174,800 159,500 159,700 317,600 387,600 Bosnia-Herzegovina 143,300 135,850 136,650 281,100 310,400 Iraq 158,600 113,700 121,550 299,100 298,800 Denmark 202,800 174,500 177,400 308,700 408,400 Iran 147,250 136,100 137,700 307,400 320,200 Lebanon 159,600 74,700 98,000 408,200 221,400 Hungary 202,150 169,350 179,450 277,800 401,700 Finland 193,550 190,200 190,200 310,100 357,800 Rumania 175,000 159,600 162,250 276,200 325,700 Chile 161,200 150,900 152,450 275,300 279,500 Germany 231,700 145,400 175,350 562,700 333,500 Somalia 150,350 99,400 122,200 246,200 261,600 Other Nordic Countries 193,000 187,400 187,800 346,600 454,400 Other EU except
Nordic countries 194,000 165,350 177,500 586,200 378,700
Total 207,600 167,050 177,100 639,600 880,700
The median income for all employees is SEK 177,100. The groups whose median income exceeds this are Sweden, Denmark, Hungary, Finland, Other Nordic Countries and Other EU countries. Employees born in Finland and other Nordic countries have a higher median income than those born in Sweden. The groups with the lowest median income are those born in the Lebanon and Somalia. It is worth noting that it is mainly Lebanese and Somali women that have a low median income.
A recurring pattern is that men have a higher median income than women in their respective groups. Despite this, out of ten of the groups studied the highest wage-earner is a woman. In Table 6 we can see that it is mainly women from the Nordic countries that have the
highest median incomes, together with those from Hungary and the EU countries; a picture that almost completely reproduces itself when we look at maximum income. In the interpretation of this table it is important to note that we do not take any other variables, such as different age distribution within the groups, the year of employment, level of education and year of immigration, into consideration. Whether a person is employed full-time or part-time is not taken into account. This means that the median for women may be underesti-mated due to the tendency of women to work part-time to a greater extent. This means although they provide a good first view, the median
and maximum measures are rather crude tools that would best be complemented by other tools or measures that take other variables into consideration. In other words the median and maximum income can’t stand alone. The same problem will be discussed later on when
the connection to the workplace is analysed for people born abroad. It will be shown that, to a larger extent than native Swedes, this category has a fixed hourly pay.
In Table 7, all employees have been divided into three different income groups that are made up of the top 20, middle 60 and bottom 20 percent. If there is no difference in the income distribution between the groups then each group should have an allocation of 20, 60 and 20 percent of income. When it comes to gender, Table 7 shows that the uneven distribution of income also holds here. The allocation for men is 14, 51.6 and 34.4 percent respectively, while the distribution for women is 21.9, 62.6 and 15.5 percent respectively.
Looking at the gender distribution within each group, we can see that it is only the employees born in Poland and Other Nordic Countries that has a higher percentage of men than women in the lowest income group. The opposite is seen in the highest income group, where only employees born in Bosnia-Herzegovina have a higher percentage of women than men, albeit with a difference of only 0.1 percent. In the middle income group, there are eight groups where women dominate and eight groups where men dominate. It must be added that one of the reasons for the high percentages in the lowest 20 percent may be due to problems of data. In short, this means that people with fixed, hourly rates of pay may also draw a salary from another employer. It is possible that this is the reason why the upper limit for the 20 percent who earn the least is as low as 84,500 SEK.
Furthermore, it is interesting to note that employees born in Denmark, Finland, Germany and Other Nordic Countries all have a lower percentage in the lowest income group than employees born in Sweden, and that Hungary has an equal percentage to Sweden. In
addition, employees born in the EU, with the exception of the Nordic countries and Germany, have a higher percentage in the highest income group than employees born in Sweden. In the middle income group, nine groups have a higher figure than employees born in Sweden, and these are employees born in Poland, Bosnia-Herzegovina, Iraq, Denmark, Hungary, Finland, Rumania, Chile and the other Nordic countries.
Table 7: Employed in the City administration divided in three groups of income. Country of birth and Gender in percent.
Country of birth Men Women Total Men Women Total Men Women Total
Sweden 12.5 20.8 18.8 49.1 62.4 59.3 38.4 16.8 21.9 Yugoslavia 27.1 34.8 32.8 63.2 56.6 58.3 9.8 8.6 8.9 Poland 26.1 23.6 23.8 54.3 66.5 65.4 19.6 9.9 10.8 Bosnia-Herzegovina 15.5 28.8 26.1 82.8 69.5 72.2 1.7 1.8 1.8 Iraq 24.4 38.5 32.7 66.7 60.0 62.7 8.9 1.5 4.5 Denmark 10.8 16.1 15.2 54.1 70.2 67.2 35.1 13.7 17.7 Iran 24.3 30.7 28.7 57.1 59.5 58.7 18.6 9.8 12.6 Lebanon 20.0 53.8 44.4 66.7 46.2 51.9 13.3 0.0 3.7 Hungary 4.2 22.7 18.8 70.8 64.8 66.1 25.0 12.5 15.2 Finland 0.0 11.6 10.2 77.3 70.3 71.2 22.7 18.1 18.6 Rumania 18.5 25.9 24.1 66.7 64.7 65.2 14.8 9.4 10.7 Chile 26.4 28.3 27.7 64.2 67.3 66.3 9.4 4.4 6.0 Germany 2.6 22.5 15.5 51.3 63.4 59.1 46.2 14.1 25.5 Somalia 30.0 48.6 41.8 65.0 48.6 54.5 5.0 2.9 3.6 Other Nordic Countries 28.6 9.1 13.8 47.6 72.7 66.7 23.8 18.2 19.5 Other EU except Nordic Countries 16.9 21.4 19.9 49.2 54.0 52.4 33.8 24.6 27.7 Total 14.0 21.9 20 51,6 62.6 60 34.4 15.5 20
The disadvantage of the type of analysis made in Tables 6 and 7 is that we are not controlling any other variable, such as age, time spent in Sweden, level of education and years of employment in the organisation. We therefore have created a logistic regression model measuring the probability of different groups being in the highest income group. In the logistic regression we use the variables gender, age, level of education and number of years in Sweden. Unfortunately, data concerning length of employment in the organisation is lacking.
Lowest 20 % From 0 - 84,500 SEK Medium 60 % From 84,600 - 237,000 SEK Highest 20 % From 237,000 SEK & upwards
The results of the logistic regression are presented in full in Table A2 in the Appendix, where the log odds as well as the significance appear. The log odds are used to calculate the probability of different ‘standard people’ being part of the top income group.
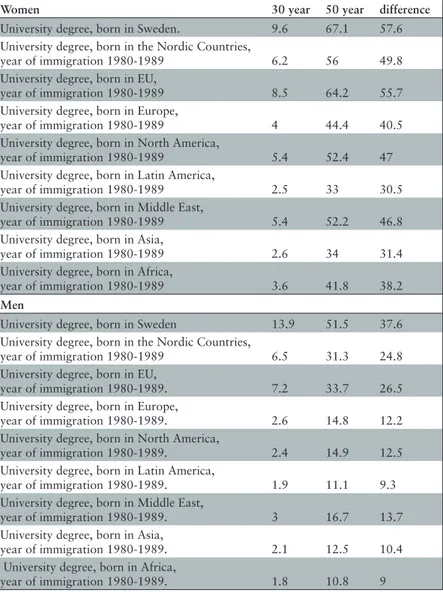
Table 8: Probability of belonging to the best paid 20 percent of the employees in the City administration, in percentages.
Women 30 year 50 year difference
University degree, born in Sweden. 9.6 67.1 57.6 University degree, born in the Nordic Countries,
year of immigration 1980-1989 6.2 56 49.8 University degree, born in EU,
year of immigration 1980-1989 8.5 64.2 55.7 University degree, born in Europe,
year of immigration 1980-1989 4 44.4 40.5 University degree, born in North America,
year of immigration 1980-1989 5.4 52.4 47 University degree, born in Latin America,
year of immigration 1980-1989 2.5 33 30.5 University degree, born in Middle East,
year of immigration 1980-1989 5.4 52.2 46.8 University degree, born in Asia,
year of immigration 1980-1989 2.6 34 31.4 University degree, born in Africa,
year of immigration 1980-1989 3.6 41.8 38.2
Men
University degree, born in Sweden 13.9 51.5 37.6 University degree, born in the Nordic Countries,
year of immigration 1980-1989 6.5 31.3 24.8 University degree, born in EU,
year of immigration 1980-1989. 7.2 33.7 26.5 University degree, born in Europe,
year of immigration 1980-1989. 2.6 14.8 12.2 University degree, born in North America,
year of immigration 1980-1989. 2.4 14.9 12.5 University degree, born in Latin America,
year of immigration 1980-1989. 1.9 11.1 9.3 University degree, born in Middle East,
year of immigration 1980-1989. 3 16.7 13.7 University degree, born in Asia,
year of immigration 1980-1989. 2.1 12.5 10.4 University degree, born in Africa,
In facilitating a logistic regression analysis we have been forced to add together country of birth into regions in order to reach signi-ficant results. An analysis that focuses on the separate country of birth is not possible due to the small number of employees born in each country. Furthermore, two separate regression models have been developed, for women and men respectively, because women and men are often employed in different sectors of the organisation. The logistic regression takes a number of variables into account that we could not account for in the measurements presented in Tables 6 and 7. The drawback of the logistic regression is precisely that we cannot be more specific than region of birth. Therefore, it can be said that logistic regression is better suited to large organisations, as smaller organisa-tions will encounter greater difficulties in terms of significance.
Before presenting the different ‘types’ of people, we would like to briefly comment on the significance of the results. Significant results have been attained for age, level of education, born in Europe outside of the EU, born in Latin America, born in Asia, and the year of immigration for both women and men. In addition, the results are significant for men from the Middle East and Africa. The results for the other variables are not significant and should therefore be interpreted with caution. In the following presentation of the ‘types’ probabilities are indicated even though some of the results are not significant.
In Table 8, the probability of being in the top 20 percent with regard to income is shown by means of creating four ‘typical’ people from each region of origin, all with the same level of education but of different genders and ages. The last column of the table shows the difference in the probability of being part of the top 20 percent, depending on whether the person is thirty or fifty years of age.
Evidently, the probability of belonging to the 20 percent of employees that earn the most in the organisation is greater for fifty year old women than for men of the same age. It is also apparent that of people born in Sweden, both women and men have a vastly superior chance of being in the top income group – and this holds for both 30 year olds and 50 year olds. Besides individuals born in Sweden, the three groups with the highest probability are those born in the other Nordic countries and the EU – which this holds for both men and women. The groups with the lowest probability are those born in Latin America and Asia, and this also holds for both men and women. The probability of being included in the top income group increases significantly with age. The difference for women born in Sweden is 57.6 percent, and the group closest to this is women born in EU
countries. This difference can be interpreted as an indicator of how income develops according to age, or, in other words, the higher the positive difference, the better the income development. The lowest differences, and therefore the worst income development, are for women born in Latin America and Asia, as well as men born in Latin America and Africa.
An important concluding comment is that the probability of people of foreign origin occupying the higher income groups would seem to be overrated. This is due to the fact that we have used Swedish education as a base for the logistic regression. Thus, our measurements in fact measure the effect of Swedish education on the probability of being included in the best paid 20 percent. In this regard the effect of Swedish education can be assumed to be greater than the effect of foreign education, therefore the probability of people of foreign origin occupying this group would seem to have been overestimated, as most people belonging to this group have a foreign education. (For a discu-ssion on the value of Swedish and foreign education see Berggren & Omarsson, 2001).
Connection to the Workplace
The second part of the total dimension is the connection to the workplace. It is possible to divide the staff into two separate groups according to terms of contract, where people on fixed hourly rates make up the first group, and employees with other terms of contract make up the second group.
The first step of the analysis is to investigate the relative distribution in the respective groups with reference to gender and country of origin. The second step is to estimate the probabilities of being employed on a fixed hourly rate using a logistic regression model. In the analysis it is assumed that fixed hourly rate is a form of employment with the weakest connection to the organisation. However, the analysis does not show whether the individual is on an hourly rate by choice or necessity.
Table 9: Weakest position at the work place. Country of birth and Gender (percent).
Country of birth Men Women Total
Sweden 9.9 10.2 10.1 Former Yugoslavia 21.1 23.3 22.7 Poland 15.6 14.2 14.3 Bosnia-Herzegovina 13.8 27.9 25.0 Iraq 11.1 17.7 15.0 Denmark 10.8 8.7 9.1 Iran 28.6 31.1 30.3 Lebanon 13.3 28.6 24.0 Hungary 4.2 12.6 10.8 Finland 4.5 7.2 6.9 Rumania 22.2 17.9 18.9 Chile 25.0 20.4 21.8 Germany 7.7 10.0 9.2 Somalia 20.0 54.8 41.2
Other Nordic Countries 19.0 10.8 12.8
Other EU except
Nordic Countries 6.3 11.2 9.5
Total 11.2 11.8 11.6
Table 9 shows that 11.6 percent of the employees of the City adminis-tration are employed as temporary staff with a fixed hourly rate. The number is slightly higher for women than men. Looking at the gender distribution within each group, in five groups a greater number of men are employed as temporary staff on a fixed hourly rate as compared to women.
The number of Swedish born people on temporary contracts is only 10.1 percent, and only three groups have a lower number; these being people born in Denmark, Finland and the other EU countries. The groups with the highest number of temporary contracts with fixed hourly rates are those born in Somalia, Iran and Bosnia-Herzegovina. It is also worth noting that more than half of the women born in Somalia and employed by the City administration are on temporary contracts. Among the men, those born in Chile and Iran have the highest percentages.
It is interesting to note that data concerning connection to the workplace is scarce in the Swedish context. However, developments during the 1990s point to a change in the organisation of work in Sweden. Stretching things somewhat, the development points to work increasingly being organised according to the principle of a smaller core of permanently employed staff and a large number of people who
either work as volunteers or are forced into forms of employment that are more insecure than the classic permanent contract.
The factors that most often affect the probability of being on a temporary contract is age – the younger the person the higher the probability – as well as time spent in Sweden – the shorter the period the higher the probability (see Table A3 in the Appendix). ‘Types’ will be not examined here as they complicate the results insofar as it is possible that there is a certain degree of free choice, i.e. some indivi-duals may choose to be on a temporary contract in order to complete their education or because they receive additional income from some other form of employment.
The Role-Model Dimension
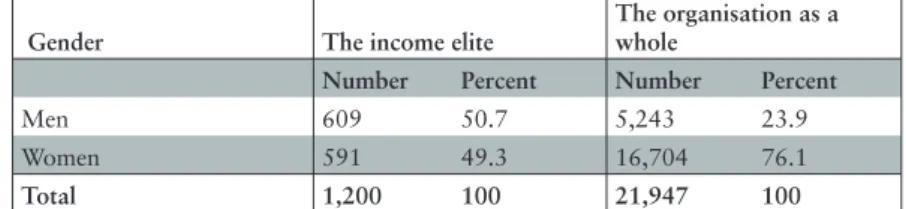
The role-model dimension is one that shows whether the organisation includes role models for different groups. For example, it would be of interest to know how many superior positions in the City adminis-tration are occupied by people of Iraqi origin. Unfortunately, we are not in possession of such detailed information. Instead we have created a category that we refer to as the ‘income elite’, which consists of the 1,200 individuals in the organisation receiving the highest wages in the City administration organisation. The income elite can be assumed to include higher managerial positions, and also well-paid specialists and loyal long-term employees.
Table 10: The income elite in comparison with the organisation as a whole. Gender. Number and Percent.
Gender The income elite
The organisation as a whole
Number Percent Number Percent
Men 609 50.7 5,243 23.9
Women 591 49.3 16,704 76.1
Total 1,200 100 21,947 100
In Table 10 it is seen that this group displays an even gender distri-bution, in spite of approximately three-quarters of the employees being women. For the men this means that around every tenth man is among the 1,200 highest earners - who earn between SEK 305,400 and SEK 880,700 per annum. Furthermore, it means that men are more likely to belong to the income elite than women.
Table 11: The income elite in comparison with the organisation as a whole. Country of birth. Number and Percent.
The income elite The organisation as a whole
Country of birth Number Percent Number Percent
Sweden 1,121 93.4 18,107 82.5 Former Yugoslavia 5 0.4 518 2.4 Poland 8 0.7 491 1.3 Bosnia-Herzegovina 1 0.1 284 1.3 Iraq 0 0.0 110 0.5 Denmark 7 0.6 198 0.9 Iran 6 0.5 223 1.0 Lebanon 1 0.1 54 0.2 Hungary 2 0.2 112 0.5 Finland 8 0.7 177 0.8 Rumania 4 0.3 112 0.5 Chile 0 0.0 166 0.8 Germany 10 0.8 110 0.5 Somalia 0 0.0 55 0.3
Other Nordic Countries 6 0.5 87 0.4
Other EU except
Nordic Countries 9 0.8 191 0.9
Other 12 1.0 952 4.3
Total Foreign born 79 6.6 3,840 17.5
Total 1,200 100 21,947 100
As we can see from Table 11, there is a disproportionate amount of people of Swedish origin in the income elite; only 6.6 percent are born in a country other than Sweden despite the fact that 17.5 percent of employees in the organisation as a whole are foreign born. The groups of people born in Iraq, Chile and Somalia do not have any representa-tives at all in this group.
In the regression model shown in Table 12 we take region of origin, age, gender, level of education and year of immigration into account.4
In the regression analysis, one model has been created for women and one model for men. Those regions that are not represented among the managerial staff are excluded, that is Asia, Australia and Africa for women, and North America, Asia, Australia and Africa for men.
Table 12: Probability of being in the income elite in the City administration, in percentages.
Probability Women Men
University degree, 30 years, born in Sweden. 0.29 1.92 University degree, 50 years, born in Sweden. 8.14 46.16 University degree, 30 years, born in Nordic Countries,
year of immigration 1980-1989 0.26 0.30 University degree, 50 years, born in Nordic Countries,
year of immigration 1980-1989 7.15 11.59 University degree, 30 years, born in EU,
year of immigration 1980-1989. 0.16 0.68 University degree, 50 years, born in EU,
year of immigration 1980-1989 4.51 23.13 University degree, 30 years, born in Europe,
year of immigration 1980-1989. 0.09 0.25 University degree, 50 years, born in Europe,
year of immigration 1980-1989. 2.60 9.74 University degree, 30 years, born in North America,
year of immigration 1980-1989. 0.23
-University degree, 50 years, born in North America,
year of immigration 1980-1989. 6.34
-University degree, 30 years, born in Latin America,
year of immigration 1980-1989. 0.09 0.09 University degree, 50 years, born in Latin America,
year of immigration 1980-1989. 2.51 3.92 University degree, 30 years, born in Middle East,
year of immigration 1980-1989. 0.12 0.25 University degree, 50 years, born in Middle East,
year of immigration 1980-1989. 3.58 9.77
The regression yields interesting results. Despite the fact that the City administration is an organisation dominated by women, which implies that women ought to have a higher probability of belonging to the income elite, it is shown that women have a much lower probability of being part of the income elite compared to their male counter-parts. The difference between men born in Sweden and women born in Sweden is almost 40 percent. Gender and age are the variables that affect this probability the most (see the Appendix, Table A4). As is shown in Table 12, a person aged 30 has a very low probability of being part of the organisation’s income elite, while people aged 50 have a much higher probability. With the exception of men born in Sweden, the groups of 50 year olds with the highest probability are men born in the other Nordic countries and the EU countries. The other groups reach only a few percent. As already mentioned in the discussion about the best and worst paid, the education effect in the regression model would seem to be overrated for those born abroad.