DOI: https://doi.org/10.15626/Eco-Tech.2012.010
STABILIZATION OF CONTAMINATED
SEDIMENTS – A COMPARISON OF SHEAR
STRENGTH FROM LABORATORY MIXING AND
TESTING AND FIELD TESTING
Alf Lindmark
Cowi AB, Solna Strandväg 78 171 54 Stockholm, alfl@cowi.se
Anna Wilhelmsson
Cowi AB, Box 12076 402 41 Göteborg, aawn@cowi
KEYWORDS
Sediment, contamination, metals
1 INTRODUCTION
Many coastal cities in Sweden have hosed factory’s and manufacturing industries in the harbour area since the end of the 19 th century. The municipality of Oskarshamn, in the south east of Sweden, is no exception with heavy industries close to the port. In earlier days now one had any concerns regarding the environmental aspects on dumping contaminated aggregates in the sea. This has resulted in contaminated sediments in the harbour area and spreading effects in to the Baltic Sea.
The contamination contains of more than 1000 tonnes of heavy metals. The sediments also contain organics such as dioxins and organotin. The Swedish Environmental Protection Agency is contributing in a large extent to the funding for remediating the polluted sediments. The main target for the project is a long-term reduction of leakage of heavy metals and organic substances from the sediments.
The project includes remediation of approximately 500 000 m3 sediments. The main alternative for disposal of the polluted sediments is dredging, stabilization and solidification. In May 2011 the Municipality applied for a permit from the Environmental Court for remediation including dredging, utilization of the polluted sediments as construction material in the harbour area and construction works. The dredging is planned to start in 2013 with a first smaller volume of 30 000 m3. The rest of the dredging is going to start in 2014 with an execution time of 2 to 4 years. For several years a lot of investigations and laboratory tests have been performed regarding the content of metals and organic pollutants within the sediments. Laboratory tests have also been
made on stabilized sediment to determinate how the geotechnical and environmental characteristics develops over time as a function of amount and content of binder. To verify the laboratory results a pilot test was performed in June 2011 and evaluated during 12 months. The aims and objectives of the pilot test have been to find out how well the laboratory result of the stabilized sediments with different amount of binder correspond to a full scale performance. Measurements of the leaching of pollutants in the pore water and the hydraulic conductivity of the stabilized material has also been done. This paper will focus on the aspects of how to optimise the performance of the binders. To do this it is important to get a full picture of the stabilisation effect performed insitu and how this corresponds with test of binders mixed and tested in laboratory. Linnaeus ECO‐TECH 2012 2
2 STABILIZATION
2.1 Stabilization and solidification method
The method stabilization and solidification (s/s) means that a binder is mixed into the sediment. After stabilization the dredged material is modified so that predetermined geotechnical characteristics such as increased strength and improved deformation and environmental characteristics such as decreased leaching and reduced permeability can be achieved. A predefined amount of settlements can be obtained. The stabilized sediment can then be used as filling materials in port structures and replace crushed rock as filling material.
In Oskarshamn the characteristics of the dredged materials has a muddy texture, water ratio over 200 % and low strength. To be able to use the stabilized sediments in fillings the stabilized sediments has to full fill the given design criteria’s. Criteria’s given by demands for settlements and strength of the filling.
Binder recipes are site specific and depend on, for example, sediment type/ dredged materials, contaminant type, contaminant content, etc. Normally consisting of Portland cement and Merit 5000 (granulated steel slag) and different kind of ashes.
Finding the optimised binding concept for the stabilization reduces the risk of using more binders then necessary with high extra cost as a result or getting stabilized sediments not fulfilling the design criteria.
The project in Oskarshamn has tested the stabilization effects in a pilot scale in order to get more understanding of links between laboratory and insitu results. Result obtained from sediments mixed with binders in laboratory and then tested is compared with full scale mixing in a pilot test. The pilot scale test design for testing binders and their effect of gaining strengthening was performed in an area in the eastern part of the Port of Oskarshamn. In a lagoon nearby we also performed a study of the handling behaviour of the stabilized sediments: This abstract will only focus on the first one dealing with gained strength.
2.2 Laboratorial mixing and shear strength tests
Sediments mixed with binders and stored in the soil mechanical laboratory in Linköping have been tested regarding the shear strength with uniaxial compressive tests. A diagram presenting the results from mixing binders to the sediments in 100 kg/m³, 150 kg/m³ and 150 kg/m³ with an overload of 18 KPa during the curing time is shown below. Tests have been done after 7, 28, 91 and 365 days of curing time.
The tests in laboratory show an increasing strength due to curing time. The effect of more binders, 150 kg/m³ instead of 100 kg/m³ is also clear as well the effect of overload.
To find out if there are any differences between results from laboratory tests and results from sediments being mixed in field by the same conditions as in the production face pilot tests were carried out. The amounts of binders used in the laboratory tests correspond to the amounts used in the pilot test.
Figure 1 Shear strength with different amounts of binders and as a function of time from mixing.
2.3 The pilot test area
The pilot test area for testing gained strength was done in a lagoon with the size of approximately 10*10 m and with a depth of 3 m. A total amount of 200 m³ was dredged and stabilised. The binder consisted of 70 % Portland cement and 30 % Granulated blast furnace slag (Merit 5000) at a total binder amount of 100 and 150 kg/m³.
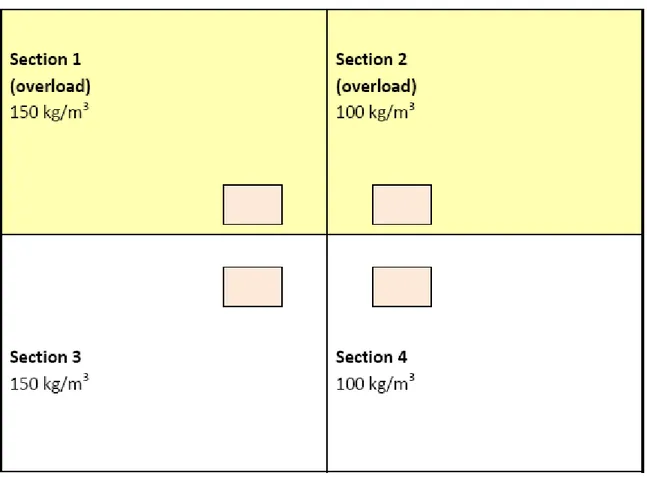
To mix the binders we used masstabilization in-situ. Masstabilization is an approved technic where a predetermined binder amount is mixed into the sediments following a grid pattern. The lagoon was divided into four sections, see Figure . Section 1 and 3 had a total binder amount of 150 kg/m³ and section 2 and 4 a total binder amount of 100 kg/m³. Section 1 and 2 had an overload consisting of one meter of gravel corresponding to an over load of 18 KPa. Section 3 and 4 did not have any overload.
Every section has a “measuring station” for measuring shear strength with shear vane drill and sampling ground water and performing hydraulic tests in ground water pipes. The shear strength was measured after 3, 19, 47 and 82 days. Sampling of pore water in the pipes was done after 2, 3 and 6 months. The hydraulic tests was performed as a slug test with the “Falling head method” after 3 and 6 months. By measuring the groundwater level the hydraulic conductivity could be calculated.
Figure 2 Lagoon for the alternative mass stabilization divided into section 1-4. The total amount of binder and with or without overload is marked in the figure. The position of the measuring station is marked within every section.
3 RESULTS
3.1 Shear strength with Shear vane drill after 82 days
The shear strength was measured at different depths within the stabilized material. Each measurement was performed in different points at different times due to the fact that the measurement is affecting the geotechnical properties of the material. The measurement points are situated as close to each other as possible, within an area of 1 m².
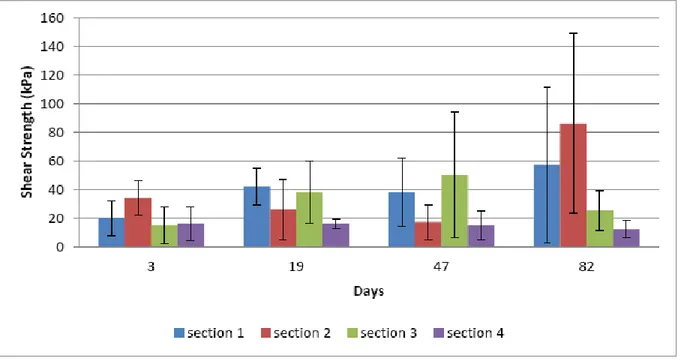
The results show big inhomogeneity in shear strength both in depth and in plane within the same section see Figure 2. Over time the shear strength increases for the sections with an overload (section 1 and 2) and reaches 50-82 KPa as an average value after 82 days. In the section without overload the shear strength varied from 10-22 KPa.
Variations in binder content can be a possible explanation to the big variations in shear strength. For the sections without an overload the same pattern is not so obvious. The effect of the overload can be seen, especially after 3 months curing time. When the obtained shear strength from the field test is compared with results from the laboratory tests the field test results are lower. Shear strength from field tests taken by vane drill are 50 % lower as a mean value, varying from 12-143 % of the laboratory values. The results from the field tests vary a lot booth in depth and plane. One single result of the vane drill can have a large impact on the mean value for a borehole test.
Figure 2. Shear strength as a function of curing time for the four sections. Standard deviation is marked for each bar.
3.2 Shear strength tested on drilled cores after 370 days
Given the results from both the field tests and the lab test the project group of the Oskarshamn remediation’s project decided to go in more in detail to be able to understand the differences in shear strength obtained in laboratory and felid testing. It is understandable if there are differences due to the fact that there are differences between the laboratory and the field conditions. The mixing procedure is different and the sediments used in the field tests have higher water content than the sediments used in the laboratory. To get a better understanding of the obtained stabilization results in field 3 cores were drilled in each all of the 4 section. The undisturbed drill
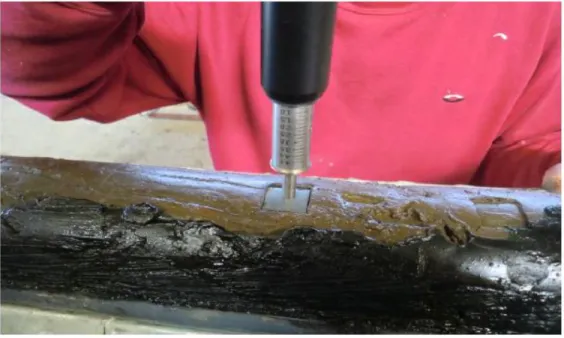
cores comes in diameter 105 mm and were first classified with a surface test program with penetrometer. This gave a relative strength (RS) test every 10 cm of the cores. The RS was later calibrated and linked to the shear strength from the sample that was chosen for test in lab. The RS classification also gave an overview and made it easier are to find out suitable sections for testing in the laboratory, using uniaxial compressive strength to get the shear strength.
Figure 4. Surface testing method on sediments cores
Figure 5. Surface penetration testing for every 10 cm of the cores to get an overall view of strength of the cores.
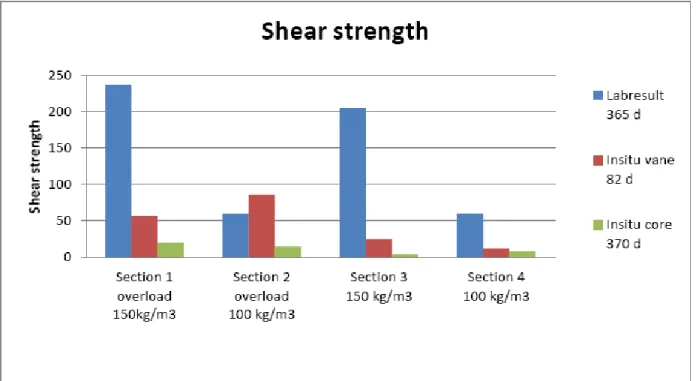
Results when testing cores in laboratory gave shear strength for chosen samples. Many parts of the core strings were too soft for handling and testing in laboratory. These soft parts were mapped with the surface penetrometer test to get an understanding of the shear strength even for those ones. Using the results from the samples tested in laboratory together with the surface mapping is has been possible to get a full picture of the strength distribution for the whole core string. Shear strength from field tests on cores are 12 % of the results from sediments mixed and tested laboratory as a mean value, varying from 2-25 % of the laboratory values.
Figure 6. Diagram with shear strength from lab tests, insitu vane drill and from cores drill in the different sections in the pilot test area.
4 CONCLUSIONS
The conclusions when comparing results from sediments stabilized in laboratory with shear strength tested with vane drill and shear strength from core from pilot test are the following.
- Comparing lab mixing stabilization with insitu stabilization gives differences of 50 % lower strength in field test with vane drill
- Comparing lab mixing stabilization with insitu stabilization shows results of 78 % lower strength in field test samples taken with core drill.
- The mixture process is probably the significant reason for the big differences in shear strength.
5 REFERENCES
Stabcon, Holm G. Svedberg B, Eriksson K., Vägledning för nyttiggörande av muddermassor i hamn- och anläggningskonstruktioner, Statens Geotekniska Institut, Information 20 (2011) Aranda C., Leaching test comparison for stabilized and solidified contaminated sediments. Assessment of selected inorganic contaminants. Master Thesis in Geosciences Discipline. Environmental Geology and Geohazards Department of Geosciences. Faculty of Mathematics and Natural Science University of Oslo (2008)